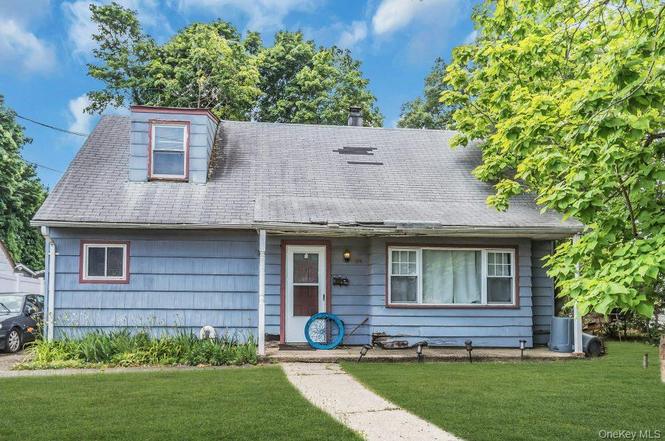
173 Denton Pl · Roosevelt, NY
Flood risk 1/10 · Minimal
- FEMA flood zone
- X (unshaded)
- Chance of flooding over 30 yrs
- 0.0%
- Est. flood insurance / yr
- $507 – $1,088
Fire risk 1/10 · Minimal
- Est. fire insurance / yr
- $691 – $1,283
Heat risk 6/10 · Moderate
- Hot days now (above 95°F)
- 7 days/yr
- Hot days in 30 yrs
- 16 days/yr
Wind risk 6/10 · Moderate
- Chance of severe wind over 30 yrs
- 53.0%
Air-quality risk 4/10 · Minor
- Unhealthy air days now
- 5 days/yr
- Unhealthy air days in 30 yrs
- 8 days/yr
Risk factors via First Street. Map © Google.
Why this score? — see what drove the C+ grade
The composite is a weighted blend of 9 inputs, each scored 0–100. Each bar is that input's sub-score; the figure is the points it added to the 100-point composite (weight × sub-score).
- Cash flow +22.9/30.0
- ARV discount +15.0/15.0
- DSCR +7.4/10.0
- 1% rule +7.1/10.0
- Livability +3.7/5.0
- Schools +3.3/10.0
- Rent growth +2.5/5.0
- Condition / age +2.5/5.0
- Appreciation +0.0/10.0
$345,000
🖨 Deal sheet 📄 Offer letter ✓ Due diligence
Listing remarks
Public online Auction: Bidding opens 7/07/26 @11 AM & Ends 7/09/26 +- 11 AM. The price of property exclusively represents the suggested opening bid & not the price of the property. Sold "as-is". Great opportunity for a buyer who does their homework & is looking to purchase a redevelopment opportunity in Roosevelt . This home has been condemned by TOH & there is no interior access. Walking the property will be at your own risk. Purchase includes any/ all contents. All info deemed reliable, however your due diligence is necessary. Please read VERY IMPORTANT attached info. Registration deadline: 7/8/26 by 4:00 pm
Key facts
- 5,500 sq ft lot
- Built 1950
- Listed 4 days
Property features AI
Finance
- HOA & community: One-time buyer's premium fee (small additional fee reported)
Exterior
- Parking: No carport; No designated parking features listed
- Utilities: Electric service by PSEG; Public sewer (additional sewer info in remarks); Utilities details available in remarks
- Home design: Single-family residence; Living area recorded from public records
- Construction: Frame construction
- Exterior features: Frame construction; Not waterfront
Interior
- Bathrooms: One full bathroom
- Heating & cooling: Oil heating; No central cooling
- Interior features: One and one-half level layout; Basement present (see remarks); Attic details available in remarks; Five total rooms; Property listed as fixer/actual condition
Neighborhood map
What this means for you Summary
Snapshot
- This is a 3-bed/1.0-bath single-family listed at $345k.
Deal economics
- At list price, monthly cash flow is $606 ($7k/yr) — positive.
- The deal already cash-flows at list — no discount required.
- Meets the 1% rule at list price ($4k rent vs $345k).
- Cap rate 8.4% vs local median 4.0% in Roosevelt — top-decile yield for the area; either an underpriced asset or a hidden risk that comps aren't pricing in. Stress-test before assuming the spread holds.
Location & tenants
- Location reads 73/100 on livability (#307 in NY) — a middle-class / working-renter tenant base. Strengths: commute A+, employment A+, housing A+; Watch: crime D+, amenities F, cost of living F.
- Roosevelt Union Free School District (suburban): math 28% / reading 45% proficiency, ranked #529 of 590 in NY (top 90%) — families likely to look elsewhere, expect single-tenant / working-renter base with shorter leases.
- Zoned schools: Washington Rose School (math 12% / reading 22%, grade F, #2,011 of 2,108 statewide, top 96%, 637 students, 54% FRL); Roosevelt Middle School (math 12% / reading 27%, grade F, #685 of 729 statewide, top 94%, 455 students, 0% FRL); Roosevelt High School (math 65% / reading 78%, grade B+, #698 of 1,100 statewide, top 63%, 1,075 students, 59% FRL) — zoned schools average 38% FRL vs 58% district-wide (20 pts lower); this property's tenant base skews higher-income than the district average.
- Market conditions: 52 active listings in the ZIP; 8 comparable units currently listed for rent nearby; rentals at typical pace (median 17d on market — plan ~3-4 weeks tenant-placement turnaround); 824 units permitted in Nassau County in 2024 (153 in 5+ unit buildings).
Forward outlook
- Local home prices are declining (-3.0%/yr); year-one equity from $2k of loan paydown is wiped out by about $10k of value loss. Plan a longer hold.
- Nassau County population projected at +7% by 2050 — modest demand growth; plan on rents tracking national, not racing it.
Negotiation context
- Only 4 days on market — expect competitive offers; lowballing is unlikely to land.
- Current owner paid $24k; list at $345k implies a 1308% gain — meaningful room to come down on a strong offer.
Risks & watch-outs
- Watch-outs: property tax is 2.6% of price; built in 1950 — expect roof / HVAC / electrical / plumbing capex.
- Climate carrying-cost: major wind risk, 53% chance of damaging wind over 30y; extreme-heat days projected 7→16/yr by 2055 (HVAC capex compounding) — expect insurance premiums to compound above CPI over the hold.
Questions for the listing agent
- Built in 1950 — when were the roof, HVAC, electrical panel, plumbing, and water heater last replaced?
- Property tax is high relative to price — has the assessment been appealed recently, and will the sale trigger a re-assessment?
- Is there a deadline driving the sale (1031 exchange, divorce, estate, relocation)? That informs how much negotiation room exists.
- Crime grade is D in this area — have there been break-ins, vandalism, or insurance claims at this property in the last 3 years? What carrier currently insures it and at what premium?
- What's the average days-on-market for RENTAL listings here right now (not sales)? A rising rental-DOM trend means longer vacancies and softer asking-rent achievability than the comps imply.
- What's the recent tenant-quality profile in this submarket — average credit score on applications, eviction rate, late-payment / NSF rate, and stable-employment percentage? A property-management company in the area should have these aggregated.
- How much new for-sale + rental construction is in the pipeline within 1–3 miles? Heavy new supply typically softens prices + rents 12–24 months out; constrained supply supports both.
Investment metrics
- 1% rule
- 1.21% ✓
- Cap rate
- 8.40%
- Cash-on-cash
- 7.53%
- DSCR
- 1.34
- GRM
- 6.9
CMA / ARV
- ARV (on-the-fly)
- $654,720
- Comps found
- 12
Show comp detail 12 sales within ~0.75 mi
| Address | Dist | Beds/Ba | Sqft | Sold | Price | $/sf | Match |
|---|---|---|---|---|---|---|---|
| 181 East Clinton Ave | 0.17mi | 3/1.0 | 1,167 (-6%) | 8mo | $500,000 | $428 | 76 |
| 17 Denton Pl | 0.12mi | 4/1.5 (+1) | 1,165 (-6%) | 4mo | $615,000 | $528 | 74 |
| 64 Conlon Rd | 0.20mi | 3/1.5 | 1,330 (+7%) | 4mo | $655,000 | $492 | 73 |
| 82 E Clinton Ave | 0.38mi | 3/2.0 | 1,204 (-3%) | 4mo | $588,000 | $488 | 70 |
| 204 Beechwood Ave | 0.30mi | 4/3.0 (+1) | 1,269 (+2%) | 8mo | $670,000 | $528 | 62 |
| 185 Grenada Ave | 0.29mi | 3/1.0 | 1,075 (-13%) | 4mo | $549,000 | $511 | 61 |
| 35 William St | 0.39mi | 4/2.0 (+1) | 1,330 (+7%) | 1mo | $602,000 | $453 | 60 |
| 84 E Greenwich Ave | 0.47mi | 4/2.0 (+1) | 1,176 (-5%) | 3mo | $670,000 | $570 | 58 |
| 54 Gormley Ave | 0.69mi | 3/2.0 | 1,211 (-2%) | 9mo | $710,000 | $586 | 53 |
| 852 Smith St | 0.52mi | 4/2.0 (+1) | 1,127 (-9%) | 5mo | $720,000 | $639 | 47 |
| 86 Decatur St | 0.64mi | 3/2.0 | 1,075 (-13%) | 3mo | $590,000 | $549 | 42 |
| 211 Manhattan Ave | 0.66mi | 3/2.0 | 1,380 (+11%) | 8mo | $710,000 | $514 | 40 |
Match score weights: distance 35% · size 25% · config 20% · recency 20%. Top-matched comps best support the ARV.
Projected returns pro-forma
-3.0% appreciation · 3.0% rent growth · sell at horizon
- IRR
- -4.7%
- Equity multiple
- 0.82×
- Total profit
- $-17,040
- Equity at exit
- $51,441
- IRR
- 5.0%
- Equity multiple
- 1.37×
- Total profit
- $35,923
- Equity at exit
- $29,829
Cash invested: $96,600 (down + closing). Projections, not guarantees.
Landlord ↔ Tenant lean methodology
- Overall (STATE)
- 15 Strongly Tenant-Friendly
- State New York
- 15 Strongly Tenant-Friendly · D+10
- County
- — inherits STATE
- City
- — inherits STATE
ZIP-level market 11575
- Active inventory
- 52
- Price-to-rent
- 6.9×
Monthly cashflow live
- Estimated rent
- $4,188 high interval (Pro) →
- Mortgage (P&I)
- −$1,809
- Tax from tax record
- −$749 /mo · $8,989/yr
- Insurance
- −$144
- HOA
- −$0
- Vacancy / Maint / Mgmt
- −$879
- Net cashflow
- $606
Break-even live
UW: 25.0% down · 7.5% · 30yr · 1.5% tax · 5.0% vac · 8.0% maint · 8.0% mgmt
Financing live
Cash to close
- Down payment
- $86,250
- Closing costs
- $10,350
- Reserves months
- —
- Total cash needed
- —
Loan-product check · same deal, 3 products live
Conventional
25% down · 7.5% · 30yr
- Down + closing
- —
- Monthly P&I
- —
- Monthly cashflow
- —
- DSCR
- —
- Eligible?
- —
Personal DTI + credit; lowest rate.
DSCR
20% down · 8.5% · 30yr
- Down + closing
- —
- Monthly P&I
- —
- Monthly cashflow
- —
- DSCR
- —
- Eligible?
- —
No personal income docs; deal must DSCR.
Hard money
10% down · 12.0% · 12mo
- Down + closing
- —
- Monthly P&I
- —
- Monthly cashflow
- —
- DSCR
- —
- Eligible?
- —
Short-term bridge; refi at stabilization.
Rent comps 8 comps
| Address | Beds | Baths | Sqft | Rent | $/sqft | DOM | Units | Dist |
|---|---|---|---|---|---|---|---|---|
| 21 W Centennial Ave Roosevelt, NY | 3.0 | 2.0 | 1176 | $3,600 | $3.06 | 18d | 1 | 0.70mi |
| 650 Winthrop Dr Uniondale, NY | 3.0 | 3.0 | 1300 | $4,900 | $3.77 | 1d | 1 | 0.78mi |
| 1526 Rhode Ave Merrick, NY | 4.0 | 2.0 | 1344 | $5,100 | $3.79 | 1d | 1 | 0.89mi |
| 1000 Brix Pl Uniondale, NY | 1.0–2.0 | 1.0–2.0 | 710 | $3,662 | $5.16 | 1d | 13 | 1.05mi |
| 965 Merrick Ave Unit 1st floor Merrick, NY | 3.0 | 1.0 | 1200 | $4,200 | $3.50 | 2d | 1 | 1.21mi |
| 196 E Seaman Ave Freeport, NY | 3.0 | 2.5 | 1062 | $8,500 | $8.00 | 16d | 1 | 1.30mi |
| 66 E Seaman Ave Freeport, NY | 3.0 | 2.5 | 1200 | $3,600 | $3.00 | 43d | 1 | 1.36mi |
| 529 Maple Ave Unit Second Floor Uniondale, NY | 3.0 | 2.0 | 1240 | $3,750 | $3.02 | 24d | 1 | 1.36mi |
Listing history 5 events
-
2026-06-18days on market $345,000 Active 4 DOM
-
2026-06-17days on market $345,000 Active 3 DOM
-
2026-06-16days on market $345,000 Active 2 DOM
-
2026-06-15remarks 627-char remark
-
2026-06-15$345,000 Active 1 DOM
ⓘ Source: listings_history table (triggers on properties + properties_extension) + one-shot
backfill from property_details.listing_events for pre-trigger history.
Tax reassessment forecast NY · Partial reset (capped growth)
- Current annual tax
- $8,989 · $749/mo
- Projected year-2 tax
- $8,989 · $749/mo
- Expected delta
- $0/yr ($0/mo · 0.0%)
ⓘ Screening estimate from a state-policy table — verify with the county assessor before closing.
Climate risk First Street
- Flood 1/10 Low FEMA zone X (unshaded) · 0% chance over 30 yrs
- Wildfire 1/10 Low
- Heat 6/10 Major 7 d/yr ≥95°F today · 16 d/yr by 30 yrs out
- Wind 6/10 Major 53% chance of damaging wind over 30 yrs
- Air quality 4/10 Moderate 5 unhealthy d/yr today · 8 by 30 yrs out
Nearby sold comps map
Loading sold comps map…
Walkable amenities ~0.75 mi
Loading nearby amenities…
Taxation est. · year 1
- Rental income
- $50,251
- − Mortgage interest
- −$19,325
- − Property taxes
- −$8,989
- − Insurance
- −$1,725
- − Repairs & maintenance
- −$4,020
- − Management
- −$4,020
- − Depreciation
- −$10,036
- Taxable income
- $2,135
- Est. tax owed @ 24.0%
- −$512
- After-tax cash flow
- $6,761/yr
For passive investors: Depreciation is non-cash, so a rental often shows a tax loss while cash-flowing — sheltering income. Rental losses are passive: they offset passive income freely, and up to $25,000/yr can offset ordinary (W-2) income if you actively participate and your MAGI is under $100k (phasing out to $0 by $150k); unused losses carry forward. On sale, claimed depreciation is recaptured at up to 25%, and gains may owe capital-gains tax (a 1031 exchange can defer both). Figures are a year-1 estimate at your 24.0% rate — not tax advice; consult a CPA.
Schools (NCES district)
- District
- Roosevelt Union Free School District
- NCES district ID
- 3624990
- Math proficiency
- 28% ▼ -4.00%
- Reading proficiency
- 45% ▲ 6.00%
- Median HH income
- $69,717
- Composite
- 33.41/100
- National rank
- #5472
- State rank
- #529 of 590 in NY
Livability — Roosevelt
- Score
- 73/100
- State rank
- #307
- US rank
- #5074
Category grades
Schools grade is shown separately in the Schools card above.
Census & demographics
- Census place
- Roosevelt, NY
- City population
- 19,430
- Population (ZIP)
- 19,430
Population outlook (Nassau County) Hauer SSP2
- Today (2025)
- 1,409,302 people
- By 2030
- 1,431,482 · +1.6%
- By 2040
- 1,471,607 · +4.4%
- By 2050
- 1,502,845 · +6.6%
- By 2075
- 1,575,403 · +11.8%
- By 2100
- 1,554,356 · +10.3%
Race, ethnicity, and origin ACS 2023
- Neighborhood character
- Diverse neighborhood (Simpson 0.55)
- Race & ethnicity
- Black 53% Hispanic / Latino 41% Two or more races 7% Asian 2% White 1%
- Hispanic origin (detail)
- Puerto Rican 6% Dominican 4%
- Common ancestry
- Hispanic 4%
- Foreign-born
- 36% · Canada, Jamaica, South Korea
- Languages at home
- 60% English-only · Spanish 34% French/Haitian/Cajun 4% Other Indo-European 2%
Political lean MEDSL · Nassau
- 2024 margin
- Toss-up / Even · D 47.9% · R 52.1%
- 2008→2024 swing
- -12.6pp toward R · 2008: 8.4pp · 2024: -4.2pp
- All cycles
- 2024: R+4.2 2020: D+9.5 2016: D+5.3 2012: D+6.7 2008: D+8.4
Not yet ingested
- Civics
- —
Market trends
- HPI YoY
- ▼ -368.53%
- Current HPI
- 364.7467
- Rent YoY
- —
- Metro
- —
- State GDP YoY
- ▲ 2.60%
- F500 in state
- 92
Industry mix (Fortune 500 HQ in NY)
| Industry | F500 HQs | Revenue |
|---|---|---|
| Financial Services | 10 | $950B |
|
||
| Consumer Goods | 9 | $162B |
|
||
| Insurance | 4 | $225B |
|
||
| Telecommunications | 2 | $144B |
|
||
| Pharmaceuticals | 2 | $112B |
|
||
| Media / Entertainment | 2 | $69B |
|
||
Price history
+1308.2% since first listed2 events — show timeline
- 2026-06-12 Listed $345,000 OneKey® MLS as Distributed by MLS Grid
- 1975-12-01 Sold (Public Records) $24,500 Public Records
Property tax history
+2.2%/yrLatest (2024): $8,989 · +2.3% YoY. Source: county tax records.
Cash-flow waterfall
monthlySold comps — $/sqft
last 12 mo · ≤1 miLoading sold comps…