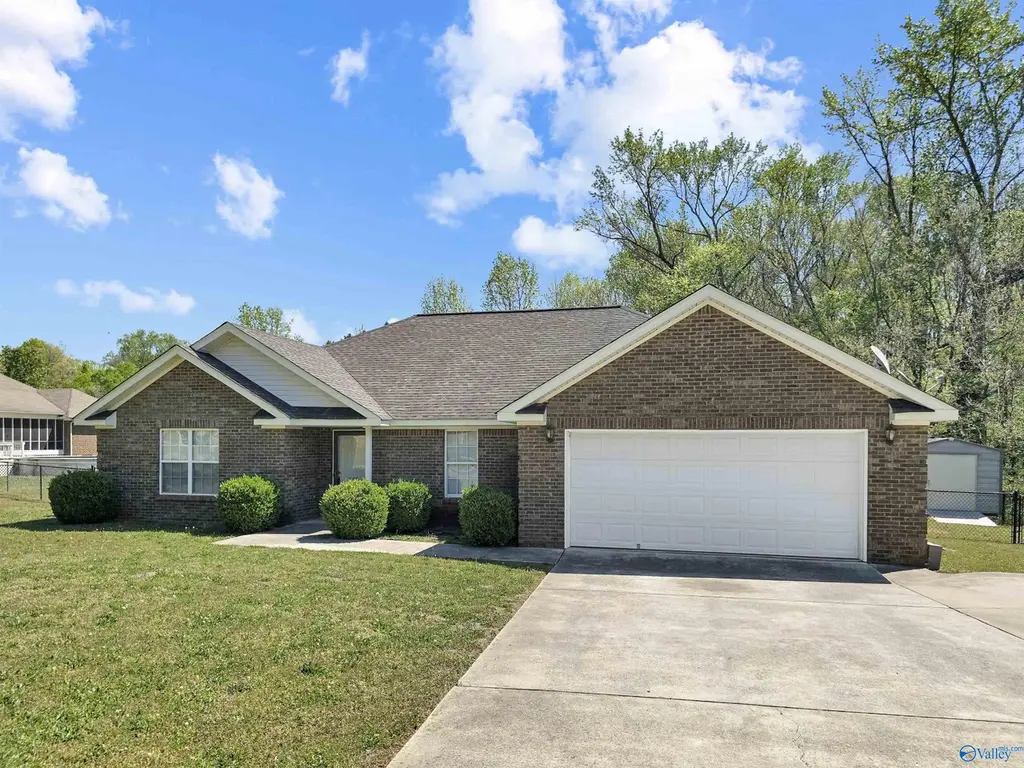
155 Hazel Trce · Hazel Green, AL
Flood risk 1/10 · Minimal
- FEMA flood zone
- X (unshaded)
- Chance of flooding over 30 yrs
- 0.0%
- Est. flood insurance / yr
- $507 – $1,088
Fire risk 3/10 · Minor
- Est. fire insurance / yr
- $916 – $1,700
Heat risk 5/10 · Moderate
- Hot days now (above 104°F)
- 7 days/yr
- Hot days in 30 yrs
- 19 days/yr
Wind risk 4/10 · Minor
- Chance of severe wind over 30 yrs
- 15.0%
Air-quality risk 2/10 · Minimal
- Unhealthy air days now
- 2 days/yr
- Unhealthy air days in 30 yrs
- 2 days/yr
Risk factors via First Street. Map © Google.
Why this score? — see what drove the D grade
The composite is a weighted blend of 9 inputs, each scored 0–100. Each bar is that input's sub-score; the figure is the points it added to the 100-point composite (weight × sub-score).
- Appreciation +10.0/10.0
- Cash flow +8.7/30.0
- ARV discount +8.0/15.0
- Schools +3.7/10.0
- Livability +3.5/5.0
- Rent growth +2.5/5.0
- Condition / age +2.5/5.0
- DSCR +2.4/10.0
- 1% rule +1.4/10.0
$264,900
🖨 Deal sheet (PDF) 📄 Offer letter ✓ Due diligence
Listing remarks
Full brick 3BR/2BA home w/ 2 car att garage, concrete patio & lg chain link fenced backyard—perfect for grilling and entertaining. Extended concrete driveway for additional parking. Smooth ceilings throughout. HW floors in foyer, LR, hallway & DR. Living room features propane FP, trey ceiling, crown molding, recessed lighting & ceiling fan. Eat-in kitchen w/ breakfast area, tile floors & SS appliances. Lg primary suite w/ trey ceiling, crown molding, ceiling fan & walk-in closet. Primary bath w/ jetted tub, sep shower & dual vanity. Seller offering flooring allowance for 2 BRs needing carpet.
Key facts
- Concrete patio
- Brick home
- Eat-in kitchen
Tags
Property features AI
Finance
- HOA & community: No homeowners association; Subdivision: Hazelwood
Exterior
- Parking: Attached oversized two-car garage; Concrete driveway; See remarks
- Utilities: Public water; Septic tank
- Home design: Single-family residence; One story; Built in 2007; Residential property
- Construction: Brick construction; Slab foundation
- Exterior features: Concrete driveway; Patio
Interior
- Kitchen: Range; Dishwasher; Microwave; Disposal
- Bedrooms: 7 total rooms (bedroom count not specified)
- Bathrooms: 2 full bathrooms
- Heating & cooling: Central heating; Central cooling
- Interior features: Gas log fireplace (one)
Neighborhood map
What this means for you Summary
Snapshot
- This is a 3-bed/1.0-bath single-family listed at $265k.
Deal economics
- At list price, monthly cash flow is $-222 ($-3k/yr) — negative.
- To cash-flow at today's rent, offer at most $226k (14.8% below list).
- To meet the 1% rule (rent ≥ 1% of price), the offer needs to be $169k (36.1% below list).
- Recommended offer: $169k (36.1% below list) — sets the bar for 1% rule.
- Cap rate 5.3% vs local median 3.9% in Hazel Green — top-decile yield for the area; either an underpriced asset or a hidden risk that comps aren't pricing in. Stress-test before assuming the spread holds.
Location & tenants
- Location reads 69/100 on livability (#54 in AL) — a middle-class / working-renter tenant base. Strengths: cost of living A+, housing A+, crime A; Watch: amenities F, commute F, employment F.
- Madison County (rural): math 27% / reading 56% proficiency, ranked #19 of 129 in AL (top 15%) — families likely to look elsewhere, expect single-tenant / working-renter base with shorter leases.
- Zoned schools: Hazel Green Elementary School (math 23% / reading 58%, grade F, #238 of 627 statewide, top 38%, 738 students, 50% FRL); Meridianville Middle School (math 19% / reading 62%, grade F, #56 of 257 statewide, top 22%, 724 students, 45% FRL); Hazel Green High School (math 23% / reading 31%, grade F, #90 of 305 statewide, top 35%, 1,348 students, 42% FRL) — zoned schools average 46% FRL vs 29% district-wide (16 pts higher); higher-poverty schools than district average — tighter screening recommended.
- Market conditions: 260 active listings in the ZIP; 12 comparable units currently listed for rent nearby; rentals at typical pace (median 25d on market — plan ~3-4 weeks tenant-placement turnaround); 4,709 units permitted in Madison County in 2024 (1,186 in 5+ unit buildings).
Forward outlook
- In year one you build about $28k of equity ($2k loan paydown + $26k appreciation (10.0% local appreciation)).
- Madison County population projected at +18% by 2050 — long-run rental-demand tailwind backs the buy-and-hold thesis.
- By year 2, paydown + projected appreciation supports a ~$46k cash-out refi (75% LTV) — recoverable capital for the next deal without selling this one.
Negotiation context
- It's been on market 70 days — a 6% lower offer ($249k) is reasonable based on typical stale-listing flexibility.
Risks & watch-outs
- Climate carrying-cost: extreme-heat days projected 7→19/yr by 2055 (HVAC capex compounding) — expect insurance premiums to compound above CPI over the hold.
Questions for the listing agent
- What do current leases actually rent for vs. the listed asking? Can we see a recent rent roll and the last 12 months of T-12 income?
- It's been on market 70 days. Have you received any prior offers? Is the seller open to a 36% concession, seller financing, or rate buy-down credit?
- Why hasn't it sold? Are there any deal-killer items the seller is aware of (foundation, flood, title, zoning, code violations)?
- Is there a deadline driving the sale (1031 exchange, divorce, estate, relocation)? That informs how much negotiation room exists.
- The area grade is low — what's the realistic commute time and amenity access for the typical tenant pool here? Any planned neighborhood developments (good or bad) we should know about?
- What's the average days-on-market for RENTAL listings here right now (not sales)? A rising rental-DOM trend means longer vacancies and softer asking-rent achievability than the comps imply.
- What's the recent tenant-quality profile in this submarket — average credit score on applications, eviction rate, late-payment / NSF rate, and stable-employment percentage? A property-management company in the area should have these aggregated.
- How much new for-sale + rental construction is in the pipeline within 1–3 miles? Heavy new supply typically softens prices + rents 12–24 months out; constrained supply supports both.
Investment metrics
- 1% rule
- 0.64% ✗
- Cap rate
- 5.29%
- Cash-on-cash
- -3.60%
- DSCR
- 0.84
- GRM
- 13.0
CMA / ARV
- ARV (on-the-fly)
- $267,685
- Comps found
- 12
Show comp detail 12 sales within ~0.75 mi
| Address | Dist | Beds/Ba | Sqft | Sold | Price | $/sf | Match |
|---|---|---|---|---|---|---|---|
| 128 Honeycutt Rd | 0.15mi | 4/2.0 (+1) | 1,739 (+2%) | 1mo | $278,000 | $160 | 80 |
| 145 Hazel Trce | 0.11mi | 3/2.0 | 1,600 (-6%) | 1mo | $262,500 | $164 | 80 |
| 162 Hazel Trce | 0.08mi | 4/2.0 (+1) | 1,850 (+8%) | 7mo | $295,000 | $159 | 67 |
| 104 Kathleen Dr | 0.24mi | 4/2.0 (+1) | 1,552 (-9%) | 2mo | $214,700 | $138 | 64 |
| 103 NW Lindsey Ln | 0.47mi | 3/2.0 | 1,817 (+7%) | 1mo | $175,000 | $96 | 62 |
| 147 Singletree Dr | 0.18mi | 3/2.0 | 1,865 (+9%) | 12mo | $270,000 | $145 | 62 |
| 207 Brook Wind Dr | 0.42mi | 4/2.0 (+1) | 1,600 (-6%) | 6mo | $262,500 | $164 | 56 |
| 576 Charity Ln | 0.68mi | 3/2.0 | 1,636 (-4%) | 3mo | $260,000 | $159 | 55 |
| 584 Charity Ln | 0.68mi | 3/2.0 | 1,615 (-5%) | 0mo | $230,000 | $142 | 55 |
| 104 NW Lindsey Ln | 0.52mi | 3/2.0 | 1,590 (-7%) | 6mo | $250,000 | $157 | 55 |
| 118 Hazelwood Dr | 0.55mi | 3/2.0 | 1,850 (+8%) | 10mo | $253,000 | $137 | 48 |
| 124 Singletree Dr | 0.41mi | 3/2.0 | 1,943 (+14%) | 12mo | $264,900 | $136 | 44 |
Match score weights: distance 35% · size 25% · config 20% · recency 20%. Top-matched comps best support the ARV.
Projected returns pro-forma
10.0% appreciation · 3.0% rent growth · sell at horizon
- IRR
- 21.7%
- Equity multiple
- 2.75×
- Total profit
- $129,977
- Equity at exit
- $238,643
- IRR
- 19.5%
- Equity multiple
- 6.31×
- Total profit
- $393,610
- Equity at exit
- $514,642
Cash invested: $74,172 (down + closing). Projections, not guarantees.
Landlord ↔ Tenant lean methodology
- Overall (STATE)
- 90 Strongly Landlord-Friendly
- State Alabama
- 90 Strongly Landlord-Friendly · R+15
- County
- — inherits STATE
- City
- — inherits STATE
ZIP-level market 35750
- Home prices YoY
- 8.2%
- Active inventory
- 260
- Price-to-rent
- 13.0×
Monthly cashflow live
- Estimated rent
- $1,693 high interval (Pro) →
- Mortgage (P&I)
- −$1,389
- Tax from tax record
- −$60 /mo · $718/yr
- Insurance
- −$110
- HOA
- −$0
- Vacancy / Maint / Mgmt
- −$355
- Net cashflow
- $-222
Break-even live
Sensitivity live
| Price | -10% $-72 | -5% $-147 | +0% $-222 | +5% $-297 | +10% $-372 |
|---|---|---|---|---|---|
| Rent | -10% $-356 | -5% $-289 | +0% $-222 | +5% $-155 | +10% $-89 |
| Rate | -1.0pp $-89 | -0.5pp $-155 | base $-222 | +0.5pp $-291 | +1.0pp $-361 |
UW: 25.0% down · 7.5% · 30yr · 1.5% tax · 5.0% vac · 8.0% maint · 8.0% mgmt
Financing live
Cash to close
- Down payment
- $66,225
- Closing costs
- $7,947
- Reserves months
- —
- Total cash needed
- —
Loan-product check · same deal, 3 products live
Conventional
25% down · 7.5% · 30yr
- Down + closing
- —
- Monthly P&I
- —
- Monthly cashflow
- —
- DSCR
- —
- Eligible?
- —
Personal DTI + credit; lowest rate.
DSCR
20% down · 8.5% · 30yr
- Down + closing
- —
- Monthly P&I
- —
- Monthly cashflow
- —
- DSCR
- —
- Eligible?
- —
No personal income docs; deal must DSCR.
Hard money
10% down · 12.0% · 12mo
- Down + closing
- —
- Monthly P&I
- —
- Monthly cashflow
- —
- DSCR
- —
- Eligible?
- —
Short-term bridge; refi at stabilization.
Rent comps 12 comps
| Address | Beds | Baths | Sqft | Rent | $/sqft | DOM | Units | Dist |
|---|---|---|---|---|---|---|---|---|
| 149 Hazel Trce Hazel Green, AL | 3.0 | 2.0 | 1628 | $1,695 | $1.04 | 15d | 1 | 0.10mi |
| 100 Brook Glen Dr Hazel Green, AL | 3.0 | 2.0 | 1336 | $1,595 | $1.19 | 15d | 1 | 0.45mi |
| 137 Hazel Pine Trl Hazel Green, AL | 3.0 | 2.0 | 1482 | $1,650 | $1.11 | 25d | 1 | 0.83mi |
| 236 Cherry Laurel Dr Hazel Green, AL | 4.0 | 3.0 | 1964 | $1,750 | $0.89 | 25d | 1 | 1.05mi |
| 117 Hank Ct Hazel Green, AL | 3.0 | 2.0 | 1517 | $1,650 | $1.09 | 45d | 1 | 1.12mi |
| 120 Grip Dr Hazel Green, AL | 4.0 | 2.0 | 1732 | $1,823 | $1.05 | 23d | 1 | 1.14mi |
| 189 Tobin Ln Hazel Green, AL | 3.0 | 2.0 | 1685 | $1,775 | $1.05 | 15d | 1 | 1.14mi |
| 108 Karenlee Cir Hazel Green, AL | 4.0 | 2.0 | 1666 | $1,685 | $1.01 | 25d | 1 | 1.19mi |
| 143 Havner Dr Hazel Green, AL | 4.0 | 2.0 | 1667 | $1,775 | $1.06 | 15d | 1 | 1.27mi |
| 171 Keller Dr Hazel Green, AL | 3.0 | 2.0 | 1683 | $1,616 | $0.96 | 45d | 1 | 1.30mi |
| 147 Tobin Ln Hazel Green, AL | 4.0 | 2.0 | 1884 | $1,700 | $0.90 | 45d | 1 | 1.31mi |
| 169 Keller Dr Hazel Green, AL | 3.0 | 2.0 | 1537 | $1,665 | $1.08 | 15d | 1 | 1.31mi |
Listing history 16 events
-
2026-06-22days on market $264,900 Active 70 DOM
-
2026-06-18days on market $264,900 Active 67 DOM
-
2026-06-17days on market $264,900 Active 66 DOM
-
2026-06-16days on market $264,900 Active 65 DOM
-
2026-06-15days on market $264,900 Active 64 DOM
-
2026-06-14days on market $264,900 Active 62 DOM
-
2026-06-10days on market $264,900 Active 59 DOM
-
2026-06-09days on market $264,900 Active 58 DOM
-
2026-06-08days on market $264,900 Active 57 DOM
-
2026-06-07statusdays on market $264,900 Active 56 DOM
-
2026-06-02days on market $264,900 Contingent 51 DOM
-
2026-06-01days on market $264,900 Contingent 50 DOM
-
2026-05-31days on market $264,900 Contingent 49 DOM
-
2026-05-30days on market $264,900 Contingent 48 DOM
-
2026-04-23historical Contingent
-
2026-04-12$264,900 Active
ⓘ Source: listings_history table (triggers on properties + properties_extension) + one-shot
backfill from property_details.listing_events for pre-trigger history.
Tax reassessment forecast AL · Resets to sale price
- Current annual tax
- $718 · $60/mo
- Projected year-2 tax
- $1,086 · $91/mo
- Expected delta
- +$368/yr (+$31/mo · 51.2%)
ⓘ Screening estimate from a state-policy table — verify with the county assessor before closing.
Climate risk First Street
- Flood 1/10 Low FEMA zone X (unshaded) · 0% chance over 30 yrs
- Wildfire 3/10 Moderate
- Heat 5/10 Major 7 d/yr ≥104°F today · 19 d/yr by 30 yrs out
- Wind 4/10 Moderate 15% chance of damaging wind over 30 yrs
- Air quality 2/10 Low 2 unhealthy d/yr today · 2 by 30 yrs out
Nearby sold comps map
Loading sold comps map…
Walkable amenities ~0.75 mi
Loading nearby amenities…
Taxation est. · year 1
- Rental income
- $20,311
- − Mortgage interest
- −$14,839
- − Property taxes
- −$718
- − Insurance
- −$1,324
- − Repairs & maintenance
- −$1,625
- − Management
- −$1,625
- − Depreciation
- −$7,706
- Taxable loss
- −$7,526
- Est. tax savings @ 24.0%
- +$1,806
- After-tax cash flow
- $-860/yr
For passive investors: Depreciation is non-cash, so a rental often shows a tax loss while cash-flowing — sheltering income. Rental losses are passive: they offset passive income freely, and up to $25,000/yr can offset ordinary (W-2) income if you actively participate and your MAGI is under $100k (phasing out to $0 by $150k); unused losses carry forward. On sale, claimed depreciation is recaptured at up to 25%, and gains may owe capital-gains tax (a 1031 exchange can defer both). Figures are a year-1 estimate at your 24.0% rate — not tax advice; consult a CPA.
Schools (NCES district)
- District
- Madison County
- NCES district ID
- 0102220
- Math proficiency
- 27% ▼ -32.00%
- Reading proficiency
- 56% ▼ -1.00%
- Median HH income
- $66,058
- Composite
- 37.15/100
- National rank
- #4483
- State rank
- #19 of 129 in AL
Livability — Hazel Green
- Score
- 69/100
- State rank
- #54
- US rank
- #8575
Category grades
Schools grade is shown separately in the Schools card above.
Census & demographics
- County
- Madison County · 380,832 people
- City population
- 13,413
- Metro
- Huntsville, AL
- Population (ZIP)
- 13,413
- Household income
- $68,389
- Rent vs Own
- Severe rent burden
- 162.0
Population outlook (Madison County) Hauer SSP2
- Today (2025)
- 392,086 people
- By 2030
- 409,788 · +4.5%
- By 2040
- 440,557 · +12.4%
- By 2050
- 460,990 · +17.6%
- By 2075
- 502,872 · +28.3%
- By 2100
- 513,623 · +31.0%
Race, ethnicity, and origin ACS 2023
- Neighborhood character
- Predominantly White (71%)
- Race & ethnicity
- White 71% Black 19% Asian 5% Two or more races 3% Hispanic / Latino 2%
- Common ancestry
- Slovak 1% Serbian 1% Romanian 1%
- Foreign-born
- 3% · Canada
- Languages at home
- 95% English-only · Spanish 2% Chinese 1% Korean 1%
Political lean MEDSL · Madison
- 2024 margin
- Lean R (+9.0) · D 44.7% · R 53.7% · Other 1.6%
- 2008→2024 swing
- +6.0pp toward D · 2008: -14.9pp · 2024: -9.0pp
- All cycles
- 2024: R+9.0 2020: R+8.0 2016: R+16.8 2012: R+18.7 2008: R+14.9
Not yet ingested
- Civics
- —
Market trends
- HPI YoY
- ▲ 33.59%
- Current HPI
- 444.7418
- Rent YoY
- —
- Metro
- Huntsville, AL
- State GDP YoY
- ▲ 2.94%
- F500 in state
- 4
Industry mix (Fortune 500 HQ in AL)
| Industry | F500 HQs | Revenue |
|---|---|---|
| Financial Services | 1 | $8B |
|
||
| Healthcare | 1 | $5B |
|
||
Price history
2 events — show timeline
- 2026-04-23 Contingent — VMLS
- 2026-04-12 Listed $264,900 VMLS
Property tax history
+4.8%/yrLatest (2024): $718 · +0.0% YoY. Source: county tax records.
Cash-flow waterfall
monthlySold comps — $/sqft
last 12 mo · ≤1 miLoading sold comps…