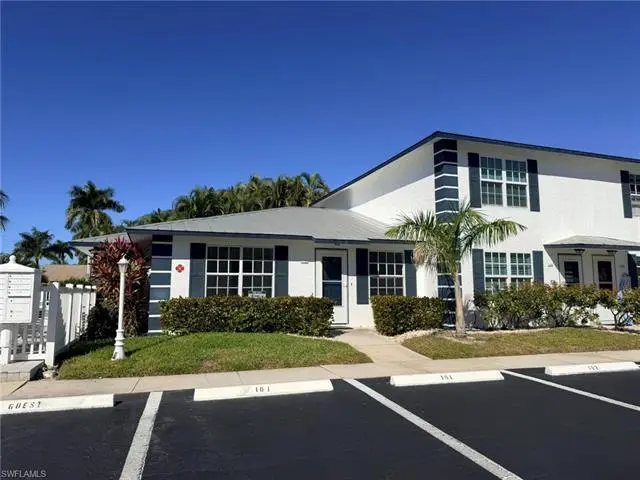
761 W Elkcam Cir Unit A101 · Marco Island, FL
Flood risk 9/10 · Severe
- FEMA flood zone
- AE
- Chance of flooding over 30 yrs
- 0.99%
- Est. flood insurance / yr
- $1,737 – $8,500
Fire risk 3/10 · Minor
- Est. fire insurance / yr
- $947 – $1,759
Heat risk 10/10 · Severe
- Hot days now (above 108°F)
- 7 days/yr
- Hot days in 30 yrs
- 30 days/yr
Wind risk 10/10 · Severe
- Chance of severe wind over 30 yrs
- 99.0%
Air-quality risk 3/10 · Minor
- Unhealthy air days now
- 3 days/yr
- Unhealthy air days in 30 yrs
- 3 days/yr
Risk factors via First Street. Map © Google.
Why this score? — see what drove the B grade
The composite is a weighted blend of 9 inputs, each scored 0–100. Each bar is that input's sub-score; the figure is the points it added to the 100-point composite (weight × sub-score).
- Cash flow +30.0/30.0
- 1% rule +10.0/10.0
- DSCR +10.0/10.0
- ARV discount +7.5/15.0
- Schools +5.0/10.0
- Rent growth +4.1/5.0
- Livability +3.6/5.0
- Condition / age +2.5/5.0
- Appreciation +0.0/10.0
$318,900
🖨 Deal sheet (PDF) 📄 Offer letter ✓ Due diligence
Listing remarks
One or more photo(s) has been virtually staged, AI generated or rendered. Experience island living at its finest in this fully renovated, first-floor end-unit villa in the private Sand Star Villas community on Marco Island. This charming home offers 2 bedrooms and 2 full bathrooms within 846 square feet of thoughtfully updated living space — perfect for full-time residence, seasonal getaways, or vacation rentals. Inside, you’ll enjoy fresh vinyl flooring throughout, freshly painted walls, and a modern kitchen featuring stylish countertops and contemporary appliances. Both bathrooms have been completely remodeled, and convenient in-unit laundry hookups add to the functionality. T
Key facts
- Fully renovated
- Generous lanai
- Modern kitchen
Tags
Property features AI
Finance
- Other: Part of a complex with 22 units (11 units in the building); Unit is first floor, one floor in the building; Unit is A101 in Sand Star Villas, Marco Island
- HOA & community: Mandatory HOA with professional management; Quarterly condo fee ($2,400); Total annual recurring fees $9,600; HOA covers insurance, lawn/land maintenance, legal/accounting, manager, exterior pest control, recreation facilities, sewer, street lights, and trash removal; Community amenities include a community pool, sidewalks, and streetlights; Non-gated community
Exterior
- Parking: 2 assigned parking spaces
- Utilities: Central water; Central sewer; Cable available
- Home design: Residential end-unit; Low-rise building (1-3 stories); Rear exposure facing northwest
- Construction: Concrete block construction; Metal roof; Stone exterior finish; Double-hung windows; Built in 1988; End-unit
- Exterior features: Patio; Landscaped area view
Interior
- Kitchen: Dishwasher; Microwave; Range
- Bedrooms: 2 bedrooms
- Flooring: Vinyl
- Bathrooms: 2 full bathrooms; Master bathroom with shower only
- Heating & cooling: Central electric heat; Central electric cooling; Ceiling fans
- Interior features: Walk-in closet; Split bedrooms floor plan; Screened lanai/porch; Dining area (living) and breakfast bar; Unfurnished
- Laundry & utility: Laundry in residence
Neighborhood map
What this means for you Summary
Snapshot
- This is a 2-bed/2.0-bath condo listed at $319k.
Deal economics
- At list price, monthly cash flow is $763 ($9k/yr) — positive.
- The deal already cash-flows at list — no discount required.
- Meets the 1% rule at list price ($5k rent vs $319k).
- Recommended offer: $281k (12.0% below list) — sets the bar for market timing.
Location & tenants
- Location reads 71/100 on livability (#404 in FL) — a middle-class / working-renter tenant base. Strengths: crime A+, employment A+, health & safety A+; Watch: amenities F, commute F, cost of living F.
- Collier (suburban): math 60% / reading 56% proficiency, ranked #16 of 73 in FL (top 22%) — acceptable for families but not a draw, mixed tenant base, ~2y average lease.
- Zoned schools: Tommie Barfield Elementary School (math 84% / reading 75%, grade A, #116 of 2,144 statewide, top 6%, 464 students, 30% FRL); Manatee Middle School (math 61% / reading 43%, grade C+, #217 of 571 statewide, top 40%, 749 students, 64% FRL); Lely High School (math 40% / reading 39%, grade F, #304 of 667 statewide, top 47%, 1,504 students, 54% FRL).
- Market conditions: Rents rising fast (+6.6%/yr); 689 active listings in the ZIP; 25 comparable units currently listed for rent nearby; rentals at typical pace (median 25d on market — plan ~3-4 weeks tenant-placement turnaround); solid renter incomes; 3,520 units permitted in Collier County in 2024 (959 in 5+ unit buildings).
- At $5,086/mo this rent would consume 60% of the median local household income ($102k/yr) (locally 314% of renters already pay >50% of income on rent) — very limited rent-growth headroom before tenants either downsize or default.
Forward outlook
- Local home prices are declining (-3.0%/yr); year-one equity from $2k of loan paydown is wiped out by about $10k of value loss. Plan a longer hold.
- Collier County population projected at +30% by 2050 — long-run rental-demand tailwind backs the buy-and-hold thesis.
- At projected returns (-3.0% appreciation + 6.6% rent growth), your $89k cash investment doubles in ~8 years — after that, you're playing with house money.
Negotiation context
- It's been on market 181 days — a 12% lower offer ($281k) is reasonable based on typical stale-listing flexibility.
- 13 sale attempts since 2y ago; this cycle's ask has dropped $36k (10%) from the opening price — seller is motivated, your offer sets the floor, not the list.
- Current owner paid $125k; list at $319k implies a 155% gain — meaningful room to come down on a strong offer.
Risks & watch-outs
- Watch-outs: flood insurance adds $427/mo.
- Climate carrying-cost: in FEMA flood zone AE (mandatory federal flood insurance); severe wind risk, 99% chance of damaging wind over 30y; extreme-heat days projected 7→30/yr by 2055 (HVAC capex compounding) — expect insurance premiums to compound above CPI over the hold.
Questions for the listing agent
- It's been on market 181 days. Have you received any prior offers? Is the seller open to a 12% concession, seller financing, or rate buy-down credit?
- What's the actual annual flood-insurance premium (NFIP or private), and is the property in a SFHA with mandatory coverage?
- What does the HOA fee cover, when was the last increase, and are there any pending special assessments or reserve-fund shortfalls?
- Any open or pending special assessments — roof, HVAC, plumbing, elevator, façade? What's the per-unit balance and payoff schedule, and is the seller paying it off at close or rolling it to the buyer?
- Why hasn't it sold? Are there any deal-killer items the seller is aware of (foundation, flood, title, zoning, code violations)?
- Is there a deadline driving the sale (1031 exchange, divorce, estate, relocation)? That informs how much negotiation room exists.
- Schools are A-rated — typically a magnet for longer-tenancy family renters. What's the average tenant stay here, and is there a school-zone premium baked into asking?
- What's the average days-on-market for RENTAL listings here right now (not sales)? A rising rental-DOM trend means longer vacancies and softer asking-rent achievability than the comps imply.
- What's the recent tenant-quality profile in this submarket — average credit score on applications, eviction rate, late-payment / NSF rate, and stable-employment percentage? A property-management company in the area should have these aggregated.
- How much new apartment / multifamily construction is in the pipeline within 1–3 miles? Heavy new supply (>2% of stock underway) typically softens rents 12–24 months out; light construction supports rent growth.
Investment metrics
- 1% rule
- 1.59% ✓
- Cap rate
- 10.77%
- Cash-on-cash
- 15.98%
- DSCR
- 1.71
- GRM
- 5.2
CMA / ARV
No comps found within radius.
Projected returns pro-forma
-3.0% appreciation · 6.59% rent growth · sell at horizon
- IRR
- 4.6%
- Equity multiple
- 1.19×
- Total profit
- $16,662
- Equity at exit
- $47,549
- IRR
- 18.1%
- Equity multiple
- 2.84×
- Total profit
- $164,099
- Equity at exit
- $27,573
Cash invested: $89,292 (down + closing). Projections, not guarantees.
Landlord ↔ Tenant lean methodology
- Overall (STATE)
- 87 Strongly Landlord-Friendly
- State Florida
- 87 Strongly Landlord-Friendly · R+3
- County
- — inherits STATE
- City
- — inherits STATE
ZIP-level market 34145
- Rents YoY
- 6.6%
- Active inventory
- 689
- Price-to-rent
- 5.2×
Monthly cashflow live
- Estimated rent
- $5,086 high interval (Pro) →
- Mortgage (P&I)
- −$1,672
- Tax from tax record
- −$224 /mo · $2,683/yr
- Insurance
- −$133
- Flood insurance flood zone
- −$427 /mo · $5,118/yr
- HOA
- −$800
- Vacancy / Maint / Mgmt
- −$1,068
- Net cashflow
- $763
Break-even live
Sensitivity live
| Price | -10% $943 | -5% $853 | +0% $763 | +5% $672 | +10% $582 |
|---|---|---|---|---|---|
| Rent | -10% $361 | -5% $562 | +0% $763 | +5% $964 | +10% $1,165 |
| Rate | -1.0pp $923 | -0.5pp $844 | base $763 | +0.5pp $680 | +1.0pp $596 |
UW: 25.0% down · 7.5% · 30yr · 1.5% tax · 5.0% vac · 8.0% maint · 8.0% mgmt
Financing live
Cash to close
- Down payment
- $79,725
- Closing costs
- $9,567
- Reserves months
- —
- Total cash needed
- —
Loan-product check · same deal, 3 products live
Conventional
25% down · 7.5% · 30yr
- Down + closing
- —
- Monthly P&I
- —
- Monthly cashflow
- —
- DSCR
- —
- Eligible?
- —
Personal DTI + credit; lowest rate.
DSCR
20% down · 8.5% · 30yr
- Down + closing
- —
- Monthly P&I
- —
- Monthly cashflow
- —
- DSCR
- —
- Eligible?
- —
No personal income docs; deal must DSCR.
Hard money
10% down · 12.0% · 12mo
- Down + closing
- —
- Monthly P&I
- —
- Monthly cashflow
- —
- DSCR
- —
- Eligible?
- —
Short-term bridge; refi at stabilization.
Rent comps 25 comps
| Address | Beds | Baths | Sqft | Rent | $/sqft | DOM | Units | Dist |
|---|---|---|---|---|---|---|---|---|
| 761 W Elkcam Cir Unit B110 Marco Island, FL | 2.0 | 2.5 | 1066 | $3,500 | $3.28 | 25d | 1 | 0.03mi |
| 750 W Elkcam Cir #315 Marco Island, FL | 2.0 | 2.0 | 990 | $5,600 | $5.66 | 25d | 1 | 0.03mi |
| 731 W Elkcam Cir Unit A109 Marco Island, FL | 2.0 | 2.5 | 1066 | $2,500 | $2.35 | 25d | 1 | 0.06mi |
| 694 W Elkcam Cir #1123 Marco Island, FL | 2.0 | 2.0 | 945 | $2,530 | $2.68 | 25d | 1 | 0.09mi |
| 651 W Elkcam Cir #815 Marco Island, FL | 2.0 | 2.0 | 813 | $4,700 | $5.78 | 25d | 1 | 0.10mi |
| 457 Tallwood St #106 Marco Island, FL | 1.0 | 1.0 | 539 | $1,600 | $2.97 | 25d | 1 | 0.68mi |
| 591 Seaview Ct Unit A306 Marco Island, FL | 2.0 | 2.0 | 964 | $6,000 | $6.22 | 25d | 1 | 0.90mi |
| 601 Seaview Ct Unit C106 Marco Island, FL | 2.0 | 2.0 | 964 | $5,700 | $5.91 | 25d | 1 | 0.95mi |
| 651 Seaview Ct Unit B207 Marco Island, FL | 2.0 | 2.0 | 1075 | $6,000 | $5.58 | 25d | 1 | 0.96mi |
| 440 Seaview Ct #912 Marco Island, FL | 2.0 | 2.0 | 1099 | $6,500 | $5.91 | 15d | 1 | 1.05mi |
| 380 Seaview Ct #305 Marco Island, FL | 2.0 | 2.0 | 1100 | $6,000 | $5.45 | 15d | 1 | 1.05mi |
| 260 Seaview Ct #604 Marco Island, FL | 2.0 | 2.0 | 1070 | $8,000 | $7.48 | 15d | 1 | 1.11mi |
| 240 Seaview Ct #413 Marco Island, FL | 1.0 | 1.0 | 750 | $6,500 | $8.67 | 25d | 1 | 1.13mi |
| 1215 Edington Pl Unit A6 Marco Island, FL | 1.0 | 1.0 | 570 | $4,500 | $7.89 | 23d | 1 | 1.14mi |
| 240 Seaview Ct #211 Marco Island, FL | 2.0 | 2.0 | 1075 | $11,000 | $10.23 | 23d | 1 | 1.14mi |
| 167 N Collier Blvd Marco Island, FL | 2.0 | 1.0 | 555 | $2,100 | $3.78 | 15d | 2 | 1.15mi |
| 130 N Collier Blvd Unit A6 Marco Island, FL | 2.0 | 1.0 | 704 | $1,900 | $2.70 | 25d | 1 | 1.22mi |
| 180 Seaview Ct Marco Island, FL | 1.0–2.0 | 1.5–2.0 | 721 | $4,500 | $6.24 | 25d | 2 | 1.25mi |
| 140 Seaview Ct Unit 902S Marco Island, FL | 2.0 | 2.0 | 837 | $9,000 | $10.75 | 25d | 1 | 1.26mi |
| 140 Seaview Ct #1504 Marco Island, FL | 1.0 | 1.5 | 610 | $2,200 | $3.61 | 25d | 1 | 1.26mi |
| 87 N Collier Blvd Unit J16 Marco Island, FL | 2.0 | 1.5 | 787 | $5,550 | $7.05 | 15d | 1 | 1.30mi |
| 87 N Collier Blvd Marco Island, FL | 1.0–2.0 | 1.0–1.5 | 663 | $5,550 | $8.36 | 25d | 3 | 1.31mi |
| 58 N Collier Blvd Marco Island, FL | 2.0 | 2.0 | 1071 | $9,750 | $9.10 | 25d | 2 | 1.40mi |
| 60 Pelican St W Naples, FL | 1.0 | 1.0 | 941 | $2,875 | $3.06 | 25d | 2 | 1.40mi |
| 762 San Marco Rd Unit 4-108 Marco Island, FL | 2.0 | 2.0 | 814 | $4,500 | $5.53 | 25d | 1 | 1.40mi |
HOA detail condo
- Monthly dues
- $800 · $9,600/yr
- Assessments
- None detected in remarks — confirm with the listing agent.
Listing history 50 events
-
2026-06-07statusdays on market $318,900 Pending 181 DOM
-
2026-06-03days on market $318,900 Active 180 DOM
-
2026-06-02days on market $318,900 Active 179 DOM
-
2026-06-01days on market $318,900 Active 178 DOM
-
2026-05-31days on market $318,900 Active 177 DOM
-
2026-05-30days on market $318,900 Active 176 DOM
-
2026-04-21price $318,900
-
2026-03-06price $325,000
-
2026-01-31price $335,000
-
2026-01-08price $345,000
-
2025-12-05$354,900 Active
-
2025-11-21historical
-
2025-11-12status Active
-
2025-10-23$359,000 Active
-
2025-10-07$359,000 Active
-
2025-09-26historical
-
2025-08-18price $364,500
-
2025-08-18price $364,500
-
2025-08-03status Active
-
2025-07-04historical Pending with Contingency
-
2025-07-03price $369,900
-
2025-07-03price $369,900
-
2025-06-13price $379,900
-
2025-06-13price $379,900
-
2025-05-02price $389,900
-
2025-05-02price $389,900
-
2025-04-03price $399,900
-
2025-04-03price $399,900
-
2025-03-16status Active
-
2025-03-16$415,000 Active
-
2025-02-28price $415,000
-
2025-02-28status Active
-
2025-02-27historical
-
2025-02-01price $429,000
-
2025-02-01price $429,000
-
2025-01-25$439,900 Active
-
2024-12-27historical
-
2024-12-18price $439,900
-
2024-11-01price $450,000
-
2024-11-01price $450,000
-
2024-10-29$475,000 Active
-
2024-09-27$475,000 Active
-
2024-05-16historical
-
2024-05-08price $355,000
-
2024-05-08price $355,000
-
2024-04-02price $364,900
-
2024-04-02price $364,900
-
2024-02-29price $375,000
-
2024-02-29price $375,000
-
2024-02-07price $384,900
ⓘ Source: listings_history table (triggers on properties + properties_extension) + one-shot
backfill from property_details.listing_events for pre-trigger history.
Tax reassessment forecast FL · Resets to sale price
- Current annual tax
- $2,683 · $224/mo
- Projected year-2 tax
- $2,683 · $224/mo
- Expected delta
- $0/yr ($0/mo · 0.0%)
ⓘ Screening estimate from a state-policy table — verify with the county assessor before closing.
Climate risk First Street
- Flood 9/10 Extreme FEMA zone AE · 99% chance over 30 yrs
- Wildfire 3/10 Moderate
- Heat 10/10 Extreme 7 d/yr ≥108°F today · 30 d/yr by 30 yrs out
- Wind 10/10 Extreme 99% chance of damaging wind over 30 yrs
- Air quality 3/10 Moderate 3 unhealthy d/yr today · 3 by 30 yrs out
Nearby sold comps map
Loading sold comps map…
Walkable amenities ~0.75 mi
Loading nearby amenities…
Taxation est. · year 1
- Rental income
- $61,035
- − Mortgage interest
- −$17,863
- − Property taxes
- −$2,683
- − Insurance
- −$6,713
- − Repairs & maintenance
- −$4,883
- − Management
- −$4,883
- − HOA
- −$9,600
- − Depreciation
- −$9,277
- Taxable income
- $5,133
- Est. tax owed @ 24.0%
- −$1,232
- After-tax cash flow
- $7,921/yr
For passive investors: Depreciation is non-cash, so a rental often shows a tax loss while cash-flowing — sheltering income. Rental losses are passive: they offset passive income freely, and up to $25,000/yr can offset ordinary (W-2) income if you actively participate and your MAGI is under $100k (phasing out to $0 by $150k); unused losses carry forward. On sale, claimed depreciation is recaptured at up to 25%, and gains may owe capital-gains tax (a 1031 exchange can defer both). Figures are a year-1 estimate at your 24.0% rate — not tax advice; consult a CPA.
Schools (NCES district)
- District
- Collier
- NCES district ID
- 1200330
- Math proficiency
- 60% ▼ -4.00%
- Reading proficiency
- 56% ▼ -2.00%
- Median HH income
- $58,275
- Composite
- 50.23/100
- National rank
- #1892
- State rank
- #16 of 73 in FL
Livability — Marco Island
- Score
- 71/100
- State rank
- #404
- US rank
- #7149
Category grades
Schools grade is shown separately in the Schools card above.
Census & demographics
- Census place
- Marco Island, FL
- County
- Collier County · 396,295 people
- City population
- 16,205
- Metro
- Naples-Marco Island, FL
- Population (ZIP)
- 16,205
- Household income
- $101,523
- Rent vs Own
- Severe rent burden
- 314.0
Population outlook (Collier County) Hauer SSP2
- Today (2025)
- 420,858 people
- By 2030
- 450,054 · +6.9%
- By 2040
- 502,232 · +19.3%
- By 2050
- 544,932 · +29.5%
- By 2075
- 627,203 · +49.0%
- By 2100
- 659,015 · +56.6%
Race, ethnicity, and origin ACS 2023
- Neighborhood character
- Predominantly White (90%)
- Race & ethnicity
- White 90% Hispanic / Latino 7% Two or more races 6%
- Hispanic origin (detail)
- Mexican 1% Puerto Rican 1% Cuban 2%
- Common ancestry
- Romanian 5% Lithuanian 2% Slovak 2%
- Foreign-born
- 9% · Canada
- Languages at home
- 90% English-only · Spanish 5% Other Indo-European 1% German/W. Germanic 1%
Political lean MEDSL · Collier
- 2024 margin
- Solid R (+33.1) · D 33.1% · R 66.2%
- 2008→2024 swing
- -10.6pp toward R · 2008: -22.5pp · 2024: -33.1pp
- All cycles
- 2024: R+33.1 2020: R+24.7 2016: R+26.0 2012: R+30.1 2008: R+22.5
Not yet ingested
- Civics
- —
Market trends
- HPI YoY
- ▼ -374.55%
- Current HPI
- 284.7538
- Rent YoY
- ▲ 6.59%
- Metro
- Naples-Marco Island, FL
- State GDP YoY
- ▲ 3.28%
- F500 in state
- 36
Industry mix (Fortune 500 HQ in FL)
| Industry | F500 HQs | Revenue |
|---|---|---|
| Industrial Technology | 2 | $29B |
|
||
| Insurance | 2 | $17B |
|
||
| Retail | 1 | $60B |
|
||
| Technology Distribution | 1 | $58B |
|
||
| Homebuilding | 1 | $35B |
|
||
| Technology Manufacturing | 1 | $35B |
|
||
Price history
-57.8% since first listed51 events — show timeline
- 2026-04-21 Price Changed $318,900 NAPLESMLS
- 2026-03-06 Price Changed $325,000 NAPLESMLS
- 2026-01-31 Price Changed $335,000 NAPLESMLS
- 2026-01-08 Price Changed $345,000 NAPLESMLS
- 2025-12-05 Listed $354,900 NAPLESMLS
- 2025-11-21 Listing Removed — NAPLESMLS
- 2025-11-12 Relisted — MIML
- 2025-10-23 Listed $359,000 NAPLESMLS
- 2025-10-07 Listed $359,000 MIML
- 2025-09-26 Listing Removed — NAPLESMLS
- 2025-08-18 Price Changed $364,500 NAPLESMLS
- 2025-08-18 Price Changed $364,500 MIML
- 2025-08-03 Relisted — MIML
- 2025-07-04 Contingent — MIML
- 2025-07-03 Price Changed $369,900 NAPLESMLS
- 2025-07-03 Price Changed $369,900 MIML
- 2025-06-13 Price Changed $379,900 NAPLESMLS
- 2025-06-13 Price Changed $379,900 MIML
- 2025-05-02 Price Changed $389,900 NAPLESMLS
- 2025-05-02 Price Changed $389,900 MIML
- 2025-04-03 Price Changed $399,900 NAPLESMLS
- 2025-04-03 Price Changed $399,900 MIML
- 2025-03-16 Relisted — MIML
- 2025-03-16 Listed $415,000 NAPLESMLS
- 2025-02-28 Price Changed $415,000 MIML
- 2025-02-28 Relisted — MIML
- 2025-02-27 Listing Removed — NAPLESMLS
- 2025-02-01 Price Changed $429,000 NAPLESMLS
- 2025-02-01 Price Changed $429,000 MIML
- 2025-01-25 Listed $439,900 NAPLESMLS
- 2024-12-27 Listing Removed — NAPLESMLS
- 2024-12-18 Price Changed $439,900 MIML
- 2024-11-01 Price Changed $450,000 NAPLESMLS
- 2024-11-01 Price Changed $450,000 MIML
- 2024-10-29 Listed $475,000 NAPLESMLS
- 2024-09-27 Listed $475,000 MIML
- 2024-05-16 Listing Removed — NAPLESMLS
- 2024-05-08 Price Changed $355,000 NAPLESMLS
- 2024-05-08 Price Changed $355,000 MIML
- 2024-04-02 Price Changed $364,900 NAPLESMLS
- 2024-04-02 Price Changed $364,900 MIML
- 2024-02-29 Price Changed $375,000 NAPLESMLS
- 2024-02-29 Price Changed $375,000 MIML
- 2024-02-07 Price Changed $384,900 NAPLESMLS
- 2024-02-07 Price Changed $384,900 MIML
- 2024-01-14 Listed $394,900 NAPLESMLS
- 2024-01-12 Listed $394,900 MIML
- 2000-12-08 Sold (Public Records) $125,000 Public Records
- 1998-01-09 Sold (Public Records) $190,000 Public Records
- 1997-12-31 Sold (Public Records) $82,000 Public Records
- 1994-08-19 Sold (Public Records) $755,000 Public Records
Property tax history
+17.6%/yrLatest (2025): $2,683 · -3.5% YoY. Source: county tax records.
Cash-flow waterfall
monthlySold comps — $/sqft
last 12 mo · ≤1 miLoading sold comps…