 🏷️ Likely Rental
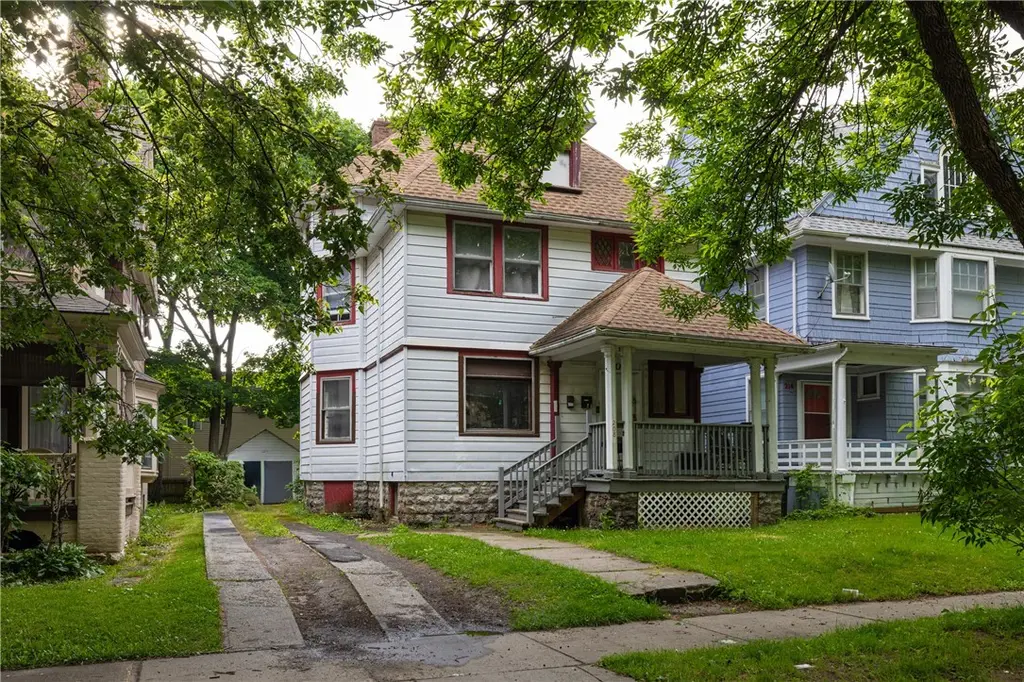
208 Kenwood Ave · Rochester, NY
Flood risk 1/10 · Minimal
- FEMA flood zone
- X (unshaded)
- Chance of flooding over 30 yrs
- 0.0%
- Est. flood insurance / yr
- $473 – $860
Fire risk 1/10 · Minimal
- Est. fire insurance / yr
- $691 – $1,283
Heat risk 2/10 · Minimal
- Hot days now (above 96°F)
- 7 days/yr
- Hot days in 30 yrs
- 15 days/yr
Wind risk 1/10 · Minimal
- Chance of severe wind over 30 yrs
- —
Air-quality risk 2/10 · Minimal
- Unhealthy air days now
- 1 days/yr
- Unhealthy air days in 30 yrs
- 1 days/yr
Risk factors via First Street. Map © Google.
Why this score? — see what drove the A- grade
The composite is a weighted blend of 9 inputs, each scored 0–100. Each bar is that input's sub-score; the figure is the points it added to the 100-point composite (weight × sub-score).
- Cash flow +30.0/30.0
- ARV discount +15.0/15.0
- 1% rule +10.0/10.0
- DSCR +10.0/10.0
- Rent growth +4.1/5.0
- Livability +3.8/5.0
- Appreciation +3.5/10.0
- Condition / age +2.5/5.0
- Schools +1.9/10.0
$119,900
🖨 Deal sheet (PDF) 📄 Offer letter ✓ Due diligence
Multi-family units
County records classify this as Multi-Family (2-4 Unit). Listing-text estimate: 2 units. confirmed
Listing remarks
Excellent investment or owner-occupant opportunity in Rochester's desirable 19th Ward! This duplex features one vacant unit ready for immediate occupancy and one tenant-occupied unit providing instant rental income. Whether you're looking to house hack, add to your investment portfolio, or offset your mortgage with rental revenue, this property offers flexibility and strong potential. Conveniently located near the University of Rochester, Strong Hospital, parks, shopping, and major expressways. Don't miss your chance to own a versatile income-producing property in a well-established neighborhood. Delayed negotiations to be on 6/18/2026 at noon.
Key facts
- Tenant occupied unit
- Rental income
- Conveniently located
Tags
Property features AI
Finance
- Financial info: Owner pays water and trash collection (rent includes water and trash collection); Operating expenses include water/sewer (multi-family)
Exterior
- Parking: One-car garage; Paved parking
- Utilities: Public water connected; Sewer connected
- Home design: Two-story building; Residential 2-unit zoning; Resale property
- Construction: Aluminum siding; Asphalt roof
- Exterior features: Near public transit; Rectangular residential lot; City street frontage
Interior
- Kitchen: No kitchen appliance details provided
- Bedrooms: Two-unit property (unit count noted; individual bedroom details not provided)
- Flooring: Hardwood; Vinyl; Varies by area
- Bathrooms: Two full bathrooms (total for the property)
- Heating & cooling: Gas forced-air heating
- Interior features: Full basement; Hardwood and vinyl flooring; varied flooring throughout; Gas water heater
- Laundry & utility: Separate gas meters and separate electric meters for each unit (2 each)
Neighborhood map
What this means for you Summary
Snapshot
- This is a 2 × 3-bed/2.0-bath units multifamily listed at $120k.
Deal economics
- At list price, monthly cash flow is $2k ($21k/yr) — positive. Per door: $878/mo.
- The deal already cash-flows at list — no discount required.
- Meets the 1% rule at list price ($3k rent vs $120k).
- Cap rate 23.9% vs local median 9.3% in Rochester — top-decile yield for the area; either an underpriced asset or a hidden risk that comps aren't pricing in. Stress-test before assuming the spread holds.
Location & tenants
- Location reads 76/100 on livability (#222 in NY, #3,482 nationally) — a middle-class / working-renter tenant base. Strengths: commute A+, cost of living A+, housing A+; Watch: crime F, employment F.
- Rochester City School District (urban): math 21% / reading 26% proficiency, ranked #589 of 590 in NY (top 100%) — low school quality limits family demand, transient renter base, plan for 1-2y turnover; 82% free/reduced lunch — lower-income household profile, screen leases tightly.
- Zoned schools: Joseph C Wilson Foundation Academy (math 8% / reading 17%, grade F, #2,049 of 2,108 statewide, top 98%, 404 students, 91% FRL); East Lower School (math 2% / reading 22%, grade F, #715 of 729 statewide, top 98%, 304 students, 86% FRL); Edison Career And Technology High School (math 44% / reading 50%, grade D-, #1,007 of 1,100 statewide, top 93%, 1,233 students, 91% FRL).
- Market conditions: Rents rising fast (+6.4%/yr); 78 active listings in the ZIP; lower-income renter base — watch delinquency; 1,169 units permitted in Monroe County in 2024 (591 in 5+ unit buildings).
- At $3,241/mo this rent would consume 124% of the median local household income ($31k/yr) (locally 2168% of renters already pay >50% of income on rent) — very limited rent-growth headroom before tenants either downsize or default.
Forward outlook
- Local home prices are declining (-2.9%/yr); year-one equity from $829 of loan paydown is wiped out by about $4k of value loss. Plan a longer hold.
- Monroe County population projected to shrink 6% by 2050 — rents likely to lag national; underwrite the cash flow, not the appreciation.
- At projected returns (-2.9% appreciation + 6.4% rent growth), your $34k cash investment doubles in ~2 years — after that, you're playing with house money.
Negotiation context
- Only 11 days on market — expect competitive offers; lowballing is unlikely to land.
- 6 sale attempts since 9y ago with the ask held roughly flat each time — persistent listings suggest the price (not the market) is what's stuck; bring a comps-based counter.
Risks & watch-outs
- Watch-outs: built in 1923 — expect roof / HVAC / electrical / plumbing capex.
Questions for the listing agent
- Can we see the unit-by-unit rent roll, current vacancy, and any below-market leases? What's the average tenancy length?
- What capital expenditures (roof, boiler, parking lot, exteriors) have been made in the last 5 years, and what's planned in the next 2?
- Built in 1923 — when were the roof, HVAC, electrical panel, plumbing, and water heater last replaced?
- Is there a deadline driving the sale (1031 exchange, divorce, estate, relocation)? That informs how much negotiation room exists.
- Schools are D-rated, which usually means shorter tenancies and higher turnover. Who's the typical renter profile here, and what's been the actual vacancy rate?
- Crime grade is F in this area — have there been break-ins, vandalism, or insurance claims at this property in the last 3 years? What carrier currently insures it and at what premium?
- What's the average days-on-market for RENTAL listings here right now (not sales)? A rising rental-DOM trend means longer vacancies and softer asking-rent achievability than the comps imply.
- What's the recent tenant-quality profile in this submarket — average credit score on applications, eviction rate, late-payment / NSF rate, and stable-employment percentage? A property-management company in the area should have these aggregated.
- How much new apartment / multifamily construction is in the pipeline within 1–3 miles? Heavy new supply (>2% of stock underway) typically softens rents 12–24 months out; light construction supports rent growth.
Investment metrics
- 1% rule
- 2.70% ✓
- Cap rate
- 23.87%
- Cash-on-cash
- 62.79%
- DSCR
- 3.79
- GRM
- 3.1
CMA / ARV
- ARV (on-the-fly)
- $193,936
- Comps found
- 4
Show comp detail 4 sales within ~0.75 mi
| Address | Dist | Beds/Ba | Sqft | Sold | Price | $/sf | Match |
|---|---|---|---|---|---|---|---|
| 231 Kenwood Ave | 0.04mi | 4/2.0 (+1) | 2,439 (-14%) | 14mo | $92,000 | $38 | 57 |
| 694-696 Genesee St | 0.61mi | 4/2.0 (+1) | 2,848 (-0%) | 21mo | $135,000 | $47 | 49 |
| 165 Thurston Rd | 0.65mi | 4/4.0 (+1) | 2,836 (-1%) | 21mo | $265,000 | $93 | 38 |
| 54 Turner St | 0.73mi | 4/2.0 (+1) | 2,472 (-13%) | 6mo | $167,500 | $68 | 34 |
Match score weights: distance 35% · size 25% · config 20% · recency 20%. Top-matched comps best support the ARV.
Projected returns pro-forma
-2.93% appreciation · 6.37% rent growth · sell at horizon
- IRR
- 65.6%
- Equity multiple
- 4.10×
- Total profit
- $104,191
- Equity at exit
- $18,244
- IRR
- 70.9%
- Equity multiple
- 9.49×
- Total profit
- $285,187
- Equity at exit
- $10,998
Cash invested: $33,572 (down + closing). Projections, not guarantees.
Landlord ↔ Tenant lean methodology
- Overall (STATE)
- 15 Strongly Tenant-Friendly
- State New York
- 15 Strongly Tenant-Friendly · D+10
- County
- — inherits STATE
- City
- — inherits STATE
ZIP-level market 14611
- Home prices YoY
- -1.1%
- Rents YoY
- 6.4%
- Active inventory
- 78
- Price-to-rent
- 6.2×
Monthly cashflow live
- Estimated rent
- $3,241 high interval (Pro) →
- Mortgage (P&I)
- −$629
- Tax from tax record
- −$125 /mo · $1,500/yr
- Insurance
- −$50
- HOA
- −$0
- Vacancy / Maint / Mgmt
- −$681
- Net cashflow
- $1,757
Break-even live
Sensitivity live
| Price | -10% $1,825 | -5% $1,791 | +0% $1,757 | +5% $1,723 | +10% $1,689 |
|---|---|---|---|---|---|
| Rent | -10% $1,501 | -5% $1,629 | +0% $1,757 | +5% $1,885 | +10% $2,013 |
| Rate | -1.0pp $1,817 | -0.5pp $1,787 | base $1,757 | +0.5pp $1,726 | +1.0pp $1,694 |
2-unit breakdown (identical units grouped — click to expand)
| Units | Beds | Baths | Est. rent |
|---|---|---|---|
| 2× units | 3 | 2 | $3,240 |
| #1 | 3 | 2 | $1,620 |
| #2 | 3 | 2 | $1,620 |
| Total (2 units) | $3,241 | ||
UW: 25.0% down · 7.5% · 30yr · 1.5% tax · 5.0% vac · 8.0% maint · 8.0% mgmt
Financing live
Cash to close
- Down payment
- $29,975
- Closing costs
- $3,597
- Reserves months
- —
- Total cash needed
- —
Loan-product check · same deal, 3 products live
Conventional
25% down · 7.5% · 30yr
- Down + closing
- —
- Monthly P&I
- —
- Monthly cashflow
- —
- DSCR
- —
- Eligible?
- —
Personal DTI + credit; lowest rate.
DSCR
20% down · 8.5% · 30yr
- Down + closing
- —
- Monthly P&I
- —
- Monthly cashflow
- —
- DSCR
- —
- Eligible?
- —
No personal income docs; deal must DSCR.
Hard money
10% down · 12.0% · 12mo
- Down + closing
- —
- Monthly P&I
- —
- Monthly cashflow
- —
- DSCR
- —
- Eligible?
- —
Short-term bridge; refi at stabilization.
Listing history 8 events
-
2026-06-21days on market $119,900 Active 11 DOM
-
2026-06-18days on market $119,900 Active 8 DOM
-
2026-06-17days on market $119,900 Active 7 DOM
-
2026-06-16days on market $119,900 Active 6 DOM
-
2026-06-15days on market $119,900 Active 5 DOM
-
2026-06-13days on market $119,900 Active 3 DOM
-
2026-06-13remarks 652-char remark
-
2026-06-13$119,900 Active 2 DOM
ⓘ Source: listings_history table (triggers on properties + properties_extension) + one-shot
backfill from property_details.listing_events for pre-trigger history.
Tax reassessment forecast NY · Partial reset (capped growth)
- Current annual tax
- $1,500 · $125/mo
- Projected year-2 tax
- $1,763 · $147/mo
- Expected delta
- +$263/yr (+$22/mo · 17.5%)
ⓘ Screening estimate from a state-policy table — verify with the county assessor before closing.
Climate risk First Street
- Flood 1/10 Low FEMA zone X (unshaded) · 0% chance over 30 yrs
- Wildfire 1/10 Low
- Heat 2/10 Low 7 d/yr ≥96°F today · 15 d/yr by 30 yrs out
- Wind 1/10 Low
- Air quality 2/10 Low 1 unhealthy d/yr today · 1 by 30 yrs out
Nearby sold comps map
Loading sold comps map…
Walkable amenities ~0.75 mi
Loading nearby amenities…
Taxation est. · year 1
- Rental income
- $38,892
- − Mortgage interest
- −$6,716
- − Property taxes
- −$1,500
- − Insurance
- −$600
- − Repairs & maintenance
- −$3,111
- − Management
- −$3,111
- − Depreciation
- −$3,488
- Taxable income
- $20,365
- Est. tax owed @ 24.0%
- −$4,888
- After-tax cash flow
- $16,192/yr
For passive investors: Depreciation is non-cash, so a rental often shows a tax loss while cash-flowing — sheltering income. Rental losses are passive: they offset passive income freely, and up to $25,000/yr can offset ordinary (W-2) income if you actively participate and your MAGI is under $100k (phasing out to $0 by $150k); unused losses carry forward. On sale, claimed depreciation is recaptured at up to 25%, and gains may owe capital-gains tax (a 1031 exchange can defer both). Figures are a year-1 estimate at your 24.0% rate — not tax advice; consult a CPA.
Schools (NCES district)
- District
- Rochester City School District
- NCES district ID
- 3624750
- Math proficiency
- 21% ▬ 0.00%
- Reading proficiency
- 26% ▲ 4.00%
- Median HH income
- $30,923
- Composite
- 18.98/100
- National rank
- #8850
- State rank
- #589 of 590 in NY
Livability — Rochester
- Score
- 76/100
- State rank
- #222
- US rank
- #3482
Category grades
Schools grade is shown separately in the Schools card above.
Census & demographics
- Census place
- Rochester, NY
- County
- Monroe County · 674,131 people
- City population
- 432,803
- Metro
- Rochester, NY
- Population (ZIP)
- 17,145
- Household income
- $31,376
- Rent vs Own
- Severe rent burden
- 2168.0
Population outlook (Monroe County) Hauer SSP2
- Today (2025)
- 759,460 people
- By 2030
- 757,154 · -0.3%
- By 2040
- 740,644 · -2.5%
- By 2050
- 714,443 · -5.9%
- By 2075
- 645,883 · -15.0%
- By 2100
- 547,084 · -28.0%
Race, ethnicity, and origin ACS 2023
- Neighborhood character
- Diverse neighborhood (Simpson 0.61)
- Race & ethnicity
- Black 55% White 22% Hispanic / Latino 18% Two or more races 13% Asian 1%
- Hispanic origin (detail)
- Puerto Rican 14% Dominican 2%
- Common ancestry
- Romanian 1% Lithuanian 1% Slovak 1%
- Foreign-born
- 3% · Canada
- Languages at home
- 85% English-only · Spanish 12% French/Haitian/Cajun 1% Other Indo-European 1%
Political lean MEDSL · Monroe
- 2024 margin
- D (+19.1) · D 59.5% · R 40.5%
- 2008→2024 swing
- +1.4pp toward D · 2008: 17.7pp · 2024: 19.1pp
- All cycles
- 2024: D+19.1 2020: D+21.0 2016: D+14.1 2012: D+17.4 2008: D+17.7
Not yet ingested
- Civics
- —
Market trends
- HPI YoY
- ▼ -2.93%
- Current HPI
- 262.1549
- Rent YoY
- ▲ 6.37%
- Metro
- Rochester, NY
- State GDP YoY
- ▲ 2.60%
- F500 in state
- 92
Industry mix (Fortune 500 HQ in NY)
| Industry | F500 HQs | Revenue |
|---|---|---|
| Financial Services | 10 | $950B |
|
||
| Consumer Goods | 9 | $162B |
|
||
| Insurance | 4 | $225B |
|
||
| Telecommunications | 2 | $144B |
|
||
| Pharmaceuticals | 2 | $112B |
|
||
| Media / Entertainment | 2 | $69B |
|
||
Price history
+122.0% since first listed20 events — show timeline
- 2026-06-11 Listed $119,900 UNYREIS
- 2026-04-30 Listing Removed — UNYREIS
- 2026-04-29 Price Changed $119,995 UNYREIS
- 2026-02-27 Listed $129,995 UNYREIS
- 2025-12-17 Listing Removed — UNYREIS
- 2025-12-12 Listing Removed — UNYREIS
- 2025-12-11 Listing Removed — UNYREIS
- 2025-12-10 Listing Removed — UNYREIS
- 2025-10-21 Listed $159,995 UNYREIS
- 2024-05-07 Sold (Public Records) $112,000 Public Records
- 2024-05-07 Sold (MLS) $112,000 UNYREIS
- 2024-03-05 Pending — UNYREIS
- 2024-02-17 Price Changed $124,777 UNYREIS
- 2024-01-27 Price Changed $134,777 UNYREIS
- 2024-01-10 Listed $138,777 UNYREIS
- 2018-07-11 Sold (Public Records) $135,000 Public Records
- 2018-04-26 Relisted — UNYREIS
- 2018-04-01 Listing Removed — UNYREIS
- 2018-03-22 Pending — UNYREIS
- 2017-11-01 Listed $54,000 UNYREIS
Property tax history
+1.0%/yrLatest (2025): $1,500 · -4.8% YoY. Source: county tax records.
Cash-flow waterfall
monthlySold comps — $/sqft
last 12 mo · ≤1 miLoading sold comps…