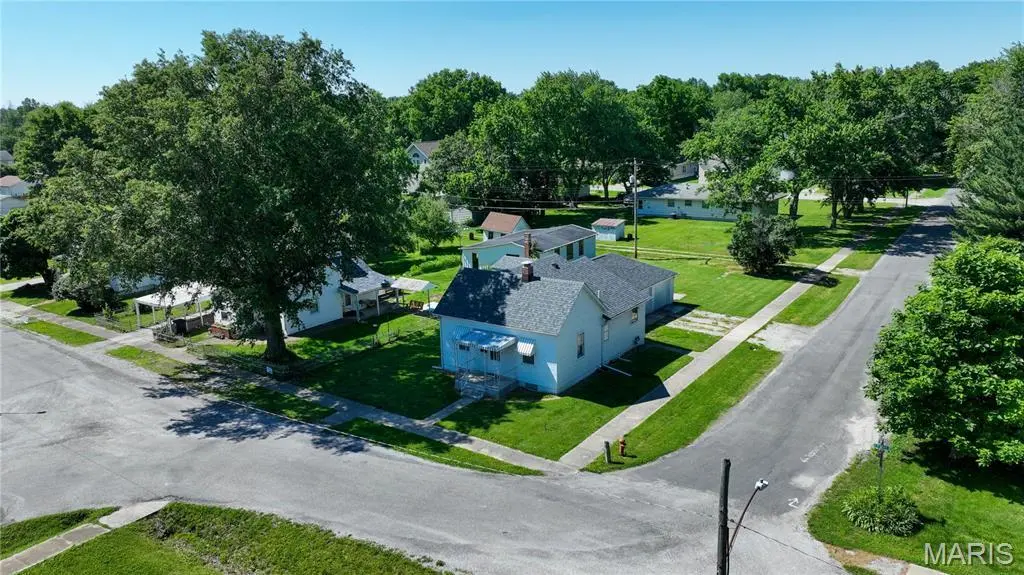
311 E 1st North St · Mount Olive, IL
Flood risk 6/10 · Moderate
- FEMA flood zone
- —
- Chance of flooding over 30 yrs
- 0.74%
- Est. flood insurance / yr
- —
Fire risk 1/10 · Minimal
- Est. fire insurance / yr
- $804 – $1,492
Heat risk 4/10 · Minor
- Hot days now (above 105°F)
- 7 days/yr
- Hot days in 30 yrs
- 20 days/yr
Wind risk 2/10 · Minimal
- Chance of severe wind over 30 yrs
- 1.0%
Air-quality risk 2/10 · Minimal
- Unhealthy air days now
- 1 days/yr
- Unhealthy air days in 30 yrs
- 1 days/yr
Risk factors via First Street. Map © Google.
Why this score? — see what drove the C- grade
The composite is a weighted blend of 9 inputs, each scored 0–100. Each bar is that input's sub-score; the figure is the points it added to the 100-point composite (weight × sub-score).
- Cash flow +16.9/30.0
- Appreciation +10.0/10.0
- ARV discount +7.5/15.0
- DSCR +5.2/10.0
- 1% rule +4.4/10.0
- Livability +3.1/5.0
- Rent growth +2.5/5.0
- Condition / age +2.5/5.0
- Schools +1.5/10.0
$110,000
🖨 Deal sheet 📄 Offer letter ✓ Due diligence
Listing remarks
Welcome home to this well-maintained 3-bedroom, 1-bath property situated on a large corner lot! This home offers plenty of space both inside and out, featuring a full, clean, and highly usable basement complete with 1 yr old washer and dryer. The oversized 2-car garage provides excellent storage and workspace, while the spacious breezeway creates a convenient and attractive connection between the garage and home. Numerous recent updates make this home move-in ready, including a new bathroom in 2025 with all-new plumbing, new flooring throughout the main level, and new garage doors and openers installed in 2025. The roof was replaced in 2020, and the A/C unit is approximately 2 years old. Wi
Key facts
- 8,119 sq ft lot
- 2 garage spots
- Built 1940
Property features AI
Finance
- Financial info: Lease not considered
Exterior
- Parking: Attached garage; 2-car garage (approx. 22x22)
- Utilities: Public water; Public sewer; Natural gas connected; Electric service (Ameren); Water connected; Sewer connected
- Home design: Single-family residence; One and one-half levels; Residential property
- Construction: Architectural shingle roof; Construction: Other; Full basement (poured)
- Exterior features: Back yard; Corner lot; Porch
Interior
- Kitchen: Free-standing gas range
- Bedrooms: 3 bedrooms total; 2 bedrooms on the main level; 1 bedroom on the upper level
- Bathrooms: 1 full bathroom (main level)
- Heating & cooling: Hot water heating; Central air conditioning
- Interior features: Dryer; Washer; Gas water heater; Free-standing gas range; Hot water heat; Central air; Basement (full, poured, 8+ ft.); Porch
- Laundry & utility: Laundry located in basement; Dryer; Washer
Neighborhood map
What this means for you Summary
Snapshot
- This is a 3-bed/1.0-bath single-family listed at $110k.
Deal economics
- At list price, monthly cash flow is $72 ($861/yr) — positive.
- The deal already cash-flows at list — no discount required.
- To meet the 1% rule (rent ≥ 1% of price), the offer needs to be $103k (6.0% below list).
- Recommended offer: $103k (6.0% below list) — sets the bar for 1% rule.
Location & tenants
- Location reads 61/100 on livability (#937 in IL) — a middle-class / working-renter tenant base. Strengths: cost of living A+, housing A+, crime A; Watch: employment D+, amenities F, commute F.
- Mount Olive CUSD 5 (rural): math 16% / reading 17% proficiency, ranked #483 of 620 in IL (top 78%) — low school quality limits family demand, transient renter base, plan for 1-2y turnover.
- Zoned schools: Mt Olive High School (math 24% / reading 34%, grade F, #187 of 693 statewide, top 30%, 126 students, 0% FRL) — zoned schools average 0% FRL vs 39% district-wide (39 pts lower); this property's tenant base skews higher-income than the district average.
- Zoned-school proficiency averages 30% at this address vs 16% district-wide (+13 pts) — the actual schools serving this property are materially stronger than the Mount Olive CUSD 5 average implies; a family-tenant draw the district grade alone would hide.
- Market conditions: 20 active listings in the ZIP; 70 units permitted in Macoupin County in 2024 (0 in 5+ unit buildings).
Forward outlook
- In year one you build about $12k of equity ($761 loan paydown + $11k appreciation (10.0% local appreciation)).
- Macoupin County population projected at -27% by 2050 — secular population decline; favor cash flow + early exit over multi-decade hold.
- At projected returns (10.0% appreciation + 3.0% rent growth), your $31k cash investment doubles in ~3 years — after that, you're playing with house money.
- By year 4, paydown + projected appreciation supports a ~$42k cash-out refi (75% LTV) — recoverable capital for the next deal without selling this one.
Negotiation context
- Only 8 days on market — expect competitive offers; lowballing is unlikely to land.
- Current owner paid $35k; list at $110k implies a 214% gain — meaningful room to come down on a strong offer.
Risks & watch-outs
- Watch-outs: built in 1940 — expect roof / HVAC / electrical / plumbing capex.
- Climate carrying-cost: major flood risk — expect insurance premiums to compound above CPI over the hold.
Questions for the listing agent
- Built in 1940 — when were the roof, HVAC, electrical panel, plumbing, and water heater last replaced?
- Is there a deadline driving the sale (1031 exchange, divorce, estate, relocation)? That informs how much negotiation room exists.
- Schools are F-rated, which usually means shorter tenancies and higher turnover. Who's the typical renter profile here, and what's been the actual vacancy rate?
- What's the average days-on-market for RENTAL listings here right now (not sales)? A rising rental-DOM trend means longer vacancies and softer asking-rent achievability than the comps imply.
- What's the recent tenant-quality profile in this submarket — average credit score on applications, eviction rate, late-payment / NSF rate, and stable-employment percentage? A property-management company in the area should have these aggregated.
- How much new for-sale + rental construction is in the pipeline within 1–3 miles? Heavy new supply typically softens prices + rents 12–24 months out; constrained supply supports both.
Investment metrics
- 1% rule
- 0.94% ✗
- Cap rate
- 7.08%
- Cash-on-cash
- 2.80%
- DSCR
- 1.12
- GRM
- 8.9
CMA / ARV
- ARV (on-the-fly)
- $71,862
- Comps found
- 12
Show comp detail 12 sales within ~0.75 mi
| Address | Dist | Beds/Ba | Sqft | Sold | Price | $/sf | Match |
|---|---|---|---|---|---|---|---|
| 509 E 4th North St | 0.23mi | 2/1.0 (-1) | 1,200 (-2%) | 16mo | $20,000 | $17 | 69 |
| 201 S Lake St | 0.46mi | 2/1.5 (-1) | 1,200 (-2%) | 2mo | $134,900 | $112 | 68 |
| 514 Putnam St | 0.38mi | 3/1.0 | 1,339 (+10%) | 6mo | $69,900 | $52 | 60 |
| 201 N Cherry St | 0.34mi | 2/1.0 (-1) | 1,100 (-10%) | 4mo | $69,000 | $63 | 59 |
| 310 W 4th South St | 0.52mi | 4/1.0 (+1) | 1,300 (+7%) | 2mo | $63,000 | $48 | 57 |
| 315 W 3rd S | 0.48mi | 2/1.0 (-1) | 1,254 (+3%) | 13mo | $34,000 | $27 | 57 |
| 705 E 2nd South St | 0.36mi | 3/1.5 | 1,400 (+15%) | 1mo | $189,000 | $135 | 55 |
| 309 W 1st South St | 0.40mi | 3/1.5 | 1,400 (+15%) | 9mo | $94,000 | $67 | 47 |
| 110 Benton St | 0.50mi | 3/1.0 | 1,100 (-10%) | 19mo | $65,000 | $59 | 45 |
| 304 W 3rd South St | 0.46mi | 2/1.0 (-1) | 1,050 (-14%) | 12mo | $60,000 | $57 | 41 |
| 310 N Maple St | 0.54mi | 2/0.5 (-1) | 1,050 (-14%) | 7mo | $120,000 | $114 | 39 |
| 110 Colfax St | 0.55mi | 2/1.0 (-1) | 1,355 (+11%) | 21mo | $59,900 | $44 | 33 |
Match score weights: distance 35% · size 25% · config 20% · recency 20%. Top-matched comps best support the ARV.
Projected returns pro-forma
10.0% appreciation · 3.0% rent growth · sell at horizon
- IRR
- 26.3%
- Equity multiple
- 3.09×
- Total profit
- $64,485
- Equity at exit
- $99,097
- IRR
- 23.1%
- Equity multiple
- 7.05×
- Total profit
- $186,317
- Equity at exit
- $213,706
Cash invested: $30,800 (down + closing). Projections, not guarantees.
Landlord ↔ Tenant lean methodology
- Overall (STATE)
- 43 Moderately Tenant-Leaning
- State Illinois
- 43 Moderately Tenant-Leaning · D+7
- County
- — inherits STATE
- City
- — inherits STATE
ZIP-level market 62069
- Home prices YoY
- 12.0%
- Active inventory
- 20
- Price-to-rent
- 8.9×
Monthly cashflow live
- Estimated rent
- $1,034 medium interval (Pro) →
- Mortgage (P&I)
- −$577
- Tax from tax record
- −$123 /mo · $1,473/yr
- Insurance
- −$46
- HOA
- −$0
- Vacancy / Maint / Mgmt
- −$217
- Net cashflow
- $72
Break-even live
UW: 25.0% down · 7.5% · 30yr · 1.5% tax · 5.0% vac · 8.0% maint · 8.0% mgmt
Financing live
Cash to close
- Down payment
- $27,500
- Closing costs
- $3,300
- Reserves months
- —
- Total cash needed
- —
Loan-product check · same deal, 3 products live
Conventional
25% down · 7.5% · 30yr
- Down + closing
- —
- Monthly P&I
- —
- Monthly cashflow
- —
- DSCR
- —
- Eligible?
- —
Personal DTI + credit; lowest rate.
DSCR
20% down · 8.5% · 30yr
- Down + closing
- —
- Monthly P&I
- —
- Monthly cashflow
- —
- DSCR
- —
- Eligible?
- —
No personal income docs; deal must DSCR.
Hard money
10% down · 12.0% · 12mo
- Down + closing
- —
- Monthly P&I
- —
- Monthly cashflow
- —
- DSCR
- —
- Eligible?
- —
Short-term bridge; refi at stabilization.
Listing history 8 events
-
2026-06-14status $110,000 Pending 8 DOM
-
2026-06-13days on market $110,000 Active 8 DOM
-
2026-06-12days on market $110,000 Active 7 DOM
-
2026-06-09days on market $110,000 Active 4 DOM
-
2026-06-08days on market $110,000 Active 3 DOM
-
2026-06-07statusdays on market $110,000 Active 2 DOM
-
2026-06-04remarks 699-char remark
-
2026-06-04$110,000 Coming Soon 1 DOM
ⓘ Source: listings_history table (triggers on properties + properties_extension) + one-shot
backfill from property_details.listing_events for pre-trigger history.
Tax reassessment forecast IL · Partial reset (capped growth)
- Current annual tax
- $1,473 · $123/mo
- Projected year-2 tax
- $1,985 · $165/mo
- Expected delta
- +$512/yr (+$43/mo · 34.7%)
ⓘ Screening estimate from a state-policy table — verify with the county assessor before closing.
Climate risk First Street
- Flood 6/10 Major 74% chance over 30 yrs
- Wildfire 1/10 Low
- Heat 4/10 Moderate 7 d/yr ≥105°F today · 20 d/yr by 30 yrs out
- Wind 2/10 Low 100% chance of damaging wind over 30 yrs
- Air quality 2/10 Low 1 unhealthy d/yr today · 1 by 30 yrs out
Nearby sold comps map
Loading sold comps map…
Walkable amenities ~0.75 mi
Loading nearby amenities…
Taxation est. · year 1
- Rental income
- $12,413
- − Mortgage interest
- −$6,162
- − Property taxes
- −$1,473
- − Insurance
- −$550
- − Repairs & maintenance
- −$993
- − Management
- −$993
- − Depreciation
- −$3,200
- Taxable loss
- −$958
- Est. tax savings @ 24.0%
- +$230
- After-tax cash flow
- $1,091/yr
For passive investors: Depreciation is non-cash, so a rental often shows a tax loss while cash-flowing — sheltering income. Rental losses are passive: they offset passive income freely, and up to $25,000/yr can offset ordinary (W-2) income if you actively participate and your MAGI is under $100k (phasing out to $0 by $150k); unused losses carry forward. On sale, claimed depreciation is recaptured at up to 25%, and gains may owe capital-gains tax (a 1031 exchange can defer both). Figures are a year-1 estimate at your 24.0% rate — not tax advice; consult a CPA.
Schools (NCES district)
- District
- Mount Olive CUSD 5
- NCES district ID
- 1727180
- Math proficiency
- 16% ▼ -21.00%
- Reading proficiency
- 17% ▼ -18.00%
- Median HH income
- $46,749
- Composite
- 14.7/100
- National rank
- #9402
- State rank
- #483 of 620 in IL
Livability — Mount Olive
- Score
- 61/100
- State rank
- #937
- US rank
- #18221
Category grades
Schools grade is shown separately in the Schools card above.
Census & demographics
- Census place
- Mount Olive, IL
- Population (ZIP)
- 3,102
Population outlook (Macoupin County) Hauer SSP2
- Today (2025)
- 42,867 people
- By 2030
- 40,796 · -4.8%
- By 2040
- 36,135 · -15.7%
- By 2050
- 31,469 · -26.6%
- By 2075
- 22,102 · -48.4%
- By 2100
- 15,380 · -64.1%
Race, ethnicity, and origin ACS 2023
- Neighborhood character
- Predominantly White (96%)
- Race & ethnicity
- White 96% Two or more races 3%
- Common ancestry
- Lithuanian 2% Iranian 2% Romanian 2%
- Foreign-born
- 1%
Political lean MEDSL · Macoupin
- 2024 margin
- Solid R (+39.2) · D 29.4% · R 68.7% · Other 1.9%
- 2008→2024 swing
- -49.0pp toward R · 2008: 9.8pp · 2024: -39.2pp
- All cycles
- 2024: R+39.2 2020: R+36.5 2016: R+35.0 2012: R+7.0 2008: D+9.8
Not yet ingested
- Civics
- —
Market trends
- HPI YoY
- ▲ 21.34%
- Current HPI
- 199.5
- Rent YoY
- —
- Metro
- —
- State GDP YoY
- ▲ 1.59%
- F500 in state
- 60
Industry mix (Fortune 500 HQ in IL)
| Industry | F500 HQs | Revenue |
|---|---|---|
| Insurance | 4 | $201B |
|
||
| Consumer Goods | 4 | $87B |
|
||
| Industrial Machinery | 3 | $64B |
|
||
| Healthcare | 2 | $55B |
|
||
| Retail / Pharmacy | 1 | $148B |
|
||
| Agriculture / Food | 1 | $86B |
|
||
Price history
+214.3% since first listed2 events — show timeline
- 2026-06-03 Coming Soon $110,000 MARIS as Distributed by MLS Grid
- 2009-10-20 Sold (Public Records) $35,000 Public Records
Property tax history
+7.0%/yrLatest (2024): $1,473 · +4.9% YoY. Source: county tax records.
Cash-flow waterfall
monthlySold comps — $/sqft
last 12 mo · ≤1 miLoading sold comps…