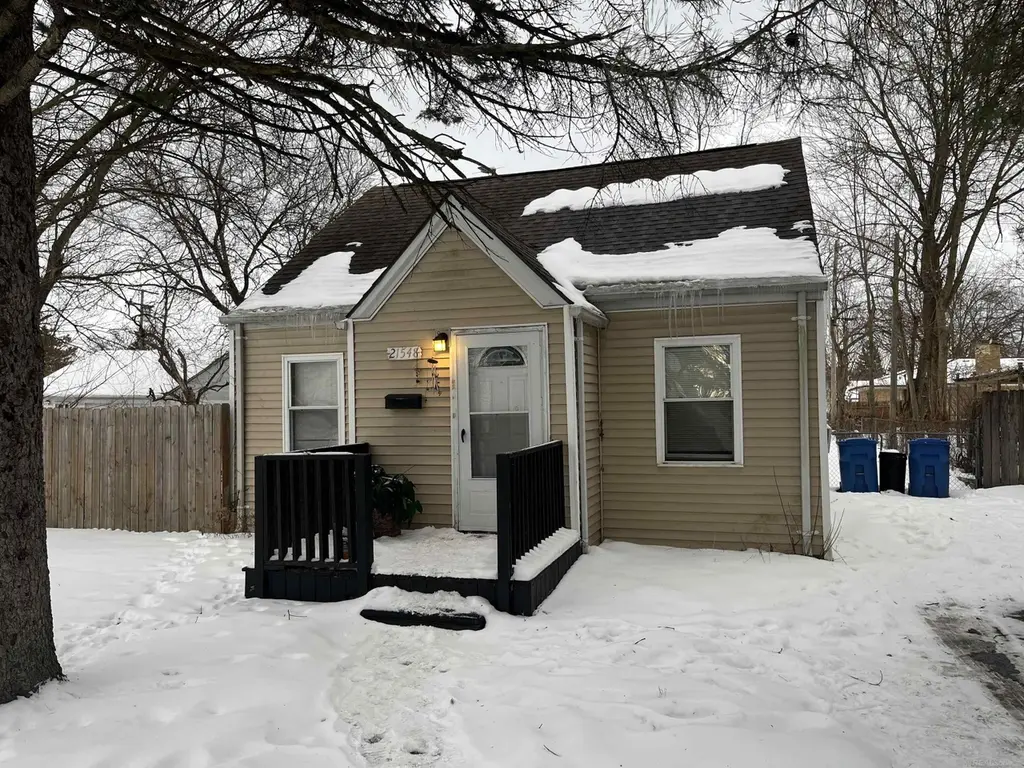
21548 Doepfer Rd · Warren, MI
Flood risk 9/10 · Severe
- FEMA flood zone
- X (unshaded)
- Chance of flooding over 30 yrs
- 0.99%
- Est. flood insurance / yr
- $507 – $1,088
Fire risk 1/10 · Minimal
- Est. fire insurance / yr
- $784 – $1,456
Heat risk 3/10 · Minor
- Hot days now (above 97°F)
- 7 days/yr
- Hot days in 30 yrs
- 15 days/yr
Wind risk 1/10 · Minimal
- Chance of severe wind over 30 yrs
- —
Air-quality risk 3/10 · Minor
- Unhealthy air days now
- 3 days/yr
- Unhealthy air days in 30 yrs
- 5 days/yr
Risk factors via First Street. Map © Google.
Why this score? — see what drove the C+ grade
The composite is a weighted blend of 9 inputs, each scored 0–100. Each bar is that input's sub-score; the figure is the points it added to the 100-point composite (weight × sub-score).
- Cash flow +20.7/30.0
- ARV discount +15.0/15.0
- 1% rule +7.6/10.0
- DSCR +6.6/10.0
- Livability +3.7/5.0
- Rent growth +3.1/5.0
- Condition / age +2.5/5.0
- Schools +1.3/10.0
- Appreciation +0.0/10.0
$115,000
🖨 Deal sheet (PDF) 📄 Offer letter ✓ Due diligence
Listing remarks MLS
This 4-bedroom, 2-bath bungalow is a streamlined addition to any portfolio, offering four bedrooms within a functional 1,217 sq. ft. footprint. The layout features a primary suite with its own private bathroom—a high-value amenity for tenants. Situated on a large, fenced lot, the property is already generating immediate cash flow with established tenants in place, making it a low-friction "turnkey" acquisition with long-term stability and built-in demand. AGENTS PLEASE READ AGENT REMARKS PRIOR TO SCHEDULING A SHOWING.
Key facts
- 0.24 acre lot
- Built 1940
- Listed 28 days
Property features AI
Finance
- Other: Subdivision: S/P # 04 WARREN; Cross streets: Toepfer / Mound
- HOA & community: Homeowners association present
Exterior
- Utilities: Public water; Public sewer
- Home design: Single-family residence; One-and-a-half story
- Construction: Vinyl siding; Slab foundation; Built area above grade: 1,217 (square feet)
- Exterior features: Fenced yard; Public-maintained road access
Interior
- Bedrooms: 4 total rooms
- Bathrooms: 2 full bathrooms
- Heating & cooling: Forced air heating (natural gas); No cooling
- Interior features: Gas water heater; Crawl space basement
Neighborhood map
What this means for you Summary
Snapshot
- This is a 3-bed/1.5-bath single-family listed at $115k.
Deal economics
- At list price, monthly cash flow is $90 ($1k/yr) — positive.
- The deal already cash-flows at list — no discount required.
- Meets the 1% rule at list price ($1k rent vs $115k).
- Recommended offer: $113k (1.5% below list) — sets the bar for market timing.
- Cap rate 7.9% vs local median 5.2% in Warren — top-decile yield for the area; either an underpriced asset or a hidden risk that comps aren't pricing in. Stress-test before assuming the spread holds.
Location & tenants
- Location reads 74/100 on livability (#171 in MI, #4,491 nationally) — a middle-class / working-renter tenant base. Strengths: commute A+, cost of living A+, housing A+; Watch: schools D, amenities D, employment D.
- Fitzgerald Public Schools (urban): math 8% / reading 23% proficiency, ranked #503 of 540 in MI (top 93%) — low school quality limits family demand, transient renter base, plan for 1-2y turnover; 77% free/reduced lunch — lower-income household profile, screen leases tightly.
- Market conditions: Rents rising (+2.4%/yr); 168 active listings in the ZIP; 39 comparable units currently listed for rent nearby; rentals at typical pace (median 23d on market — plan ~3-4 weeks tenant-placement turnaround); 1,321 units permitted in Macomb County in 2024 (86 in 5+ unit buildings).
- This rent runs 32% of the median local income ($54k/yr) — at the standard rent-burdened threshold; future hikes will face affordability resistance.
Forward outlook
- Local home prices are declining (-3.0%/yr); year-one equity from $795 of loan paydown is wiped out by about $3k of value loss. Plan a longer hold.
- Macomb County population projected at +9% by 2050 — modest demand growth; plan on rents tracking national, not racing it.
Negotiation context
- It's been on market 28 days — a 2% lower offer ($113k) is reasonable based on typical stale-listing flexibility.
- 11 sale attempts since 32y ago with the ask held roughly flat each time — persistent listings suggest the price (not the market) is what's stuck; bring a comps-based counter.
- Current owner paid $98k; 17% above their basis — modest negotiation headroom, anchor on the comps not their cost.
Risks & watch-outs
- Watch-outs: property tax is 3.5% of price; flood insurance adds $66/mo; built in 1940 — expect roof / HVAC / electrical / plumbing capex.
- Climate carrying-cost: severe flood risk — expect insurance premiums to compound above CPI over the hold.
Questions for the listing agent
- Built in 1940 — when were the roof, HVAC, electrical panel, plumbing, and water heater last replaced?
- Property tax is high relative to price — has the assessment been appealed recently, and will the sale trigger a re-assessment?
- What's the actual annual flood-insurance premium (NFIP or private), and is the property in a SFHA with mandatory coverage?
- Is there a deadline driving the sale (1031 exchange, divorce, estate, relocation)? That informs how much negotiation room exists.
- Schools are D-rated, which usually means shorter tenancies and higher turnover. Who's the typical renter profile here, and what's been the actual vacancy rate?
- Crime grade is D in this area — have there been break-ins, vandalism, or insurance claims at this property in the last 3 years? What carrier currently insures it and at what premium?
- What's the average days-on-market for RENTAL listings here right now (not sales)? A rising rental-DOM trend means longer vacancies and softer asking-rent achievability than the comps imply.
- What's the recent tenant-quality profile in this submarket — average credit score on applications, eviction rate, late-payment / NSF rate, and stable-employment percentage? A property-management company in the area should have these aggregated.
- How much new for-sale + rental construction is in the pipeline within 1–3 miles? Heavy new supply typically softens prices + rents 12–24 months out; constrained supply supports both.
Investment metrics
- 1% rule
- 1.26% ✓
- Cap rate
- 7.92%
- Cash-on-cash
- 5.83%
- DSCR
- 1.26
- GRM
- 6.6
CMA / ARV
- ARV (median comp)
- $158,510
- List price
- $115,000
- Delta
- -27.45%
- Verdict
- UNDERPRICED
- Comps
- 20 within 1.0 mi
Show comp detail 12 sales within ~0.75 mi
| Address | Dist | Beds/Ba | Sqft | Sold | Price | $/sf | Match |
|---|---|---|---|---|---|---|---|
| 21852 Cyman Ave | 0.28mi | 3/2.0 | 1,150 (-6%) | 2mo | $133,000 | $116 | 74 |
| 22546 Ira Blvd | 0.46mi | 3/1.0 | 1,204 (-1%) | 0mo | $168,000 | $140 | 74 |
| 20817 Atlantic Ave | 0.34mi | 3/1.0 | 1,284 (+6%) | 0mo | $105,000 | $82 | 73 |
| 22373 Cyman Ave | 0.42mi | 3/2.0 | 1,192 (-2%) | 3mo | $215,000 | $180 | 73 |
| 21067 Albany Ave | 0.49mi | 3/1.5 | 1,260 (+4%) | 4mo | $159,900 | $127 | 68 |
| 21603 Sunset Ave | 0.39mi | 3/1.0 | 1,105 (-9%) | 7mo | $170,000 | $154 | 58 |
| 20225 Moenart St | 0.67mi | 3/1.5 | 1,300 (+7%) | 0mo | $105,000 | $81 | 57 |
| 21485 Blackmar Ave | 0.33mi | 2/1.0 (-1) | 1,329 (+9%) | 8mo | $100,000 | $75 | 56 |
| 20811 Sunset Ave | 0.52mi | 3/1.0 | 1,090 (-10%) | 3mo | $122,000 | $112 | 54 |
| 21029 Blackmar Ave | 0.41mi | 3/1.0 | 1,062 (-13%) | 6mo | $120,000 | $113 | 53 |
| 3754 Wasmund Ave | 0.64mi | 4/1.0 (+1) | 1,271 (+4%) | 5mo | $86,000 | $68 | 51 |
| 3641 Berkshire Ave | 0.72mi | 3/2.0 | 1,284 (+6%) | 6mo | $100,000 | $78 | 50 |
Match score weights: distance 35% · size 25% · config 20% · recency 20%. Top-matched comps best support the ARV.
Projected returns pro-forma
-3.0% appreciation · 2.35% rent growth · sell at horizon
- IRR
- -11.8%
- Equity multiple
- 0.58×
- Total profit
- $-13,666
- Equity at exit
- $17,147
- IRR
- -3.7%
- Equity multiple
- 0.76×
- Total profit
- $-7,598
- Equity at exit
- $9,943
Cash invested: $32,200 (down + closing). Projections, not guarantees.
Landlord ↔ Tenant lean methodology
- Overall (STATE)
- 62 Landlord-Friendly
- State Michigan
- 62 Landlord-Friendly · EVEN
- County
- — inherits STATE
- City
- — inherits STATE
ZIP-level market 48091
- Rents YoY
- 2.4%
- Active inventory
- 168
- Price-to-rent
- 6.6×
Monthly cashflow live
- Estimated rent
- $1,448 high interval (Pro) →
- Mortgage (P&I)
- −$603
- Tax from tax record
- −$336 /mo · $4,037/yr
- Insurance
- −$48
- Flood insurance flood zone
- −$66 /mo · $798/yr
- HOA
- −$0
- Vacancy / Maint / Mgmt
- −$304
- Net cashflow
- $90
Break-even live
Sensitivity live
| Price | -10% $155 | -5% $122 | +0% $90 | +5% $57 | +10% $25 |
|---|---|---|---|---|---|
| Rent | -10% $-24 | -5% $33 | +0% $90 | +5% $147 | +10% $204 |
| Rate | -1.0pp $148 | -0.5pp $119 | base $90 | +0.5pp $60 | +1.0pp $30 |
UW: 25.0% down · 7.5% · 30yr · 1.5% tax · 5.0% vac · 8.0% maint · 8.0% mgmt
Financing live
Cash to close
- Down payment
- $28,750
- Closing costs
- $3,450
- Reserves months
- —
- Total cash needed
- —
Loan-product check · same deal, 3 products live
Conventional
25% down · 7.5% · 30yr
- Down + closing
- —
- Monthly P&I
- —
- Monthly cashflow
- —
- DSCR
- —
- Eligible?
- —
Personal DTI + credit; lowest rate.
DSCR
20% down · 8.5% · 30yr
- Down + closing
- —
- Monthly P&I
- —
- Monthly cashflow
- —
- DSCR
- —
- Eligible?
- —
No personal income docs; deal must DSCR.
Hard money
10% down · 12.0% · 12mo
- Down + closing
- —
- Monthly P&I
- —
- Monthly cashflow
- —
- DSCR
- —
- Eligible?
- —
Short-term bridge; refi at stabilization.
Rent comps 39 comps
| Address | Beds | Baths | Sqft | Rent | $/sqft | DOM | Units | Dist |
|---|---|---|---|---|---|---|---|---|
| 21410 Panama St Warren, MI | 3.0 | 1.0 | 900 | $1,600 | $1.78 | 25d | 1 | 0.33mi |
| 20794 Audrey Ave Warren, MI | 3.0 | 1.0 | 954 | $1,350 | $1.42 | 44d | 1 | 0.34mi |
| 21465 Syracuse Ave Warren, MI | 3.0 | 1.0 | 990 | $1,375 | $1.39 | 44d | 1 | 0.41mi |
| 21456 Syracuse Ave Warren, MI | 3.0 | 1.0 | 1152 | $1,595 | $1.38 | 2d | 1 | 0.44mi |
| 21456 Syracuse Ave Warren, MI | 3.0 | 1.0 | 1160 | $1,595 | $1.38 | 44d | 1 | 0.44mi |
| 22580 Masch Ave Warren, MI | 3.0 | 1.0 | 988 | $1,450 | $1.47 | 25d | 1 | 0.49mi |
| 22622 Panama Ave Warren, MI | 3.0 | 1.5 | 920 | $1,395 | $1.52 | 11d | 1 | 0.56mi |
| 20263 Caldwell St Detroit, MI | 3.0 | 1.0 | 909 | $1,350 | $1.49 | 17d | 1 | 0.70mi |
| 23378 Cunningham Ave Warren, MI | 3.0 | 1.0 | 1140 | $1,500 | $1.32 | 3d | 1 | 0.78mi |
| 20058 Bloom St Detroit, MI | 4.0 | 1.0 | 1350 | $1,450 | $1.07 | 17d | 1 | 0.79mi |
| 3951 Los Angeles Ave Warren, MI | 3.0 | 1.0 | 1258 | $1,500 | $1.19 | 25d | 1 | 0.89mi |
| 19930 Binder St Detroit, MI | 3.0 | 1.0 | 1000 | $1,450 | $1.45 | 17d | 1 | 1.01mi |
| 3840 Bart Ave Warren, MI | 3.0 | 1.0 | 1062 | $1,350 | $1.27 | 25d | 1 | 1.04mi |
| 20000 Norwood St Detroit, MI | 3.0 | 1.5 | 1150 | $1,200 | $1.04 | 25d | 1 | 1.05mi |
| 19450 Fenelon St Detroit, MI | 3.0 | 1.0 | 1062 | $1,384 | $1.30 | 5d | 1 | 1.10mi |
| 21155 Warner Ave Warren, MI | 2.0 | 1.0 | 756 | $1,029 | $1.36 | 25d | 1 | 1.13mi |
| 20255 Harned St Detroit, MI | 3.0 | 1.0 | 1000 | $1,374 | $1.37 | 17d | 1 | 1.17mi |
| 19361 Moenart St Unit 1 Detroit, MI | 2.0 | 1.0 | 1000 | $1,100 | $1.10 | 24d | 1 | 1.20mi |
| 7043 Meadow Ave Warren, MI | 2.0 | 1.0 | 911 | $1,274 | $1.40 | 44d | 1 | 1.22mi |
| 7060 Victory Ave Warren, MI | 3.0 | 1.0 | 945 | $1,450 | $1.53 | 12d | 1 | 1.23mi |
| 19415 Gable St Detroit, MI | 3.0 | 1.0 | 1000 | $1,373 | $1.37 | 25d | 1 | 1.28mi |
| 19450 Norwood St Detroit, MI | 3.0 | 1.0 | 1000 | $1,200 | $1.20 | 5d | 1 | 1.28mi |
| 19694 Gallagher St Detroit, MI | 3.0 | 1.0 | 1000 | $1,150 | $1.15 | 15d | 1 | 1.28mi |
| 19260 Bloom St Detroit, MI | 3.0 | 1.0 | 1100 | $1,350 | $1.23 | 5d | 1 | 1.30mi |
| 7275 Chalmers Ave Warren, MI | 2.0 | 1.0 | 703 | $1,200 | $1.71 | 25d | 1 | 1.33mi |
| 6847 Continental Ave Warren, MI | 4.0 | 1.0 | 1000 | $1,595 | $1.59 | 0d | 1 | 1.33mi |
| 2709 Capitol Ave Warren, MI | 3.0 | 2.0 | 1056 | $1,649 | $1.56 | 44d | 1 | 1.34mi |
| 7511 Toepfer Rd Warren, MI | 3.0 | 1.0 | 1032 | $1,199 | $1.16 | 22d | 1 | 1.35mi |
| 19162 Conley St Detroit, MI | 2.0 | 1.0 | 1000 | $1,300 | $1.30 | 44d | 1 | 1.36mi |
| 19360 Revere St Detroit, MI | 3.0 | 1.0 | 1050 | $1,250 | $1.19 | 25d | 1 | 1.38mi |
| 21516 Dequindre Rd Warren, MI | 1.0–2.0 | 1.0 | 837 | $1,375 | $1.64 | 22d | 1 | 1.40mi |
| 2034 John B Ave Warren, MI | 3.0 | 1.0 | 920 | $1,261 | $1.37 | 44d | 1 | 1.41mi |
| 7568 Hudson Ave Unit 2 Warren, MI | 2.0 | 1.0 | 1415 | $900 | $0.64 | 5d | 1 | 1.42mi |
| 7568 Hudson Ave Unit 1 Warren, MI | 3.0 | 1.0 | 1415 | $1,100 | $0.78 | 5d | 1 | 1.42mi |
| 19995 Goddard St Detroit, MI | 4.0 | 1.0 | 1292 | $1,400 | $1.08 | 22d | 1 | 1.44mi |
| 18891 Moenart St Detroit, MI | 3.0 | 1.0 | 1150 | $1,300 | $1.13 | 2d | 1 | 1.48mi |
| 18891 Moenart St Detroit, MI | 3.0 | 1.0 | 870 | $1,195 | $1.37 | 17d | 1 | 1.48mi |
| 18884 Bloom St Detroit, MI | 3.0 | 1.0 | 979 | $975 | $1.00 | 22d | 1 | 1.50mi |
| 18884 Bloom St Detroit, MI | 3.0 | 1.0 | 979 | $975 | $1.00 | 44d | 1 | 1.50mi |
Listing history 31 events
-
2026-05-01$115,000 Active 539-char remark
Show marketing remark (539 chars)
This 4-bedroom, 2-bath bungalow is a streamlined addition to any portfolio, offering four bedrooms within a functional 1,217 sq. ft. footprint. The layout features a primary suite with its own private bathroom—a high-value amenity for tenants. Situated on a large, fenced lot, the property is already generating immediate cash flow with established tenants in place, making it a low-friction "turnkey" acquisition with long-term stability and built-in demand. AGENTS PLEASE READ AGENT REMARKS PRIOR TO SCHEDULING A SHOWING.
-
2026-05-01$115,000 Active 533-char remark
Show marketing remark (539 chars)
This 4-bedroom, 2-bath bungalow is a streamlined addition to any portfolio, offering four bedrooms within a functional 1,217 sq. ft. footprint. The layout features a primary suite with its own private bathroom—a high-value amenity for tenants. Situated on a large, fenced lot, the property is already generating immediate cash flow with established tenants in place, making it a low-friction "turnkey" acquisition with long-term stability and built-in demand. AGENTS PLEASE READ AGENT REMARKS PRIOR TO SCHEDULING A SHOWING.
-
2026-03-06historical
-
2026-02-07$136,000 Active
-
2026-02-06$136,000 Active
-
2022-03-15soldstatus $98,000
-
2021-01-07soldstatus $100,000
-
2016-10-14soldstatus $243,500
-
2014-05-16soldstatus $850
-
2014-05-07historical
-
2014-04-23$850
-
2013-05-18soldstatus $210,000
-
2013-01-04soldstatus $9,500
-
2012-10-19$8,900
-
2012-10-19historical
-
2012-10-19historical
-
2012-09-21$8,900
-
2012-09-21$8,900
-
2001-11-02soldstatus $58,900
-
1998-07-23soldstatus $58,900
-
1998-07-10historical
-
1998-06-25$58,900
-
1995-12-06soldstatus $52,900
-
1995-11-09soldstatus $52,900
-
1995-03-30soldstatus $34,000
-
1995-03-27historical
-
1995-03-27$52,900
-
1995-03-18soldstatus $34,000
-
1994-09-16$45,000
-
1989-04-17soldstatus $35,000
-
1988-05-11soldstatus $35,000
ⓘ Source: listings_history table (triggers on properties + properties_extension) + one-shot
backfill from property_details.listing_events for pre-trigger history.
Tax reassessment forecast MI · Partial reset (capped growth)
- Current annual tax
- $4,037 · $336/mo
- Projected year-2 tax
- $4,037 · $336/mo
- Expected delta
- $0/yr ($0/mo · 0.0%)
ⓘ Screening estimate from a state-policy table — verify with the county assessor before closing.
Climate risk First Street
- Flood 9/10 Extreme FEMA zone X (unshaded) · 99% chance over 30 yrs
- Wildfire 1/10 Low
- Heat 3/10 Moderate 7 d/yr ≥97°F today · 15 d/yr by 30 yrs out
- Wind 1/10 Low
- Air quality 3/10 Moderate 3 unhealthy d/yr today · 5 by 30 yrs out
Nearby sold comps map
Loading sold comps map…
Walkable amenities ~0.75 mi
Loading nearby amenities…
Taxation est. · year 1
- Rental income
- $17,375
- − Mortgage interest
- −$6,442
- − Property taxes
- −$4,037
- − Insurance
- −$1,372
- − Repairs & maintenance
- −$1,390
- − Management
- −$1,390
- − Depreciation
- −$3,345
- Taxable loss
- −$602
- Est. tax savings @ 24.0%
- +$145
- After-tax cash flow
- $1,224/yr
For passive investors: Depreciation is non-cash, so a rental often shows a tax loss while cash-flowing — sheltering income. Rental losses are passive: they offset passive income freely, and up to $25,000/yr can offset ordinary (W-2) income if you actively participate and your MAGI is under $100k (phasing out to $0 by $150k); unused losses carry forward. On sale, claimed depreciation is recaptured at up to 25%, and gains may owe capital-gains tax (a 1031 exchange can defer both). Figures are a year-1 estimate at your 24.0% rate — not tax advice; consult a CPA.
Schools (NCES district)
- District
- Fitzgerald Public Schools
- NCES district ID
- 2614460
- Math proficiency
- 8% ▼ -8.00%
- Reading proficiency
- 23% ▼ -11.00%
- Median HH income
- $34,828
- Composite
- 12.67/100
- National rank
- #9608
- State rank
- #503 of 540 in MI
Livability — Warren
- Score
- 74/100
- State rank
- #171
- US rank
- #4491
Category grades
Schools grade is shown separately in the Schools card above.
Census & demographics
- Census place
- Warren, MI
- County
- Macomb County · 638,552 people
- City population
- 114,937
- Metro
- Detroit-Warren-Dearborn, MI
- Population (ZIP)
- 30,696
- Household income
- $54,230
- Rent vs Own
- Severe rent burden
- 1296.0
Population outlook (Macomb County) Hauer SSP2
- Today (2025)
- 925,296 people
- By 2030
- 948,226 · +2.5%
- By 2040
- 983,961 · +6.3%
- By 2050
- 1,010,200 · +9.2%
- By 2075
- 1,076,222 · +16.3%
- By 2100
- 1,077,065 · +16.4%
Race, ethnicity, and origin ACS 2023
- Neighborhood character
- Diverse neighborhood (Simpson 0.68)
- Race & ethnicity
- White 47% Black 25% Asian 19% Two or more races 5% Hispanic / Latino 3% Native American 2%
- Common ancestry
- Romanian 7% Lithuanian 2% Slovak 1%
- Foreign-born
- 16% · Canada
- Languages at home
- 77% English-only · Other Indo-European 14% Other Asian/Pacific 3% Russian/Polish/Slavic 2%
Political lean MEDSL · Macomb
- 2024 margin
- R (+13.7) · D 42.2% · R 55.9% · Other 1.9%
- 2008→2024 swing
- -22.3pp toward R · 2008: 8.6pp · 2024: -13.7pp
- All cycles
- 2024: R+13.7 2020: R+8.1 2016: R+11.6 2012: D+4.0 2008: D+8.6
Not yet ingested
- Civics
- —
Market trends
- HPI YoY
- ▼ -199.66%
- Current HPI
- 177.9273
- Rent YoY
- ▲ 2.35%
- Metro
- Detroit-Warren-Dearborn, MI
- State GDP YoY
- ▲ 1.37%
- F500 in state
- 28
Industry mix (Fortune 500 HQ in MI)
| Industry | F500 HQs | Revenue |
|---|---|---|
| Automotive Parts | 3 | $48B |
|
||
| Automotive | 2 | $372B |
|
||
| Chemicals | 1 | $45B |
|
||
| Automotive Retail | 1 | $29B |
|
||
| Healthcare / Medical Devices | 1 | $23B |
|
||
| Automotive Technology | 1 | $20B |
|
||
Price history
+228.6% since first listed33 events — show timeline
- 2026-05-29 Pending — REALCOMP
- 2026-05-29 Pending — MiRealSource-MiMLS
- 2026-05-01 Listed $115,000 MiRealSource-MiMLS
- 2026-05-01 Listed $115,000 REALCOMP
- 2026-03-06 Listing Removed — MiRealSource-MiMLS
- 2026-02-07 Listed $136,000 REALCOMP
- 2026-02-06 Listed $136,000 MiRealSource-MiMLS
- 2022-03-15 Sold (Public Records) $98,000 Public Records
- 2021-01-07 Sold (Public Records) $100,000 Public Records
- 2016-10-14 Sold (Public Records) $243,500 Public Records
- 2014-05-16 Sold (MLS) $850 MiRealSource-MiMLS
- 2014-05-07 Listing Removed — MiRealSource-MiMLS
- 2014-04-23 Listed $850 MiRealSource-MiMLS
- 2013-05-18 Sold (Public Records) $210,000 Public Records
- 2013-01-04 Sold (MLS) $9,500 REALCOMP
- 2012-10-19 Listing Removed — REALCOMP
- 2012-10-19 Listing Removed — MiRealSource-MiMLS
- 2012-10-19 Listed $8,900 REALCOMP
- 2012-09-21 Listed $8,900 REALCOMP
- 2012-09-21 Listed $8,900 MiRealSource-MiMLS
- 2001-11-02 Sold (Public Records) $58,900 Public Records
- 1998-07-23 Sold (MLS) $58,900 MiRealSource-MiMLS
- 1998-07-10 Listing Removed — MiRealSource-MiMLS
- 1998-06-25 Listed $58,900 MiRealSource-MiMLS
- 1995-12-06 Sold (Public Records) $52,900 Public Records
- 1995-11-09 Sold (MLS) $52,900 MiRealSource-MiMLS
- 1995-03-30 Sold (Public Records) $34,000 Public Records
- 1995-03-27 Listed $52,900 MiRealSource-MiMLS
- 1995-03-27 Listing Removed — MiRealSource-MiMLS
- 1995-03-18 Sold (MLS) $34,000 MiRealSource-MiMLS
- 1994-09-16 Listed $45,000 MiRealSource-MiMLS
- 1989-04-17 Sold (Public Records) $35,000 Public Records
- 1988-05-11 Sold (Public Records) $35,000 Public Records
Property tax history
+11.3%/yrLatest (2025): $4,037 · +2.6% YoY. Source: county tax records.
Cash-flow waterfall
monthlySold comps — $/sqft
last 12 mo · ≤1 miLoading sold comps…