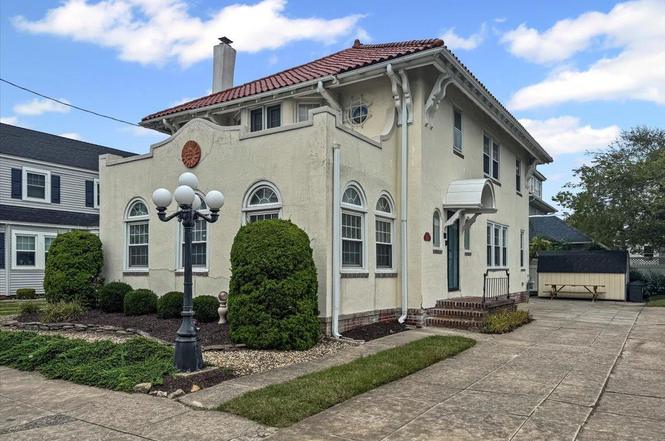
811 E 7th St Ave · Ocean City, NJ
Flood risk 8/10 · Major
- FEMA flood zone
- AE
- Chance of flooding over 30 yrs
- 0.96%
- Est. flood insurance / yr
- $1,737 – $8,500
Fire risk 1/10 · Minimal
- Est. fire insurance / yr
- $526 – $976
Heat risk 8/10 · Major
- Hot days now (above 98°F)
- 7 days/yr
- Hot days in 30 yrs
- 16 days/yr
Wind risk 8/10 · Major
- Chance of severe wind over 30 yrs
- 80.0%
Air-quality risk 2/10 · Minimal
- Unhealthy air days now
- 1 days/yr
- Unhealthy air days in 30 yrs
- 2 days/yr
Risk factors via First Street. Map © Google.
Why this score? — see what drove the D grade
The composite is a weighted blend of 9 inputs, each scored 0–100. Each bar is that input's sub-score; the figure is the points it added to the 100-point composite (weight × sub-score).
- ARV discount +15.0/15.0
- Cash flow +11.1/30.0
- Livability +4.0/5.0
- Schools +3.7/10.0
- DSCR +3.2/10.0
- 1% rule +2.6/10.0
- Rent growth +2.5/5.0
- Condition / age +2.5/5.0
- Appreciation +0.0/10.0
$1,250,000
🖨 Deal sheet 📄 Offer letter ✓ Due diligence
Listing remarks
Beach block: Just a few steps to the boards and beach. A Spanish Revival home from 1925: 5 beds, 3.5 baths with beautiful hardwood floors, good sized rooms, stained glass windows, a nice hearth and solid mechanicals. Tremendous rental potential.
Key facts
- Rental potential
- Beach block
- Hardwood floors
Tags
Property features AI
Exterior
- Parking: Exterior parking for three or more cars; No garage
- Utilities: Public water; Public sewer; Gas water heater
- Home design: For sale
- Construction: Crawl space basement
- Exterior features: Concrete driveway; White exterior color; Lot dimensions 50 x 90; Lot frontage 50; Zoned R1-1-50; Property not waterfront; Property located in floodplain
Interior
- Kitchen: Kitchen on main level
- Bedrooms: Primary bedroom on main level; Additional bedrooms on upper level
- Flooring: Wood floors
- Bathrooms: Three full bathrooms; One half bathroom; Main and upper level bath placement
- Heating & cooling: Central air conditioning; Baseboard heating; Natural gas heating; Hot water heating; Radiator heating
- Interior features: Fireplace in living room; Wood flooring; 14 total rooms; Dining room on main level; Family room on main level; Living room on main level; Powder room on main level; Utility room on main level
- Laundry & utility: Utility room on main level
Neighborhood map
What this means for you Summary
Snapshot
- This is a 5-bed/3.5-bath single-family listed at $1.25M.
Deal economics
- At list price, monthly cash flow is $-937 ($-11k/yr) — negative.
- To cash-flow at today's rent, offer at most $1.08M (13.2% below list).
- To meet the 1% rule (rent ≥ 1% of price), the offer needs to be $952k (23.8% below list).
- Recommended offer: $952k (23.8% below list) — sets the bar for 1% rule.
- Cap rate 5.8% vs local median 3.3% in Ocean City — top-decile yield for the area; either an underpriced asset or a hidden risk that comps aren't pricing in. Stress-test before assuming the spread holds.
Location & tenants
- Location reads 80/100 on livability (#72 in NJ, #1,762 nationally) — a professional / high-income tenant draw. Strengths: amenities A+, employment A+, health & safety A+; Watch: housing D+, cost of living F.
- Ocean City School District (urban): math 31% / reading 53% proficiency, ranked #212 of 472 in NJ (top 45%) — families likely to look elsewhere, expect single-tenant / working-renter base with shorter leases.
- Market conditions: 419 active listings in the ZIP; 1 comparable units currently listed for rent nearby; 877 units permitted in Cape May County in 2024 (35 in 5+ unit buildings).
Forward outlook
- Local home prices are declining (-3.0%/yr); year-one equity from $9k of loan paydown is wiped out by about $38k of value loss. Plan a longer hold.
- Cape May County population projected at -24% by 2050 — secular population decline; favor cash flow + early exit over multi-decade hold.
Negotiation context
- It's been on market 236 days — a 12% lower offer ($1.10M) is reasonable based on typical stale-listing flexibility.
- Current owner paid $180k; list at $1.25M implies a 594% gain — meaningful room to come down on a strong offer.
Risks & watch-outs
- Watch-outs: flood insurance adds $427/mo; built in 1925 — expect roof / HVAC / electrical / plumbing capex.
- Climate carrying-cost: in FEMA flood zone AE (mandatory federal flood insurance); severe wind risk, 80% chance of damaging wind over 30y; extreme-heat days projected 7→16/yr by 2055 (HVAC capex compounding) — expect insurance premiums to compound above CPI over the hold.
Questions for the listing agent
- What do current leases actually rent for vs. the listed asking? Can we see a recent rent roll and the last 12 months of T-12 income?
- It's been on market 236 days. Have you received any prior offers? Is the seller open to a 24% concession, seller financing, or rate buy-down credit?
- Built in 1925 — when were the roof, HVAC, electrical panel, plumbing, and water heater last replaced?
- What's the actual annual flood-insurance premium (NFIP or private), and is the property in a SFHA with mandatory coverage?
- Why hasn't it sold? Are there any deal-killer items the seller is aware of (foundation, flood, title, zoning, code violations)?
- Is there a deadline driving the sale (1031 exchange, divorce, estate, relocation)? That informs how much negotiation room exists.
- Schools are A-rated — typically a magnet for longer-tenancy family renters. What's the average tenant stay here, and is there a school-zone premium baked into asking?
- The area grade is low — what's the realistic commute time and amenity access for the typical tenant pool here? Any planned neighborhood developments (good or bad) we should know about?
- What's the average days-on-market for RENTAL listings here right now (not sales)? A rising rental-DOM trend means longer vacancies and softer asking-rent achievability than the comps imply.
- What's the recent tenant-quality profile in this submarket — average credit score on applications, eviction rate, late-payment / NSF rate, and stable-employment percentage? A property-management company in the area should have these aggregated.
- How much new for-sale + rental construction is in the pipeline within 1–3 miles? Heavy new supply typically softens prices + rents 12–24 months out; constrained supply supports both.
Investment metrics
- 1% rule
- 0.76% ✗
- Cap rate
- 5.80%
- Cash-on-cash
- -1.75%
- DSCR
- 0.92
- GRM
- 10.9
CMA / ARV
- ARV (on-the-fly)
- $1,985,872
- Comps found
- 12
Show comp detail 12 sales within ~0.75 mi
| Address | Dist | Beds/Ba | Sqft | Sold | Price | $/sf | Match |
|---|---|---|---|---|---|---|---|
| 841 Pelham Pl | 0.07mi | 5/5.0 | 2,100 (-12%) | 1mo | $1,999,999 | $952 | 70 |
| 417 Ocean Ave | 0.28mi | 5/2.5 | 2,150 (-10%) | 4mo | $1,880,000 | $874 | 64 |
| 621 Bay Ave | 0.52mi | 5/4.5 | 2,250 (-6%) | 9mo | $1,875,000 | $833 | 55 |
| 901 St James Pl | 0.69mi | 6/4.5 (+1) | 2,438 (+2%) | 6mo | $2,775,000 | $1,138 | 50 |
| 801 Saint James Pl | 0.67mi | 5/4.5 | 2,600 (+9%) | 1mo | $3,200,000 | $1,231 | 48 |
| 1223 Haven Ave | 0.72mi | 5/4.5 | 2,323 (-3%) | 13mo | $1,575,000 | $678 | 47 |
| 1217 Haven Ave | 0.72mi | 5/4.5 | 2,323 (-3%) | 14mo | $1,597,000 | $687 | 46 |
| 1219 Haven Ave | 0.72mi | 5/4.5 | 2,323 (-3%) | 14mo | $1,597,000 | $687 | 46 |
| 337 West Ave | 0.49mi | 5/3.5 | 2,064 (-13%) | 13mo | $1,549,000 | $750 | 44 |
| 140 Asbury Ave | 0.64mi | 4/3.0 (-1) | 2,197 (-8%) | 12mo | $1,585,000 | $721 | 40 |
| 116 West Ave | 0.70mi | 5/2.5 | 2,100 (-12%) | 15mo | $1,700,000 | $810 | 31 |
| 800 St James Pl | 0.65mi | 6/4.5 (+1) | 2,693 (+13%) | 16mo | $2,650,000 | $984 | 25 |
Match score weights: distance 35% · size 25% · config 20% · recency 20%. Top-matched comps best support the ARV.
Projected returns pro-forma
-3.0% appreciation · 3.0% rent growth · sell at horizon
- IRR
- -21.7%
- Equity multiple
- 0.25×
- Total profit
- $-262,167
- Equity at exit
- $186,379
- IRR
- -15.4%
- Equity multiple
- 0.13×
- Total profit
- $-304,956
- Equity at exit
- $108,077
Cash invested: $350,000 (down + closing). Projections, not guarantees.
Landlord ↔ Tenant lean methodology
- Overall (STATE)
- 21 Tenant-Leaning
- State New Jersey
- 21 Tenant-Leaning · D+6
- County
- — inherits STATE
- City
- — inherits STATE
ZIP-level market 08226
- Active inventory
- 419
- Price-to-rent
- 10.9×
Monthly cashflow live
- Estimated rent
- $9,524 medium interval (Pro) →
- Mortgage (P&I)
- −$6,555
- Tax from tax record
- −$958 /mo · $11,496/yr
- Insurance
- −$521
- Flood insurance flood zone
- −$427 /mo · $5,118/yr
- HOA
- −$0
- Vacancy / Maint / Mgmt
- −$2,000
- Net cashflow
- $-937
Break-even live
UW: 25.0% down · 7.5% · 30yr · 1.5% tax · 5.0% vac · 8.0% maint · 8.0% mgmt
Financing live
Cash to close
- Down payment
- $312,500
- Closing costs
- $37,500
- Reserves months
- —
- Total cash needed
- —
Loan-product check · same deal, 3 products live
Conventional
25% down · 7.5% · 30yr
- Down + closing
- —
- Monthly P&I
- —
- Monthly cashflow
- —
- DSCR
- —
- Eligible?
- —
Personal DTI + credit; lowest rate.
DSCR
20% down · 8.5% · 30yr
- Down + closing
- —
- Monthly P&I
- —
- Monthly cashflow
- —
- DSCR
- —
- Eligible?
- —
No personal income docs; deal must DSCR.
Hard money
10% down · 12.0% · 12mo
- Down + closing
- —
- Monthly P&I
- —
- Monthly cashflow
- —
- DSCR
- —
- Eligible?
- —
Short-term bridge; refi at stabilization.
Rent comps 1 comps
| Address | Beds | Baths | Sqft | Rent | $/sqft | DOM | Units | Dist |
|---|---|---|---|---|---|---|---|---|
| 111 West Ave Unit 1309024P Ocean City, NJ | 4.0 | 3.0 | 1991 | $9,524 | $4.78 | 43d | 1 | 0.70mi |
Listing history 17 events
-
2026-06-18days on market $1,250,000 Under Contract 236 DOM
-
2026-06-17days on market $1,250,000 Under Contract 235 DOM
-
2026-06-16days on market $1,250,000 Under Contract 234 DOM
-
2026-06-15days on market $1,250,000 Under Contract 233 DOM
-
2026-06-13days on market $1,250,000 Under Contract 231 DOM
-
2026-06-12days on market $1,250,000 Under Contract 230 DOM
-
2026-06-09days on market $1,250,000 Under Contract 227 DOM
-
2026-06-08days on market $1,250,000 Under Contract 226 DOM
-
2026-06-07days on market $1,250,000 Under Contract 225 DOM
-
2026-06-07days on market $1,250,000 Under Contract 224 DOM
-
2026-06-04days on market $1,250,000 Under Contract 221 DOM
-
2026-06-02days on market $1,250,000 Under Contract 220 DOM
-
2026-06-01days on market $1,250,000 Under Contract 219 DOM
-
2026-05-31days on market $1,250,000 Under Contract 218 DOM
-
2025-10-25historical Under Contract
-
2025-10-24$1,250,000 Active
-
1994-11-14soldstatus $180,000
ⓘ Source: listings_history table (triggers on properties + properties_extension) + one-shot
backfill from property_details.listing_events for pre-trigger history.
Tax reassessment forecast NJ · Partial reset (capped growth)
- Current annual tax
- $11,496 · $958/mo
- Projected year-2 tax
- $21,310 · $1,776/mo
- Expected delta
- +$9,815/yr (+$818/mo · 85.4%)
ⓘ Screening estimate from a state-policy table — verify with the county assessor before closing.
Climate risk First Street
- Flood 8/10 Severe FEMA zone AE · 96% chance over 30 yrs
- Wildfire 1/10 Low
- Heat 8/10 Severe 7 d/yr ≥98°F today · 16 d/yr by 30 yrs out
- Wind 8/10 Severe 80% chance of damaging wind over 30 yrs
- Air quality 2/10 Low 1 unhealthy d/yr today · 2 by 30 yrs out
Nearby sold comps map
Loading sold comps map…
Walkable amenities ~0.75 mi
Loading nearby amenities…
Taxation est. · year 1
- Rental income
- $114,288
- − Mortgage interest
- −$70,019
- − Property taxes
- −$11,496
- − Insurance
- −$11,368
- − Repairs & maintenance
- −$9,143
- − Management
- −$9,143
- − Depreciation
- −$36,364
- Taxable loss
- −$33,245
- Est. tax savings @ 24.0%
- +$7,979
- After-tax cash flow
- $-3,259/yr
For passive investors: Depreciation is non-cash, so a rental often shows a tax loss while cash-flowing — sheltering income. Rental losses are passive: they offset passive income freely, and up to $25,000/yr can offset ordinary (W-2) income if you actively participate and your MAGI is under $100k (phasing out to $0 by $150k); unused losses carry forward. On sale, claimed depreciation is recaptured at up to 25%, and gains may owe capital-gains tax (a 1031 exchange can defer both). Figures are a year-1 estimate at your 24.0% rate — not tax advice; consult a CPA.
Schools (NCES district)
- District
- Ocean City School District
- NCES district ID
- 3411970
- Math proficiency
- 31% ▼ -12.00%
- Reading proficiency
- 53% ▼ -9.00%
- Median HH income
- $60,444
- Composite
- 37.07/100
- National rank
- #4506
- State rank
- #212 of 472 in NJ
Livability — Ocean City
- Score
- 80/100
- State rank
- #72
- US rank
- #1762
Category grades
Schools grade is shown separately in the Schools card above.
Census & demographics
- Census place
- Ocean City, NJ
- City population
- 11,260
- Population (ZIP)
- 11,260
Population outlook (Cape May County) Hauer SSP2
- Today (2025)
- 88,234 people
- By 2030
- 84,144 · -4.6%
- By 2040
- 75,146 · -14.8%
- By 2050
- 67,389 · -23.6%
- By 2075
- 55,732 · -36.8%
- By 2100
- 44,972 · -49.0%
Race, ethnicity, and origin ACS 2023
- Neighborhood character
- Predominantly White (86%)
- Race & ethnicity
- White 86% Hispanic / Latino 9% Black 2% Two or more races 2%
- Hispanic origin (detail)
- Mexican 7% Puerto Rican 1%
- Common ancestry
- Romanian 6% Slovak 2% Scotch-Irish 1%
- Foreign-born
- 7% · Canada
- Languages at home
- 89% English-only · Spanish 8% Russian/Polish/Slavic 2% Other Indo-European 2%
Political lean MEDSL · Cape May
- 2024 margin
- R (+19.2) · D 39.7% · R 58.9% · Other 1.4%
- 2008→2024 swing
- -10.6pp toward R · 2008: -8.7pp · 2024: -19.2pp
- All cycles
- 2024: R+19.2 2020: R+15.9 2016: R+19.9 2012: R+8.9 2008: R+8.7
Not yet ingested
- Civics
- —
Market trends
- HPI YoY
- ▼ -381.90%
- Current HPI
- 389.3687
- Rent YoY
- —
- Metro
- —
- State GDP YoY
- ▲ 2.05%
- F500 in state
- 34
Industry mix (Fortune 500 HQ in NJ)
| Industry | F500 HQs | Revenue |
|---|---|---|
| Consumer Goods | 3 | $31B |
|
||
| Pharmaceuticals | 2 | $153B |
|
||
| Technology | 2 | $21B |
|
||
| Insurance | 2 | $20B |
|
||
| Healthcare | 2 | $19B |
|
||
| Financial Services | 1 | $70B |
|
||
Price history
+594.4% since first listed3 events — show timeline
- 2025-10-25 Contingent — SJSRMLS
- 2025-10-24 Listed $1,250,000 SJSRMLS
- 1994-11-14 Sold (Public Records) $180,000 Public Records
Property tax history
+6.6%/yrLatest (2025): $11,496 · +3.4% YoY. Source: county tax records.
Cash-flow waterfall
monthlySold comps — $/sqft
last 12 mo · ≤1 miLoading sold comps…