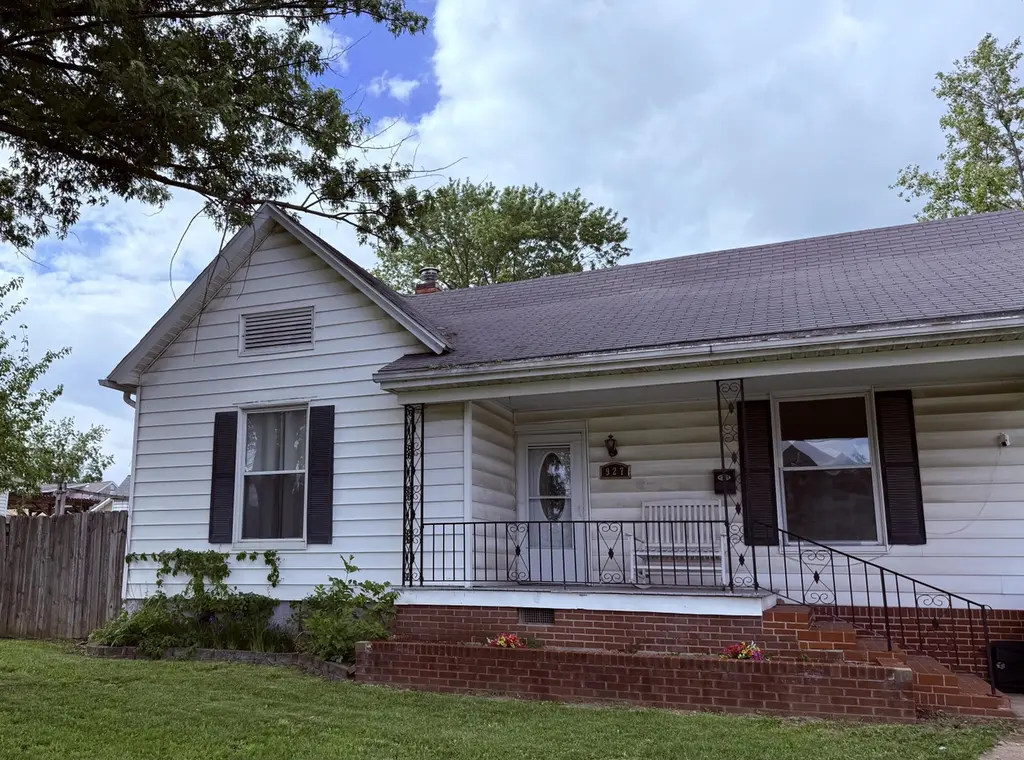
927 E Promenade St · Mexico, MO
Flood risk 1/10 · Minimal
- FEMA flood zone
- X (unshaded)
- Chance of flooding over 30 yrs
- 0.0%
- Est. flood insurance / yr
- $473 – $860
Fire risk 3/10 · Minor
- Est. fire insurance / yr
- $1,054 – $1,958
Heat risk 4/10 · Minor
- Hot days now (above 106°F)
- 7 days/yr
- Hot days in 30 yrs
- 19 days/yr
Wind risk 2/10 · Minimal
- Chance of severe wind over 30 yrs
- —
Air-quality risk 1/10 · Minimal
- Unhealthy air days now
- 0 days/yr
- Unhealthy air days in 30 yrs
- 0 days/yr
Risk factors via First Street. Map © Google.
Why this score? — see what drove the D grade
The composite is a weighted blend of 9 inputs, each scored 0–100. Each bar is that input's sub-score; the figure is the points it added to the 100-point composite (weight × sub-score).
- Cash flow +17.0/30.0
- ARV discount +7.5/15.0
- DSCR +5.3/10.0
- 1% rule +3.4/10.0
- Livability +3.2/5.0
- Schools +2.9/10.0
- Rent growth +2.5/5.0
- Condition / age +2.5/5.0
- Appreciation +0.0/10.0
$119,900
🖨 Deal sheet 📄 Offer letter ✓ Due diligence
Listing remarks
Situated on a large corner lot with a fenced backyard and just minutes from the Missouri Military Academy, this 1910 2 bed, 1 bath home offers space, location, and real potential. The foundation has been evaluated by a structural engineer, and while the roof needs replacement, bids are available, giving you full clarity upfront. With over 1400 sq ft, a basement and a price that reflects updates needed, this is ideal for buyers ready to build equity fast or investors looking for a smart opportunity.
Key facts
- Evaluated foundation
- Fenced backyard
- Corner lot
Tags
Property features AI
Exterior
- Parking: No garage
- Utilities: Public water; Utilities: Other
- Home design: Single-family residence; Residential property type
- Construction: Block foundation
- Exterior features: Covered front porch; Wood privacy fence enclosing back yard (full fenced)
Interior
- Kitchen: Refrigerator; Electric Range; Dishwasher
- Flooring: Carpet; Laminate
- Bathrooms: 1 full bathroom
- Heating & cooling: Central air conditioning; Natural gas forced-air heating
- Interior features: Refrigerator, Electric Range, Dishwasher; Has basement; 6 total rooms
Neighborhood map
What this means for you Summary
Snapshot
- This is a 2-bed/1.0-bath other listed at $120k.
Deal economics
- At list price, monthly cash flow is $81 ($968/yr) — positive.
- The deal already cash-flows at list — no discount required.
- To meet the 1% rule (rent ≥ 1% of price), the offer needs to be $101k (16.2% below list).
- Recommended offer: $101k (16.2% below list) — sets the bar for 1% rule.
- Cap rate 7.1% vs local median 4.5% in Mexico — top-decile yield for the area; either an underpriced asset or a hidden risk that comps aren't pricing in. Stress-test before assuming the spread holds.
Location & tenants
- Location reads 65/100 on livability (#256 in MO) — a middle-class / working-renter tenant base. Strengths: cost of living A+, housing A, health & safety A-; Watch: schools D-, crime F, amenities F.
- Mexico 59 (town): math 31% / reading 38% proficiency, ranked #229 of 324 in MO (top 71%) — families likely to look elsewhere, expect single-tenant / working-renter base with shorter leases.
- Market conditions: 134 active listings in the ZIP; 3 comparable units currently listed for rent nearby; rentals at typical pace (median 21d on market — plan ~3-4 weeks tenant-placement turnaround); 27 units permitted in Audrain County in 2024 (0 in 5+ unit buildings).
Forward outlook
- Local home prices are declining (-3.0%/yr); year-one equity from $829 of loan paydown is wiped out by about $4k of value loss. Plan a longer hold.
- Audrain County population projected at +16% by 2050 — long-run rental-demand tailwind backs the buy-and-hold thesis.
Negotiation context
- It's been on market 26 days — a 2% lower offer ($118k) is reasonable based on typical stale-listing flexibility.
- 3 sale attempts with the ask held roughly flat each time — persistent listings suggest the price (not the market) is what's stuck; bring a comps-based counter.
Risks & watch-outs
- Watch-outs: built in 1910 — expect roof / HVAC / electrical / plumbing capex.
Questions for the listing agent
- Built in 1910 — when were the roof, HVAC, electrical panel, plumbing, and water heater last replaced?
- Is there a deadline driving the sale (1031 exchange, divorce, estate, relocation)? That informs how much negotiation room exists.
- Schools are D-rated, which usually means shorter tenancies and higher turnover. Who's the typical renter profile here, and what's been the actual vacancy rate?
- Crime grade is F in this area — have there been break-ins, vandalism, or insurance claims at this property in the last 3 years? What carrier currently insures it and at what premium?
- The area grade is low — what's the realistic commute time and amenity access for the typical tenant pool here? Any planned neighborhood developments (good or bad) we should know about?
- What's the average days-on-market for RENTAL listings here right now (not sales)? A rising rental-DOM trend means longer vacancies and softer asking-rent achievability than the comps imply.
- What's the recent tenant-quality profile in this submarket — average credit score on applications, eviction rate, late-payment / NSF rate, and stable-employment percentage? A property-management company in the area should have these aggregated.
- How much new for-sale + rental construction is in the pipeline within 1–3 miles? Heavy new supply typically softens prices + rents 12–24 months out; constrained supply supports both.
Investment metrics
- 1% rule
- 0.84% ✗
- Cap rate
- 7.10%
- Cash-on-cash
- 2.88%
- DSCR
- 1.13
- GRM
- 9.9
CMA / ARV
No comps found within radius.
Projected returns pro-forma
-3.0% appreciation · 3.0% rent growth · sell at horizon
- IRR
- -11.8%
- Equity multiple
- 0.57×
- Total profit
- $-14,345
- Equity at exit
- $17,877
- IRR
- -2.7%
- Equity multiple
- 0.82×
- Total profit
- $-6,100
- Equity at exit
- $10,367
Cash invested: $33,572 (down + closing). Projections, not guarantees.
Landlord ↔ Tenant lean methodology
- Overall (STATE)
- 81 Strongly Landlord-Friendly
- State Missouri
- 81 Strongly Landlord-Friendly · R+10
- County
- — inherits STATE
- City
- — inherits STATE
ZIP-level market 65265
- Home prices YoY
- -30.2%
- Active inventory
- 134
- Price-to-rent
- 9.9×
Monthly cashflow live
- Estimated rent
- $1,005 medium interval (Pro) →
- Mortgage (P&I)
- −$629
- Tax from tax record
- −$35 /mo · $414/yr
- Insurance
- −$50
- HOA
- −$0
- Vacancy / Maint / Mgmt
- −$211
- Net cashflow
- $81
Break-even live
UW: 25.0% down · 7.5% · 30yr · 1.5% tax · 5.0% vac · 8.0% maint · 8.0% mgmt
Financing live
Cash to close
- Down payment
- $29,975
- Closing costs
- $3,597
- Reserves months
- —
- Total cash needed
- —
Loan-product check · same deal, 3 products live
Conventional
25% down · 7.5% · 30yr
- Down + closing
- —
- Monthly P&I
- —
- Monthly cashflow
- —
- DSCR
- —
- Eligible?
- —
Personal DTI + credit; lowest rate.
DSCR
20% down · 8.5% · 30yr
- Down + closing
- —
- Monthly P&I
- —
- Monthly cashflow
- —
- DSCR
- —
- Eligible?
- —
No personal income docs; deal must DSCR.
Hard money
10% down · 12.0% · 12mo
- Down + closing
- —
- Monthly P&I
- —
- Monthly cashflow
- —
- DSCR
- —
- Eligible?
- —
Short-term bridge; refi at stabilization.
Rent comps 3 comps
| Address | Beds | Baths | Sqft | Rent | $/sqft | DOM | Units | Dist |
|---|---|---|---|---|---|---|---|---|
| 609 Carson St Mexico, MO | 3.0 | 1.0 | 1100 | $1,150 | $1.05 | 21d | 1 | 0.88mi |
| 1227 W Breckenridge Dr Apt 04 Mexico, MO | 3.0 | 1.0 | 875 | $870 | $0.99 | 44d | 1 | 1.31mi |
| 1312 W Breckenridge Dr Apt 02 Mexico, MO | 3.0 | 1.0 | 900 | $870 | $0.97 | 13d | 1 | 1.34mi |
Listing history 5 events
-
2026-05-01$119,900 Active 503-char remark
-
2026-03-13status Active
-
2026-03-06status Pending
-
2026-02-18$129,900 Active
-
2014-03-21soldstatus
ⓘ Source: listings_history table (triggers on properties + properties_extension) + one-shot
backfill from property_details.listing_events for pre-trigger history.
Tax reassessment forecast MO · Resets to sale price
- Current annual tax
- $414 · $35/mo
- Projected year-2 tax
- $1,163 · $97/mo
- Expected delta
- +$749/yr (+$62/mo · 180.6%)
ⓘ Screening estimate from a state-policy table — verify with the county assessor before closing.
Climate risk First Street
- Flood 1/10 Low FEMA zone X (unshaded) · 0% chance over 30 yrs
- Wildfire 3/10 Moderate
- Heat 4/10 Moderate 7 d/yr ≥106°F today · 19 d/yr by 30 yrs out
- Wind 2/10 Low
- Air quality 1/10 Low 0 unhealthy d/yr today · 0 by 30 yrs out
Nearby sold comps map
Loading sold comps map…
Walkable amenities ~0.75 mi
Loading nearby amenities…
Taxation est. · year 1
- Rental income
- $12,060
- − Mortgage interest
- −$6,716
- − Property taxes
- −$414
- − Insurance
- −$600
- − Repairs & maintenance
- −$965
- − Management
- −$965
- − Depreciation
- −$3,488
- Taxable loss
- −$1,088
- Est. tax savings @ 24.0%
- +$261
- After-tax cash flow
- $1,229/yr
For passive investors: Depreciation is non-cash, so a rental often shows a tax loss while cash-flowing — sheltering income. Rental losses are passive: they offset passive income freely, and up to $25,000/yr can offset ordinary (W-2) income if you actively participate and your MAGI is under $100k (phasing out to $0 by $150k); unused losses carry forward. On sale, claimed depreciation is recaptured at up to 25%, and gains may owe capital-gains tax (a 1031 exchange can defer both). Figures are a year-1 estimate at your 24.0% rate — not tax advice; consult a CPA.
Schools (NCES district)
- District
- Mexico 59
- NCES district ID
- 2920810
- Math proficiency
- 31% ▼ -3.00%
- Reading proficiency
- 38% ▼ -4.00%
- Median HH income
- $41,152
- Composite
- 29.07/100
- National rank
- #6601
- State rank
- #229 of 324 in MO
Livability — Mexico
- Score
- 65/100
- State rank
- #256
- US rank
- #12405
Category grades
Schools grade is shown separately in the Schools card above.
Census & demographics
- Census place
- Mexico, MO
- Population (ZIP)
- 15,131
Population outlook (Audrain County) Hauer SSP2
- Today (2025)
- 27,791 people
- By 2030
- 28,684 · +3.2%
- By 2040
- 30,598 · +10.1%
- By 2050
- 32,319 · +16.3%
- By 2075
- 36,395 · +31.0%
- By 2100
- 37,277 · +34.1%
Race, ethnicity, and origin ACS 2023
- Neighborhood character
- Predominantly White (84%)
- Race & ethnicity
- White 84% Two or more races 6% Black 5% Hispanic / Latino 4%
- Common ancestry
- Italian 2% Lithuanian 2% Slovak 1%
- Foreign-born
- 2% · Canada
- Languages at home
- 96% English-only · Spanish 3% Chinese 1%
Political lean MEDSL · Audrain
- 2024 margin
- Solid R (+47.6) · D 25.6% · R 73.2% · Other 1.2%
- 2008→2024 swing
- -31.6pp toward R · 2008: -16.1pp · 2024: -47.6pp
- All cycles
- 2024: R+47.6 2020: R+47.2 2016: R+44.0 2012: R+26.6 2008: R+16.1
Not yet ingested
- Civics
- —
Market trends
- HPI YoY
- ▼ -92.24%
- Current HPI
- 213.6163
- Rent YoY
- —
- Metro
- —
- State GDP YoY
- ▲ 1.84%
- F500 in state
- 20
Industry mix (Fortune 500 HQ in MO)
| Industry | F500 HQs | Revenue |
|---|---|---|
| Healthcare | 1 | $163B |
|
||
| Insurance | 1 | $21B |
|
||
| Industrial Technology | 1 | $17B |
|
||
| Retail | 1 | $16B |
|
||
| Industrial Distribution | 1 | $10B |
|
||
| Utilities | 1 | $9B |
|
||
Price history
-7.7% since first listed5 events — show timeline
- 2026-05-01 Listed $119,900 CBORMLS
- 2026-03-13 Relisted — CBORMLS
- 2026-03-06 Pending — CBORMLS
- 2026-02-18 Listed $129,900 CBORMLS
- 2014-03-21 Sold (Public Records) — Public Records
Property tax history
+0.6%/yrLatest (2025): $414 · +0.4% YoY. Source: county tax records.
Cash-flow waterfall
monthlySold comps — $/sqft
last 12 mo · ≤1 miLoading sold comps…