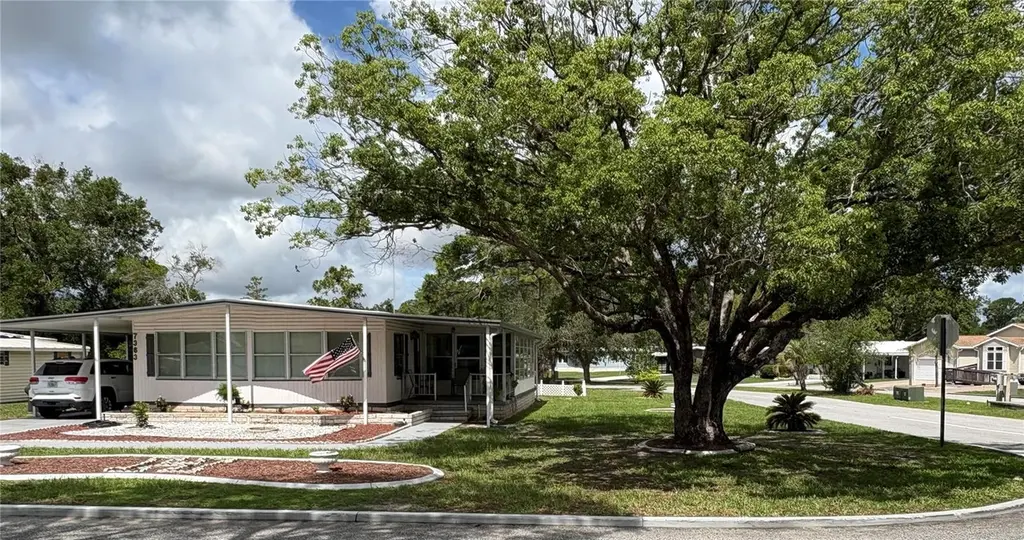
7363 Brookridge Central Blvd · Brookridge, FL
Flood risk 8/10 · Major
- FEMA flood zone
- X (unshaded)
- Chance of flooding over 30 yrs
- 0.99%
- Est. flood insurance / yr
- $507 – $1,088
Fire risk 3/10 · Minor
- Est. fire insurance / yr
- $947 – $1,759
Heat risk 10/10 · Severe
- Hot days now (above 109°F)
- 7 days/yr
- Hot days in 30 yrs
- 25 days/yr
Wind risk 9/10 · Severe
- Chance of severe wind over 30 yrs
- 99.0%
Air-quality risk 2/10 · Minimal
- Unhealthy air days now
- 2 days/yr
- Unhealthy air days in 30 yrs
- 2 days/yr
Risk factors via First Street. Map © Google.
Why this score? — see what drove the D- grade
The composite is a weighted blend of 9 inputs, each scored 0–100. Each bar is that input's sub-score; the figure is the points it added to the 100-point composite (weight × sub-score).
- Cash flow +11.7/30.0
- ARV discount +7.4/15.0
- Schools +4.2/10.0
- Livability +3.5/5.0
- DSCR +3.4/10.0
- 1% rule +2.7/10.0
- Rent growth +2.5/5.0
- Condition / age +2.5/5.0
- Appreciation +0.0/10.0
$175,000
🖨 Deal sheet (PDF) 📄 Offer letter ✓ Due diligence
Listing remarks
Come see this beautiful 2 bedroom, 2 bath home located on a corner lot in the highly sought after Brookridge 55+ community. This spacious home has a large living room, dining room and a den/study with a wet bar. New flooring over the new subfloor, which has been replaced throughout most of the house in 2024. Enjoy your mornings on the large Florida room. Golf cart garage with storage/workshop attached. And remember, you own the lan own). Sitting on a large corner lot that you own with retention pond in back (meaning no rear neighbors), you're only minutes away from everything. Centrally located to shopping, restaurants, and medical facilities, and only a short distance to the SunCoast Parkw
Key facts
- Wet bar
- Retention pond
- Golf cart garage
Tags
Property features AI
Finance
- Other: Total lot dimensions approximately 75 x 100; Lot acreage under 1/4 acre
- Financial info: Lease restrictions apply
- HOA & community: Member of Brookridge Community Property Homeowners Association; Monthly HOA fee of $55 (includes pool, private road maintenance and recreational facilities); Buyer/association approval required; Association amenities: clubhouse, golf course, pickleball courts, pool, sauna, tennis courts; Deed restrictions; Golf carts allowed; Senior community; Pets allowed (cats and dogs)
Exterior
- Parking: Covered parking; Driveway parking; Golf cart garage and designated golf cart parking; 1-car carport
- Security: Gated community (community gate access)
- Utilities: Public water; Public sewer; Electricity available; Sewer connected; Water connected; Cable available
- Home design: Manufactured home (double wide); Attached property; Single-story; East-facing
- Construction: Vinyl siding; Shingle roof; Crawlspace foundation; Built as a double-wide manufactured home
- Exterior features: Porch; Screened porch; Asphalt road frontage; Storage building; Workshop; Irrigation equipment
Interior
- Kitchen: Built-in oven; Cooktop; Range hood; Dishwasher; Refrigerator; Eat-in kitchen
- Bedrooms: 2 bedrooms
- Flooring: Laminate flooring
- Bathrooms: 2 full bathrooms
- Heating & cooling: Electric heating; Exhaust fan; Central air conditioning
- Interior features: Built-in features throughout; Ceiling fans; Eat-in kitchen; Walk-in closet(s); Wet bar; Skylight(s)
- Laundry & utility: Washer hookup; Dryer hookup (electric); Laundry area in garage
Neighborhood map
What this means for you Summary
Snapshot
- This is a 3-bed/2.0-bath manufactured listed at $175k.
Deal economics
- At list price, monthly cash flow is $-118 ($-1k/yr) — negative.
- To cash-flow at today's rent, offer at most $154k (11.9% below list).
- To meet the 1% rule (rent ≥ 1% of price), the offer needs to be $135k (23.1% below list).
- Recommended offer: $135k (23.1% below list) — sets the bar for 1% rule.
Location & tenants
- Location reads 70/100 on livability (#421 in FL) — a middle-class / working-renter tenant base. Strengths: cost of living A+, housing A+, crime B+; Watch: employment C-, health & safety C-, amenities F.
- Hernando (suburban): math 50% / reading 50% proficiency, ranked #38 of 73 in FL (top 52%) — acceptable for families but not a draw, mixed tenant base, ~2y average lease.
- Zoned schools: Pine Grove Elementary School (math 60% / reading 45%, grade C-, #976 of 2,144 statewide, top 46%, 991 students, 60% FRL); West Hernando Middle School (math 36% / reading 37%, grade F, #405 of 571 statewide, top 72%, 695 students, 58% FRL); Central High School (math 34% / reading 44%, grade F, #312 of 667 statewide, top 48%, 1,426 students, 53% FRL) — zoned schools at 57% FRL track the district average.
- Market conditions: 702 active listings in the ZIP; 15 comparable units currently listed for rent nearby; rentals at typical pace (median 25d on market — plan ~3-4 weeks tenant-placement turnaround); 2,505 units permitted in Hernando County in 2024 (318 in 5+ unit buildings).
Forward outlook
- Local home prices are declining (-3.0%/yr); year-one equity from $1k of loan paydown is wiped out by about $5k of value loss. Plan a longer hold.
- Hernando County population projected at +11% by 2050 — modest demand growth; plan on rents tracking national, not racing it.
Negotiation context
- It's been on market 16 days — a 2% lower offer ($172k) is reasonable based on typical stale-listing flexibility.
- 13 sale attempts since 20y ago with the ask held roughly flat each time — persistent listings suggest the price (not the market) is what's stuck; bring a comps-based counter.
- Current owner paid $75k; list at $175k implies a 133% gain — meaningful room to come down on a strong offer.
Risks & watch-outs
- Watch-outs: flood insurance adds $66/mo.
- Climate carrying-cost: severe flood risk; severe wind risk, 99% chance of damaging wind over 30y; extreme-heat days projected 7→25/yr by 2055 (HVAC capex compounding) — expect insurance premiums to compound above CPI over the hold.
Questions for the listing agent
- What do current leases actually rent for vs. the listed asking? Can we see a recent rent roll and the last 12 months of T-12 income?
- What's the actual annual flood-insurance premium (NFIP or private), and is the property in a SFHA with mandatory coverage?
- What does the HOA fee cover, when was the last increase, and are there any pending special assessments or reserve-fund shortfalls?
- Is there a deadline driving the sale (1031 exchange, divorce, estate, relocation)? That informs how much negotiation room exists.
- Schools are F-rated, which usually means shorter tenancies and higher turnover. Who's the typical renter profile here, and what's been the actual vacancy rate?
- The area grade is low — what's the realistic commute time and amenity access for the typical tenant pool here? Any planned neighborhood developments (good or bad) we should know about?
- What's the average days-on-market for RENTAL listings here right now (not sales)? A rising rental-DOM trend means longer vacancies and softer asking-rent achievability than the comps imply.
- What's the recent tenant-quality profile in this submarket — average credit score on applications, eviction rate, late-payment / NSF rate, and stable-employment percentage? A property-management company in the area should have these aggregated.
- How much new for-sale + rental construction is in the pipeline within 1–3 miles? Heavy new supply typically softens prices + rents 12–24 months out; constrained supply supports both.
Investment metrics
- 1% rule
- 0.77% ✗
- Cap rate
- 5.94%
- Cash-on-cash
- -1.27%
- DSCR
- 0.94
- GRM
- 10.8
CMA / ARV
- ARV (on-the-fly)
- $174,720
- Comps found
- 12
Show comp detail 12 sales within ~0.75 mi
| Address | Dist | Beds/Ba | Sqft | Sold | Price | $/sf | Match |
|---|---|---|---|---|---|---|---|
| 14563 Brookridge Blvd | 0.09mi | 3/2.0 | 1,344 (0%) | 2mo | $224,000 | $167 | 94 |
| 7444 Moriah Ave | 0.15mi | 3/2.0 | 1,344 (0%) | 3mo | $135,000 | $100 | 90 |
| 7472 Moriah Ave | 0.15mi | 2/2.0 (-1) | 1,288 (-4%) | 1mo | $158,000 | $123 | 80 |
| 14334 Midfield St | 0.16mi | 3/2.0 | 1,440 (+7%) | 4mo | $131,900 | $92 | 78 |
| 7408 Morelli Ave | 0.20mi | 3/2.0 | 1,485 (+10%) | 3mo | $192,500 | $130 | 71 |
| 7464 Dinsmore St | 0.17mi | 2/2.0 (-1) | 1,200 (-11%) | 2mo | $175,000 | $146 | 68 |
| 14383 Dehaven Ave | 0.28mi | 3/2.0 | 1,493 (+11%) | 1mo | $189,000 | $127 | 68 |
| 8064 Mission St | 0.44mi | 2/2.0 (-1) | 1,311 (-2%) | 4mo | $165,000 | $126 | 67 |
| 8305 Weatherford Ave | 0.61mi | 2/2.0 (-1) | 1,314 (-2%) | 1mo | $193,000 | $147 | 62 |
| 14371 Nectarine St | 0.43mi | 2/2.0 (-1) | 1,178 (-12%) | 1mo | $205,000 | $174 | 54 |
| 14386 Starcross St | 0.45mi | 2/2.0 (-1) | 1,192 (-11%) | 4mo | $163,000 | $137 | 52 |
| 8057 Dinsmore St | 0.50mi | 2/2.0 (-1) | 1,152 (-14%) | 2mo | $85,000 | $74 | 46 |
Match score weights: distance 35% · size 25% · config 20% · recency 20%. Top-matched comps best support the ARV.
Projected returns pro-forma
-3.0% appreciation · 3.0% rent growth · sell at horizon
- IRR
- -21.1%
- Equity multiple
- 0.27×
- Total profit
- $-35,890
- Equity at exit
- $26,093
- IRR
- -14.6%
- Equity multiple
- 0.16×
- Total profit
- $-40,942
- Equity at exit
- $15,131
Cash invested: $49,000 (down + closing). Projections, not guarantees.
Landlord ↔ Tenant lean methodology
- Overall (STATE)
- 87 Strongly Landlord-Friendly
- State Florida
- 87 Strongly Landlord-Friendly · R+3
- County
- — inherits STATE
- City
- — inherits STATE
ZIP-level market 34613
- Home prices YoY
- -17.2%
- Active inventory
- 702
- Price-to-rent
- 10.8×
Monthly cashflow live
- Estimated rent
- $1,346 high interval (Pro) →
- Mortgage (P&I)
- −$918
- Tax from tax record
- −$69 /mo · $832/yr
- Insurance
- −$73
- Flood insurance flood zone
- −$66 /mo · $798/yr
- HOA
- −$55
- Lot rent leased land?
- −$0
- Vacancy / Maint / Mgmt
- −$283
- Net cashflow
- $-118
Break-even live
Sensitivity live
| Price | -10% $-19 | -5% $-69 | +0% $-118 | +5% $-168 | +10% $-217 |
|---|---|---|---|---|---|
| Rent | -10% $-225 | -5% $-171 | +0% $-118 | +5% $-65 | +10% $-12 |
| Rate | -1.0pp $-30 | -0.5pp $-74 | base $-118 | +0.5pp $-164 | +1.0pp $-210 |
UW: 25.0% down · 7.5% · 30yr · 1.5% tax · 5.0% vac · 8.0% maint · 8.0% mgmt
Financing live
Cash to close
- Down payment
- $43,750
- Closing costs
- $5,250
- Reserves months
- —
- Total cash needed
- —
Loan-product check · same deal, 3 products live
Conventional
25% down · 7.5% · 30yr
- Down + closing
- —
- Monthly P&I
- —
- Monthly cashflow
- —
- DSCR
- —
- Eligible?
- —
Personal DTI + credit; lowest rate.
DSCR
20% down · 8.5% · 30yr
- Down + closing
- —
- Monthly P&I
- —
- Monthly cashflow
- —
- DSCR
- —
- Eligible?
- —
No personal income docs; deal must DSCR.
Hard money
10% down · 12.0% · 12mo
- Down + closing
- —
- Monthly P&I
- —
- Monthly cashflow
- —
- DSCR
- —
- Eligible?
- —
Short-term bridge; refi at stabilization.
Rent comps 15 comps
| Address | Beds | Baths | Sqft | Rent | $/sqft | DOM | Units | Dist |
|---|---|---|---|---|---|---|---|---|
| 14697 Brookridge Blvd Brooksville, FL | 2.0 | 2.0 | 1056 | $1,350 | $1.28 | 27d | 1 | 0.16mi |
| 14342 Starcross St Brooksville, FL | 2.0 | 1.0 | 900 | $1,025 | $1.14 | 24d | 1 | 0.39mi |
| 7124 Barclay Ave Unit A Spring Hill, FL | 2.0 | 2.0 | 927 | $1,500 | $1.62 | 27d | 1 | 0.41mi |
| 14360 Barley Grass Rd Spring Hill, FL | 3.0–5.0 | 2.0–3.0 | 1975 | $2,195 | $1.11 | 4d | 19 | 0.74mi |
| 8407 Weatherford Ave Brooksville, FL | 2.0 | 2.0 | 1104 | $1,500 | $1.36 | 20d | 1 | 0.77mi |
| 9356 Southern Charm Cir Brooksville, FL | 3.0 | 2.0 | 1621 | $1,800 | $1.11 | 27d | 1 | 0.82mi |
| 14131 Lemon Yellow Tree Ln Brooksville, FL | 3.0 | 2.0 | 1840 | $1,979 | $1.08 | 7d | 1 | 0.94mi |
| 14373 Irving St Unit B Brooksville, FL | 2.0 | 1.0 | 900 | $1,750 | $1.94 | 2d | 1 | 0.96mi |
| 8917 Southern Charm Cir Brooksville, FL | 3.0 | 2.0 | 1437 | $1,695 | $1.18 | 6d | 1 | 1.17mi |
| 8871 Southern Charm Cir Brooksville, FL | 3.0 | 2.0 | 1482 | $2,050 | $1.38 | 27d | 1 | 1.22mi |
| 6372 Gainsboro Ave Spring Hill, FL | 3.0 | 2.0 | 1535 | $1,889 | $1.23 | 1d | 1 | 1.26mi |
| 13109 Lola Dr Spring Hill, FL | 2.0 | 2.0 | 1483 | $4,900 | $3.30 | 27d | 1 | 1.29mi |
| 9919 Scepter Ave Brooksville, FL | 3.0 | 2.0 | 1188 | $1,250 | $1.05 | 7d | 1 | 1.30mi |
| 13186 Thrush St Spring Hill, FL | 3.0 | 2.0 | 1114 | $1,950 | $1.75 | 27d | 1 | 1.34mi |
| 8761 Fetterbush Ct Brooksville, FL | 3.0 | 2.0 | 1730 | $1,850 | $1.07 | 27d | 1 | 1.35mi |
HOA detail
- Monthly dues
- $55 · $660/yr
Listing history 12 events
-
2026-06-22days on market $175,000 Active 16 DOM
-
2026-06-21days on market $175,000 Active 15 DOM
-
2026-06-18days on market $175,000 Active 12 DOM
-
2026-06-17days on market $175,000 Active 11 DOM
-
2026-06-16days on market $175,000 Active 10 DOM
-
2026-06-15days on market $175,000 Active 9 DOM
-
2026-06-13days on market $175,000 Active 7 DOM
-
2026-06-13days on market $175,000 Active 6 DOM
-
2026-06-09days on market $175,000 Active 3 DOM
-
2026-06-08days on market $175,000 Active 2 DOM
-
2026-06-07remarks 699-char remark
-
2026-06-07$175,000 Active 1 DOM
ⓘ Source: listings_history table (triggers on properties + properties_extension) + one-shot
backfill from property_details.listing_events for pre-trigger history.
Tax reassessment forecast FL · Resets to sale price
- Current annual tax
- $832 · $69/mo
- Projected year-2 tax
- $1,452 · $121/mo
- Expected delta
- +$621/yr (+$52/mo · 74.6%)
ⓘ Screening estimate from a state-policy table — verify with the county assessor before closing.
Climate risk First Street
- Flood 8/10 Severe FEMA zone X (unshaded) · 99% chance over 30 yrs
- Wildfire 3/10 Moderate
- Heat 10/10 Extreme 7 d/yr ≥109°F today · 25 d/yr by 30 yrs out
- Wind 9/10 Extreme 99% chance of damaging wind over 30 yrs
- Air quality 2/10 Low 2 unhealthy d/yr today · 2 by 30 yrs out
Nearby sold comps map
Loading sold comps map…
Walkable amenities ~0.75 mi
Loading nearby amenities…
Taxation est. · year 1
- Rental income
- $16,149
- − Mortgage interest
- −$9,803
- − Property taxes
- −$832
- − Insurance
- −$1,672
- − Repairs & maintenance
- −$1,292
- − Management
- −$1,292
- − HOA
- −$660
- − Depreciation
- −$5,091
- Taxable loss
- −$4,493
- Est. tax savings @ 24.0%
- +$1,078
- After-tax cash flow
- $-341/yr
For passive investors: Depreciation is non-cash, so a rental often shows a tax loss while cash-flowing — sheltering income. Rental losses are passive: they offset passive income freely, and up to $25,000/yr can offset ordinary (W-2) income if you actively participate and your MAGI is under $100k (phasing out to $0 by $150k); unused losses carry forward. On sale, claimed depreciation is recaptured at up to 25%, and gains may owe capital-gains tax (a 1031 exchange can defer both). Figures are a year-1 estimate at your 24.0% rate — not tax advice; consult a CPA.
Schools (NCES district)
- District
- Hernando
- NCES district ID
- 1200810
- Math proficiency
- 50% ▼ -8.00%
- Reading proficiency
- 50% ▼ -4.00%
- Median HH income
- $41,985
- Composite
- 42.03/100
- National rank
- #3329
- State rank
- #38 of 73 in FL
Livability — Brookridge
- Score
- 70/100
- State rank
- #421
- US rank
- #7529
Category grades
Schools grade is shown separately in the Schools card above.
Census & demographics
- Census place
- Brookridge, FL
- County
- Hernando County · 169,677 people
- Metro
- Tampa-St. Petersburg-Clearwater, FL
- Population (ZIP)
- 19,337
- Household income
- $58,596
- Rent vs Own
- Severe rent burden
- 307.0
Population outlook (Hernando County) Hauer SSP2
- Today (2025)
- 189,218 people
- By 2030
- 194,367 · +2.7%
- By 2040
- 203,398 · +7.5%
- By 2050
- 209,589 · +10.8%
- By 2075
- 218,452 · +15.4%
- By 2100
- 205,923 · +8.8%
Race, ethnicity, and origin ACS 2023
- Neighborhood character
- Predominantly White (88%)
- Race & ethnicity
- White 88% Hispanic / Latino 6% Two or more races 4% Black 2% Asian 1%
- Hispanic origin (detail)
- Mexican 1% Puerto Rican 2% Cuban 1%
- Common ancestry
- Romanian 4% Lithuanian 3% Slovak 2%
- Foreign-born
- 8% · Canada, Vietnam
- Languages at home
- 92% English-only · Spanish 3% French/Haitian/Cajun 1% Russian/Polish/Slavic 1%
Political lean MEDSL · Hernando
- 2024 margin
- Solid R (+37.0) · D 31.1% · R 68.2%
- 2008→2024 swing
- -33.5pp toward R · 2008: -3.6pp · 2024: -37.0pp
- All cycles
- 2024: R+37.0 2020: R+30.2 2016: R+29.0 2012: R+8.5 2008: R+3.6
Not yet ingested
- Civics
- —
Market trends
- HPI YoY
- ▼ -57.51%
- Current HPI
- 276.2229
- Rent YoY
- —
- Metro
- Tampa-St. Petersburg-Clearwater, FL
- State GDP YoY
- ▲ 3.28%
- F500 in state
- 36
Industry mix (Fortune 500 HQ in FL)
| Industry | F500 HQs | Revenue |
|---|---|---|
| Industrial Technology | 2 | $29B |
|
||
| Insurance | 2 | $17B |
|
||
| Retail | 1 | $60B |
|
||
| Technology Distribution | 1 | $58B |
|
||
| Homebuilding | 1 | $35B |
|
||
| Technology Manufacturing | 1 | $35B |
|
||
Price history
+262.3% since first listed31 events — show timeline
- 2026-06-06 Listed $175,000 Stellar MLS as Distributed by MLS Grid
- 2026-05-14 Listing Removed — HCAR
- 2026-03-30 Price Changed $175,272 HCAR
- 2025-11-04 Listed $179,179 HCAR
- 2025-05-01 Listing Removed — HCAR
- 2025-04-01 Relisted — HCAR
- 2025-04-01 Price Changed $188,000 HCAR
- 2025-04-01 Listing Removed — HCAR
- 2025-01-10 Price Changed $189,000 HCAR
- 2024-09-11 Listed $199,000 HCAR
- 2021-02-09 Listing Removed — HCAR
- 2021-01-21 Listed $95,000 HCAR
- 2019-11-11 Listing Removed — HCAR
- 2017-07-20 Sold (Public Records) $75,000 Public Records
- 2017-07-14 Sold (MLS) $75,000 St. Augustine and St. Johns County Board of REALTORS®
- 2017-07-14 Sold (MLS) $75,000 HCAR
- 2017-05-17 Listed $79,500 St. Augustine and St. Johns County Board of REALTORS®
- 2017-05-17 Listed $79,500 HCAR
- 2016-10-28 Listing Removed — Stellar MLS as Distributed by MLS Grid
- 2016-10-28 Listing Removed — HCAR
- 2016-08-18 Listed $67,000 Stellar MLS as Distributed by MLS Grid
- 2016-08-18 Listed $67,000 HCAR
- 2010-08-11 Listing Removed — HCAR
- 2010-06-01 Listed $69,900 HCAR
- 2010-01-18 Listed $75,000 HCAR
- 2009-07-28 Listing Removed — HCAR
- 2007-03-08 Listed $93,500 HCAR
- 2007-03-07 Listing Removed — Stellar MLS as Distributed by MLS Grid
- 2006-11-07 Listed $106,400 Stellar MLS as Distributed by MLS Grid
- 1987-11-01 Sold (Public Records) $57,800 Public Records
- 1982-06-01 Sold (Public Records) $48,300 Public Records
Property tax history
+5.1%/yrLatest (2025): $832 · +1.4% YoY. Source: county tax records.
Cash-flow waterfall
monthlySold comps — $/sqft
last 12 mo · ≤1 miLoading sold comps…