 Duplex
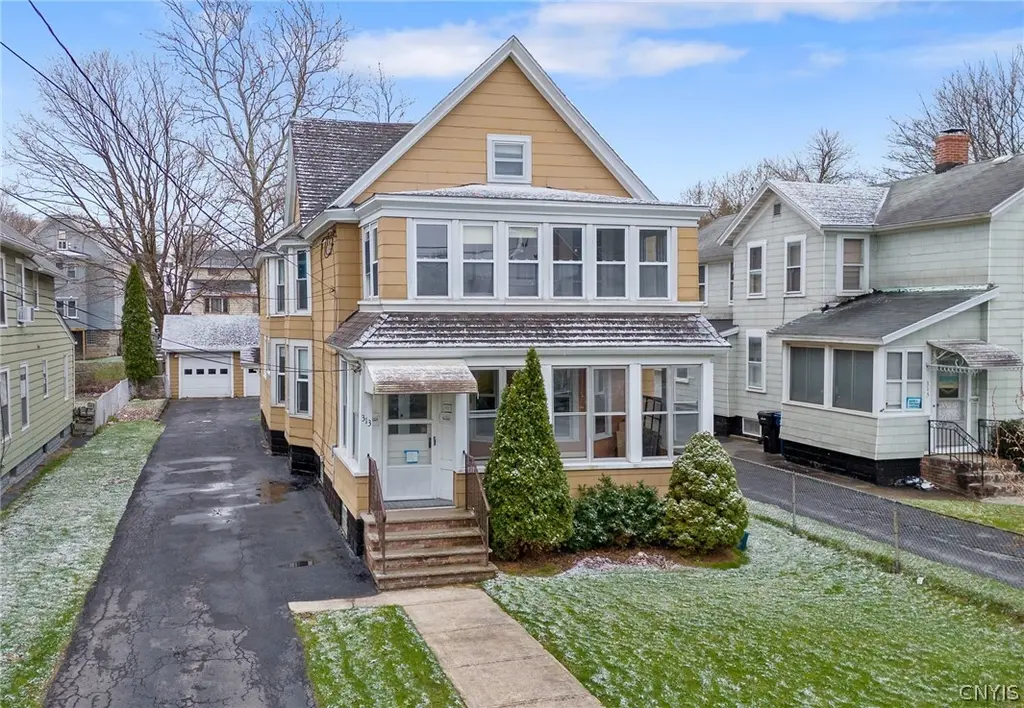
313 Herkimer St · Syracuse, NY
Flood risk 6/10 · Moderate
- FEMA flood zone
- X (unshaded)
- Chance of flooding over 30 yrs
- 0.71%
- Est. flood insurance / yr
- $473 – $860
Fire risk 1/10 · Minimal
- Est. fire insurance / yr
- $691 – $1,283
Heat risk 3/10 · Minor
- Hot days now (above 95°F)
- 7 days/yr
- Hot days in 30 yrs
- 16 days/yr
Wind risk 1/10 · Minimal
- Chance of severe wind over 30 yrs
- 0.0%
Air-quality risk 2/10 · Minimal
- Unhealthy air days now
- 0 days/yr
- Unhealthy air days in 30 yrs
- 1 days/yr
Risk factors via First Street. Map © Google.
Why this score? — see what drove the B grade
The composite is a weighted blend of 9 inputs, each scored 0–100. Each bar is that input's sub-score; the figure is the points it added to the 100-point composite (weight × sub-score).
- Cash flow +30.0/30.0
- DSCR +10.0/10.0
- Appreciation +10.0/10.0
- 1% rule +9.6/10.0
- Rent growth +4.6/5.0
- Livability +3.9/5.0
- Condition / age +2.5/5.0
- Schools +1.8/10.0
- ARV discount +0.0/15.0
$245,000
🖨 Deal sheet (PDF) 📄 Offer letter ✓ Due diligence
Multi-family units
County records classify this as Multi-Family (2-4 Unit). Listing-text estimate: 2 units. confirmed
Listing remarks
Extremely well-maintained 2-family home perfect for an owner-occupant or investor! Each spacious unit features 3 bedrooms, a bright living room, formal dining room, and a functional kitchen, along with enclosed porches for added living space! Beautiful hardwood floors run throughout both units, adding warmth and character. This property also offers a clean, dry basement with durable block windows, and an efficient and well-maintained boiler system! Separate utilities provide convenience and flexibility! Outside, you’ll find a large 3-car garage and an expansive driveway, offering ample parking and storage! Conveniently located near Tipperary Hill pubs, downtown Syracuse, major highway
Key facts
- Enclosed porches
- Separate utilities
- Boiler system
Tags
Property features AI
Finance
- Financial info: Two total units with separate gas and electric meters; One unit currently rented for $1,000/month (lease through March 31, 2027); Operating expenses include maintenance; Owner pays snow removal and trash collection; rent includes snow removal and trash collection
Exterior
- Parking: Attached or detached 3-car garage; Paved parking with two or more spaces
- Utilities: Public water (connected); Sewer connected
- Home design: Two-story multi-family building; Resale property
- Construction: Built previously (existing structure); Construction details: see remarks
- Exterior features: Rectangular residential lot (approx. 44 x 150); City street frontage
Interior
- Kitchen: Oven/Range; Refrigerator; Microwave (in one unit)
- Bedrooms: Two 3-bedroom units (each unit with 3 bedrooms)
- Flooring: Hardwood; Varies
- Bathrooms: Each unit has 1 full bathroom (total 2 full bathrooms in building)
- Heating & cooling: Gas hot water heating
- Interior features: Enclosed porch; Porch; Full basement
- Laundry & utility: Gas water heater
Neighborhood map
What this means for you Summary
Snapshot
- This is a 2 × 3-bed/1.0-bath units multifamily listed at $245k.
Deal economics
- At list price, monthly cash flow is $1k ($16k/yr) — positive. Per door: $647/mo.
- The deal already cash-flows at list — no discount required.
- Meets the 1% rule at list price ($4k rent vs $245k).
- Cap rate 12.6% vs local median 8.2% in Syracuse — top-decile yield for the area; either an underpriced asset or a hidden risk that comps aren't pricing in. Stress-test before assuming the spread holds.
Location & tenants
- Location reads 77/100 on livability (#187 in NY, #2,869 nationally) — a middle-class / working-renter tenant base. Strengths: amenities A+, commute A+, cost of living A+; Watch: crime F, employment D-.
- Syracuse City School District (urban): math 18% / reading 26% proficiency, ranked #590 of 590 in NY (top 100%) — low school quality limits family demand, transient renter base, plan for 1-2y turnover; 74% free/reduced lunch — lower-income household profile, screen leases tightly.
- Zoned schools: Syracuse Latin School (math 31% / reading 62%, grade D-, #1,262 of 2,108 statewide, top 60%, 642 students, 42% FRL); Expeditionary Learning Middle School (math 17% / reading 32%, grade F, #611 of 729 statewide, top 88%, 170 students, 76% FRL); Institute of Technology At Syracuse Central (math 87% / reading 92%, grade A+, #265 of 1,100 statewide, top 26%, 581 students, 68% FRL).
- Zoned-school proficiency averages 54% at this address vs 22% district-wide (+32 pts) — the actual schools serving this property are materially stronger than the Syracuse City School District average implies; a family-tenant draw the district grade alone would hide.
- Market conditions: Rents rising fast (+8.2%/yr); 121 active listings in the ZIP; 616 units permitted in Onondaga County in 2024 (256 in 5+ unit buildings).
Forward outlook
- In year one you build about $26k of equity ($2k loan paydown + $24k appreciation (10.0% local appreciation)).
- Onondaga County population projected to shrink 9% by 2050 — rents likely to lag national; underwrite the cash flow, not the appreciation.
- At projected returns (10.0% appreciation + 8.0% rent growth), your $69k cash investment doubles in ~2 years — after that, you're playing with house money.
- By year 2, paydown + projected appreciation supports a ~$42k cash-out refi (75% LTV) — recoverable capital for the next deal without selling this one.
Negotiation context
- Only 5 days on market — expect competitive offers; lowballing is unlikely to land.
- Current owner paid $143k; list at $245k implies a 72% gain — meaningful room to come down on a strong offer.
Risks & watch-outs
- Watch-outs: built in 1888 — expect roof / HVAC / electrical / plumbing capex.
- Climate carrying-cost: major flood risk — expect insurance premiums to compound above CPI over the hold.
Questions for the listing agent
- Can we see the unit-by-unit rent roll, current vacancy, and any below-market leases? What's the average tenancy length?
- What capital expenditures (roof, boiler, parking lot, exteriors) have been made in the last 5 years, and what's planned in the next 2?
- Built in 1888 — when were the roof, HVAC, electrical panel, plumbing, and water heater last replaced?
- Is there a deadline driving the sale (1031 exchange, divorce, estate, relocation)? That informs how much negotiation room exists.
- Schools are D-rated, which usually means shorter tenancies and higher turnover. Who's the typical renter profile here, and what's been the actual vacancy rate?
- Crime grade is F in this area — have there been break-ins, vandalism, or insurance claims at this property in the last 3 years? What carrier currently insures it and at what premium?
- What's the average days-on-market for RENTAL listings here right now (not sales)? A rising rental-DOM trend means longer vacancies and softer asking-rent achievability than the comps imply.
- What's the recent tenant-quality profile in this submarket — average credit score on applications, eviction rate, late-payment / NSF rate, and stable-employment percentage? A property-management company in the area should have these aggregated.
- How much new apartment / multifamily construction is in the pipeline within 1–3 miles? Heavy new supply (>2% of stock underway) typically softens rents 12–24 months out; light construction supports rent growth.
Investment metrics
- 1% rule
- 1.46% ✓
- Cap rate
- 12.63%
- Cash-on-cash
- 22.64%
- DSCR
- 2.01
- GRM
- 5.7
CMA / ARV
- ARV (on-the-fly)
- $206,586
- Comps found
- 9
Show comp detail 9 sales within ~0.75 mi
| Address | Dist | Beds/Ba | Sqft | Sold | Price | $/sf | Match |
|---|---|---|---|---|---|---|---|
| 313 Herkimer St | 0.00mi | 6/2.0 | 2,994 (0%) | 1mo | $280,000 | $94 | 99 |
| 806 Avery Ave | 0.16mi | 6/2.0 | 2,932 (-2%) | 19mo | $171,000 | $58 | 74 |
| 218-20 Avery Ave | 0.41mi | 6/2.0 | 2,784 (-7%) | 10mo | $341,000 | $122 | 61 |
| 602 Tompkins St | 0.54mi | 6/2.0 | 2,624 (-12%) | 3mo | $265,000 | $101 | 52 |
| 948 Emerson Ave | 0.48mi | 7/3.0 (+1) | 3,088 (+3%) | 22mo | $180,000 | $58 | 45 |
| 129 Tennyson Ave | 0.70mi | 5/3.0 (-1) | 3,064 (+2%) | 13mo | $210,000 | $69 | 44 |
| 300 Whittier Ave | 0.72mi | 6/3.0 | 3,084 (+3%) | 18mo | $150,000 | $49 | 43 |
| 137-39 Bryant Ave | 0.75mi | 5/2.0 (-1) | 2,690 (-10%) | 16mo | $270,000 | $100 | 29 |
| 911 Park Ave | 0.74mi | 5/2.0 (-1) | 2,608 (-13%) | 14mo | $165,000 | $63 | 27 |
Match score weights: distance 35% · size 25% · config 20% · recency 20%. Top-matched comps best support the ARV.
Projected returns pro-forma
10.0% appreciation · 8.0% rent growth · sell at horizon
- IRR
- 43.9%
- Equity multiple
- 4.42×
- Total profit
- $234,739
- Equity at exit
- $220,715
- IRR
- 39.9%
- Equity multiple
- 10.81×
- Total profit
- $673,267
- Equity at exit
- $475,981
Cash invested: $68,600 (down + closing). Projections, not guarantees.
Landlord ↔ Tenant lean methodology
- Overall (STATE)
- 15 Strongly Tenant-Friendly
- State New York
- 15 Strongly Tenant-Friendly · D+10
- County
- — inherits STATE
- City
- — inherits STATE
ZIP-level market 13204
- Home prices YoY
- 31.6%
- Rents YoY
- 8.2%
- Active inventory
- 121
- Price-to-rent
- 11.4×
Monthly cashflow live
- Estimated rent
- $3,582 high interval (Pro) →
- Mortgage (P&I)
- −$1,285
- Tax from tax record
- −$149 /mo · $1,786/yr
- Insurance
- −$102
- HOA
- −$0
- Vacancy / Maint / Mgmt
- −$752
- Net cashflow
- $1,294
Break-even live
Sensitivity live
| Price | -10% $1,433 | -5% $1,363 | +0% $1,294 | +5% $1,225 | +10% $1,155 |
|---|---|---|---|---|---|
| Rent | -10% $1,011 | -5% $1,153 | +0% $1,294 | +5% $1,436 | +10% $1,577 |
| Rate | -1.0pp $1,417 | -0.5pp $1,356 | base $1,294 | +0.5pp $1,231 | +1.0pp $1,166 |
2-unit breakdown (identical units grouped — click to expand)
| Units | Beds | Baths | Est. rent |
|---|---|---|---|
| 2× units | 3 | 1 | $3,582 |
| #1 | 3 | 1 | $1,791 |
| #2 | 3 | 1 | $1,791 |
| Total (2 units) | $3,582 | ||
UW: 25.0% down · 7.5% · 30yr · 1.5% tax · 5.0% vac · 8.0% maint · 8.0% mgmt
Financing live
Cash to close
- Down payment
- $61,250
- Closing costs
- $7,350
- Reserves months
- —
- Total cash needed
- —
Loan-product check · same deal, 3 products live
Conventional
25% down · 7.5% · 30yr
- Down + closing
- —
- Monthly P&I
- —
- Monthly cashflow
- —
- DSCR
- —
- Eligible?
- —
Personal DTI + credit; lowest rate.
DSCR
20% down · 8.5% · 30yr
- Down + closing
- —
- Monthly P&I
- —
- Monthly cashflow
- —
- DSCR
- —
- Eligible?
- —
No personal income docs; deal must DSCR.
Hard money
10% down · 12.0% · 12mo
- Down + closing
- —
- Monthly P&I
- —
- Monthly cashflow
- —
- DSCR
- —
- Eligible?
- —
Short-term bridge; refi at stabilization.
Listing history 3 events
-
2026-04-13status Pending
-
2026-04-08$245,000 Active
-
2018-12-11soldstatus $142,554
ⓘ Source: listings_history table (triggers on properties + properties_extension) + one-shot
backfill from property_details.listing_events for pre-trigger history.
Tax reassessment forecast NY · Partial reset (capped growth)
- Current annual tax
- $1,786 · $149/mo
- Projected year-2 tax
- $2,963 · $247/mo
- Expected delta
- +$1,177/yr (+$98/mo · 65.9%)
ⓘ Screening estimate from a state-policy table — verify with the county assessor before closing.
Climate risk First Street
- Flood 6/10 Major FEMA zone X (unshaded) · 71% chance over 30 yrs
- Wildfire 1/10 Low
- Heat 3/10 Moderate 7 d/yr ≥95°F today · 16 d/yr by 30 yrs out
- Wind 1/10 Low 0% chance of damaging wind over 30 yrs
- Air quality 2/10 Low 0 unhealthy d/yr today · 1 by 30 yrs out
Nearby sold comps map
Loading sold comps map…
Walkable amenities ~0.75 mi
Loading nearby amenities…
Taxation est. · year 1
- Rental income
- $42,984
- − Mortgage interest
- −$13,724
- − Property taxes
- −$1,786
- − Insurance
- −$1,225
- − Repairs & maintenance
- −$3,439
- − Management
- −$3,439
- − Depreciation
- −$7,127
- Taxable income
- $12,244
- Est. tax owed @ 24.0%
- −$2,939
- After-tax cash flow
- $12,590/yr
For passive investors: Depreciation is non-cash, so a rental often shows a tax loss while cash-flowing — sheltering income. Rental losses are passive: they offset passive income freely, and up to $25,000/yr can offset ordinary (W-2) income if you actively participate and your MAGI is under $100k (phasing out to $0 by $150k); unused losses carry forward. On sale, claimed depreciation is recaptured at up to 25%, and gains may owe capital-gains tax (a 1031 exchange can defer both). Figures are a year-1 estimate at your 24.0% rate — not tax advice; consult a CPA.
Schools (NCES district)
- District
- Syracuse City School District
- NCES district ID
- 3628590
- Math proficiency
- 18% ▼ -5.00%
- Reading proficiency
- 26% ▬ 0.00%
- Median HH income
- $32,097
- Composite
- 17.83/100
- National rank
- #9007
- State rank
- #590 of 590 in NY
Livability — Syracuse
- Score
- 77/100
- State rank
- #187
- US rank
- #2869
Category grades
Schools grade is shown separately in the Schools card above.
Census & demographics
- Census place
- Syracuse, NY
- County
- Onondaga County · 247,257 people
- City population
- 152,627
- Metro
- Syracuse, NY
- Population (ZIP)
- 19,440
- Household income
- $45,351
- Rent vs Own
- Severe rent burden
- 2073.0
Population outlook (Onondaga County) Hauer SSP2
- Today (2025)
- 467,894 people
- By 2030
- 463,381 · -1.0%
- By 2040
- 447,697 · -4.3%
- By 2050
- 426,399 · -8.9%
- By 2075
- 373,661 · -20.1%
- By 2100
- 307,967 · -34.2%
Race, ethnicity, and origin ACS 2023
- Neighborhood character
- Diverse neighborhood (Simpson 0.68)
- Race & ethnicity
- White 47% Black 26% Hispanic / Latino 17% Two or more races 13% Native American 1%
- Hispanic origin (detail)
- Puerto Rican 12% Cuban 2% Dominican 1%
- Common ancestry
- Romanian 5% Lithuanian 2% Subsaharan African 2%
- Foreign-born
- 7% · Canada, Jamaica
- Languages at home
- 83% English-only · Spanish 11% Russian/Polish/Slavic 3% Arabic 1%
Political lean MEDSL · Onondaga
- 2024 margin
- D (+17.3) · D 58.6% · R 41.4%
- 2008→2024 swing
- -3.0pp toward R · 2008: 20.3pp · 2024: 17.3pp
- All cycles
- 2024: D+17.3 2020: D+20.6 2016: D+12.8 2012: D+21.1 2008: D+20.3
Not yet ingested
- Civics
- —
Market trends
- HPI YoY
- ▲ 100.14%
- Current HPI
- 416.7272
- Rent YoY
- ▲ 8.24%
- Metro
- Syracuse, NY
- State GDP YoY
- ▲ 2.60%
- F500 in state
- 92
Industry mix (Fortune 500 HQ in NY)
| Industry | F500 HQs | Revenue |
|---|---|---|
| Financial Services | 10 | $950B |
|
||
| Consumer Goods | 9 | $162B |
|
||
| Insurance | 4 | $225B |
|
||
| Telecommunications | 2 | $144B |
|
||
| Pharmaceuticals | 2 | $112B |
|
||
| Media / Entertainment | 2 | $69B |
|
||
Price history
+71.9% since first listed3 events — show timeline
- 2026-04-13 Pending — CNYIS
- 2026-04-08 Listed $245,000 CNYIS
- 2018-12-11 Sold (Public Records) $142,554 Public Records
Property tax history
+1.9%/yrLatest (2025): $1,786 · +0.0% YoY. Source: county tax records.
Cash-flow waterfall
monthlySold comps — $/sqft
last 12 mo · ≤1 miLoading sold comps…