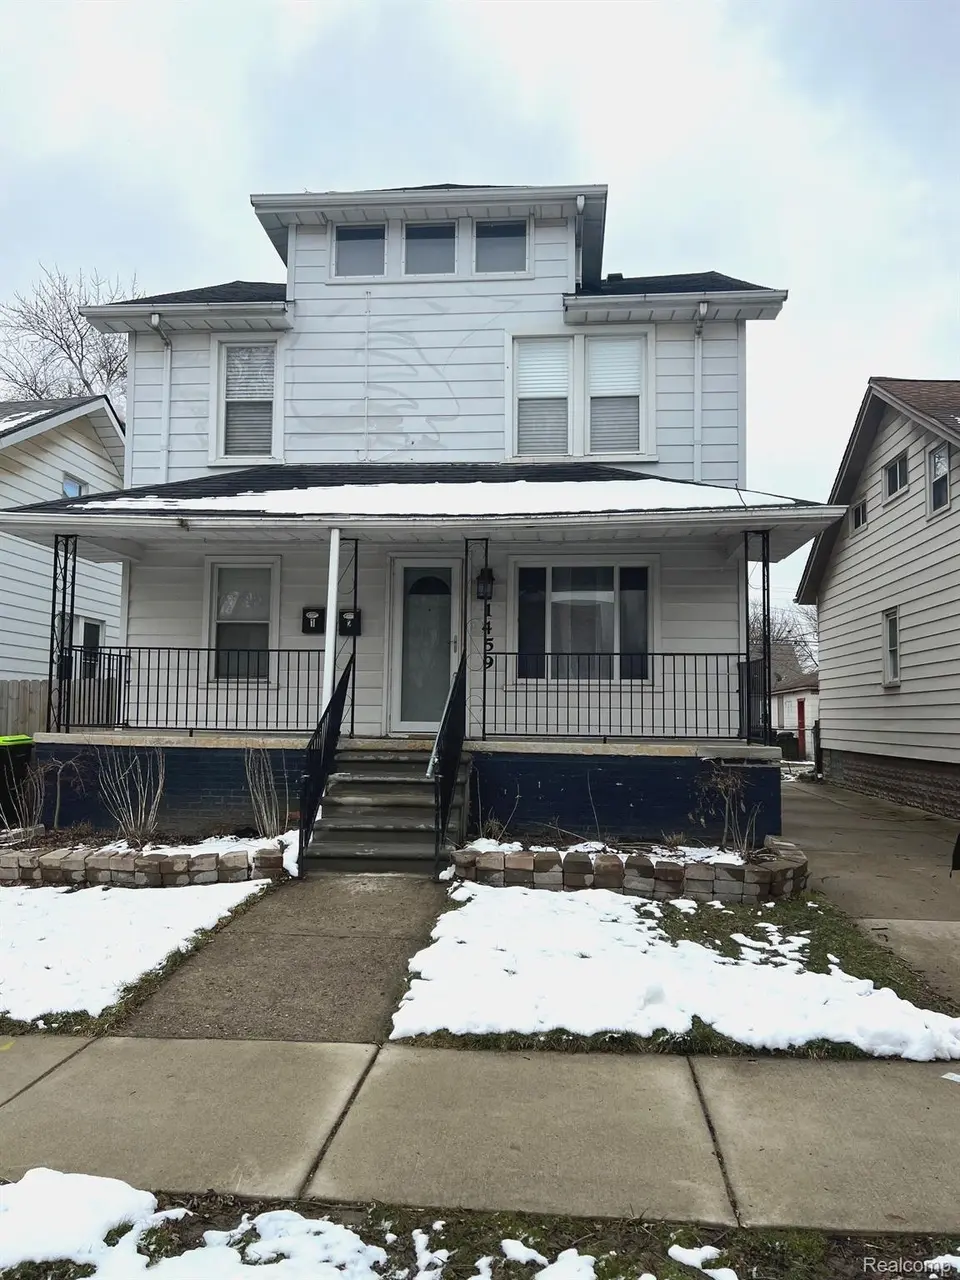
1459 Pingree Ave · Lincoln Park, MI
Flood risk 1/10 · Minimal
- FEMA flood zone
- X (unshaded)
- Chance of flooding over 30 yrs
- 0.0%
- Est. flood insurance / yr
- $473 – $860
Fire risk 1/10 · Minimal
- Est. fire insurance / yr
- $784 – $1,456
Heat risk 3/10 · Minor
- Hot days now (above 97°F)
- 7 days/yr
- Hot days in 30 yrs
- 15 days/yr
Wind risk 2/10 · Minimal
- Chance of severe wind over 30 yrs
- —
Air-quality risk 3/10 · Minor
- Unhealthy air days now
- 3 days/yr
- Unhealthy air days in 30 yrs
- 5 days/yr
Risk factors via First Street. Map © Google.
Why this score? — see what drove the D grade
The composite is a weighted blend of 9 inputs, each scored 0–100. Each bar is that input's sub-score; the figure is the points it added to the 100-point composite (weight × sub-score).
- Cash flow +16.2/30.0
- 1% rule +5.1/10.0
- DSCR +5.0/10.0
- Livability +4.0/5.0
- Rent growth +3.7/5.0
- ARV discount +3.6/15.0
- Condition / age +2.5/5.0
- Schools +2.0/10.0
- Appreciation +0.0/10.0
$167,000
🖨 Deal sheet (PDF) 📄 Offer letter ✓ Due diligence
Listing remarks
BEAUTIFUL REMODELED AND WELL KEPT DUPLEX IN A GREAT AREA OF LINCOLN PARK. 2 SPACIOUS UNITS WITH ACCESS TO FULL FINISHED BASEMENT AND LAUNDRY. THIS IS PERFECT FOR AN INVESTOR LOOKING TO ADD TO THEIR PORTFOLIO OR SOMEONE LOOKING TO HOUSE HACK! DONT MISS THIS OPPORTUNITY! SCHEDULE YOUR SHOWING TODAY!
Key facts
- 4,356 sq ft lot
- Garage
- Built 1926
Neighborhood map
What this means for you Summary
Snapshot
- This is a 4-bed/2.0-bath single-family listed at $167k.
Deal economics
- At list price, monthly cash flow is $88 ($1k/yr) — positive.
- The deal already cash-flows at list — no discount required.
- Meets the 1% rule at list price ($2k rent vs $167k).
Location & tenants
- Location reads 80/100 on livability (#82 in MI, #1,720 nationally) — a professional / high-income tenant draw. Strengths: amenities A+, commute A+, cost of living A+; Watch: schools D-, crime F, employment D-.
- Lincoln Park School District (suburban): math 15% / reading 32% proficiency, ranked #440 of 540 in MI (top 82%) — low school quality limits family demand, transient renter base, plan for 1-2y turnover; 72% free/reduced lunch — lower-income household profile, screen leases tightly.
- Market conditions: Rents rising fast (+4.7%/yr); 151 active listings in the ZIP; 7 comparable units currently listed for rent nearby; rentals leasing fast (median 5d on market — plan ~1-2 weeks tenant-placement turnaround); 2,639 units permitted in Wayne County in 2024 (1,216 in 5+ unit buildings).
- This rent runs 35% of the median local income ($59k/yr) — at the standard rent-burdened threshold; future hikes will face affordability resistance.
Forward outlook
- Local home prices are declining (-3.0%/yr); year-one equity from $1k of loan paydown is wiped out by about $5k of value loss. Plan a longer hold.
- Wayne County population projected at -17% by 2050 — secular population decline; favor cash flow + early exit over multi-decade hold.
Negotiation context
- Only 0 days on market — expect competitive offers; lowballing is unlikely to land.
- 6 sale attempts since 9y ago with the ask held roughly flat each time — persistent listings suggest the price (not the market) is what's stuck; bring a comps-based counter.
Risks & watch-outs
- Watch-outs: built in 1926 — expect roof / HVAC / electrical / plumbing capex.
Questions for the listing agent
- Built in 1926 — when were the roof, HVAC, electrical panel, plumbing, and water heater last replaced?
- Is there a deadline driving the sale (1031 exchange, divorce, estate, relocation)? That informs how much negotiation room exists.
- Schools are D-rated, which usually means shorter tenancies and higher turnover. Who's the typical renter profile here, and what's been the actual vacancy rate?
- Crime grade is F in this area — have there been break-ins, vandalism, or insurance claims at this property in the last 3 years? What carrier currently insures it and at what premium?
- The area grade is low — what's the realistic commute time and amenity access for the typical tenant pool here? Any planned neighborhood developments (good or bad) we should know about?
- What's the average days-on-market for RENTAL listings here right now (not sales)? A rising rental-DOM trend means longer vacancies and softer asking-rent achievability than the comps imply.
- What's the recent tenant-quality profile in this submarket — average credit score on applications, eviction rate, late-payment / NSF rate, and stable-employment percentage? A property-management company in the area should have these aggregated.
- How much new for-sale + rental construction is in the pipeline within 1–3 miles? Heavy new supply typically softens prices + rents 12–24 months out; constrained supply supports both.
Investment metrics
- 1% rule
- 1.01% ✓
- Cap rate
- 6.92%
- Cash-on-cash
- 2.25%
- DSCR
- 1.10
- GRM
- 8.3
CMA / ARV
- ARV (on-the-fly)
- $153,600
- Comps found
- 12
Show comp detail 12 sales within ~0.75 mi
| Address | Dist | Beds/Ba | Sqft | Sold | Price | $/sf | Match |
|---|---|---|---|---|---|---|---|
| 850 Montie Rd | 0.35mi | 3/1.5 (-1) | 1,536 (0%) | 2mo | $94,000 | $61 | 74 |
| 730 Cleophus Pkwy | 0.30mi | 3/3.0 (-1) | 1,500 (-2%) | 4mo | $162,000 | $108 | 70 |
| 864 Cleophus Pkwy | 0.39mi | 4/2.0 | 1,414 (-8%) | 2mo | $230,000 | $163 | 67 |
| 764 White Ave | 0.41mi | 3/2.0 (-1) | 1,632 (+6%) | 1mo | $185,000 | $113 | 64 |
| 4057 9th St | 0.67mi | 3/2.0 (-1) | 1,507 (-2%) | 1mo | $130,000 | $86 | 60 |
| 3990 17th St | 0.64mi | 5/2.0 (+1) | 1,503 (-2%) | 4mo | $125,000 | $83 | 58 |
| 4332 5th St | 0.59mi | 3/2.0 (-1) | 1,428 (-7%) | 2mo | $124,900 | $87 | 54 |
| 853 Mill St | 0.67mi | 3/1.0 (-1) | 1,531 (-0%) | 7mo | $143,500 | $94 | 54 |
| 615 Garfield Ave | 0.45mi | 3/1.0 (-1) | 1,696 (+10%) | 6mo | $169,900 | $100 | 48 |
| 1719 Ferris Ave | 0.47mi | 3/1.0 (-1) | 1,360 (-12%) | 4mo | $170,000 | $125 | 46 |
| 1055 Chandler Ave | 0.65mi | 3/1.0 (-1) | 1,383 (-10%) | 4mo | $172,500 | $125 | 41 |
| 869 Lincoln Ave | 0.58mi | 3/1.0 (-1) | 1,342 (-13%) | 4mo | $132,000 | $98 | 39 |
Match score weights: distance 35% · size 25% · config 20% · recency 20%. Top-matched comps best support the ARV.
Projected returns pro-forma
-3.0% appreciation · 4.65% rent growth · sell at horizon
- IRR
- -10.7%
- Equity multiple
- 0.60×
- Total profit
- $-18,555
- Equity at exit
- $24,900
- IRR
- 1.0%
- Equity multiple
- 1.07×
- Total profit
- $3,432
- Equity at exit
- $14,439
Cash invested: $46,760 (down + closing). Projections, not guarantees.
Landlord ↔ Tenant lean methodology
- Overall (STATE)
- 62 Landlord-Friendly
- State Michigan
- 62 Landlord-Friendly · EVEN
- County
- — inherits STATE
- City
- — inherits STATE
ZIP-level market 48146
- Home prices YoY
- -32.7%
- Rents YoY
- 4.7%
- Active inventory
- 151
- Price-to-rent
- 8.3×
Monthly cashflow live
- Estimated rent
- $1,686 high interval (Pro) →
- Mortgage (P&I)
- −$876
- Tax from tax record
- −$299 /mo · $3,588/yr
- Insurance
- −$70
- HOA
- −$0
- Vacancy / Maint / Mgmt
- −$354
- Net cashflow
- $88
Break-even live
Sensitivity live
| Price | -10% $182 | -5% $135 | +0% $88 | +5% $40 | +10% $-7 |
|---|---|---|---|---|---|
| Rent | -10% $-46 | -5% $21 | +0% $88 | +5% $154 | +10% $221 |
| Rate | -1.0pp $172 | -0.5pp $130 | base $88 | +0.5pp $44 | +1.0pp $0 |
UW: 25.0% down · 7.5% · 30yr · 1.5% tax · 5.0% vac · 8.0% maint · 8.0% mgmt
Financing live
Cash to close
- Down payment
- $41,750
- Closing costs
- $5,010
- Reserves months
- —
- Total cash needed
- —
Loan-product check · same deal, 3 products live
Conventional
25% down · 7.5% · 30yr
- Down + closing
- —
- Monthly P&I
- —
- Monthly cashflow
- —
- DSCR
- —
- Eligible?
- —
Personal DTI + credit; lowest rate.
DSCR
20% down · 8.5% · 30yr
- Down + closing
- —
- Monthly P&I
- —
- Monthly cashflow
- —
- DSCR
- —
- Eligible?
- —
No personal income docs; deal must DSCR.
Hard money
10% down · 12.0% · 12mo
- Down + closing
- —
- Monthly P&I
- —
- Monthly cashflow
- —
- DSCR
- —
- Eligible?
- —
Short-term bridge; refi at stabilization.
Rent comps 7 comps
| Address | Beds | Baths | Sqft | Rent | $/sqft | DOM | Units | Dist |
|---|---|---|---|---|---|---|---|---|
| 1473 Empire Ave Lincoln Park, MI | 3.0 | 2.0 | 1342 | $1,700 | $1.27 | 0d | 1 | 0.08mi |
| 4282 7th St Ecorse, MI | 3.0 | 1.0 | 1144 | $1,250 | $1.09 | 25d | 1 | 0.51mi |
| 4015 16th St Ecorse, MI | 3.0 | 1.5 | 1170 | $1,300 | $1.11 | 25d | 1 | 0.59mi |
| 4509 High St Ecorse, MI | 3.0 | 1.5 | 2250 | $1,700 | $0.76 | 0d | 1 | 0.96mi |
| 3801 18th St Ecorse, MI | 3.0 | 1.0 | 1196 | $1,150 | $0.96 | 18d | 1 | 1.02mi |
| 3804 18th St Unit F2 Ecorse, MI | 5.0 | 1.0 | 2160 | $1,665 | $0.77 | 4d | 1 | 1.02mi |
| 357 Emmons Blvd Lincoln Park, MI | 3.0 | 1.0 | 1268 | $1,695 | $1.34 | 0d | 1 | 1.16mi |
Listing history 28 events
-
2024-12-17status Pending
-
2023-07-13$167,000
-
2023-06-24status Pending
-
2023-06-24status Pending
-
2023-06-14soldstatus $159,000
-
2023-04-27historical
-
2023-04-27historical
-
2023-04-27historical
-
2023-04-27historical
-
2023-04-17historical Accepting Backup Offers
-
2023-04-17historical Accepting Backup Offers
-
2023-04-13price $167,000
-
2023-04-12price $167,000
-
2023-04-05price $170,000
-
2023-04-04price $170,000
-
2023-03-26$169,000 Active
-
2023-03-26$169,000 Active
-
2023-03-26$167,000
-
2018-01-30soldstatus $85,000
-
2017-12-21soldstatus $85,000 Sold
-
2017-12-21soldstatus $85,000 Closed
-
2017-11-09status Pending
-
2017-11-09status Pending
-
2017-09-22$85,000 Active
-
2017-09-22$85,000 Active
-
1995-07-14soldstatus $56,900
-
1993-01-29soldstatus $39,000
-
1992-10-28soldstatus $30,436
ⓘ Source: listings_history table (triggers on properties + properties_extension) + one-shot
backfill from property_details.listing_events for pre-trigger history.
Tax reassessment forecast MI · Partial reset (capped growth)
- Current annual tax
- $3,588 · $299/mo
- Projected year-2 tax
- $3,588 · $299/mo
- Expected delta
- $0/yr ($0/mo · 0.0%)
ⓘ Screening estimate from a state-policy table — verify with the county assessor before closing.
Climate risk First Street
- Flood 1/10 Low FEMA zone X (unshaded) · 0% chance over 30 yrs
- Wildfire 1/10 Low
- Heat 3/10 Moderate 7 d/yr ≥97°F today · 15 d/yr by 30 yrs out
- Wind 2/10 Low
- Air quality 3/10 Moderate 3 unhealthy d/yr today · 5 by 30 yrs out
Nearby sold comps map
Loading sold comps map…
Walkable amenities ~0.75 mi
Loading nearby amenities…
Taxation est. · year 1
- Rental income
- $20,233
- − Mortgage interest
- −$9,355
- − Property taxes
- −$3,588
- − Insurance
- −$835
- − Repairs & maintenance
- −$1,619
- − Management
- −$1,619
- − Depreciation
- −$4,858
- Taxable loss
- −$1,641
- Est. tax savings @ 24.0%
- +$394
- After-tax cash flow
- $1,445/yr
For passive investors: Depreciation is non-cash, so a rental often shows a tax loss while cash-flowing — sheltering income. Rental losses are passive: they offset passive income freely, and up to $25,000/yr can offset ordinary (W-2) income if you actively participate and your MAGI is under $100k (phasing out to $0 by $150k); unused losses carry forward. On sale, claimed depreciation is recaptured at up to 25%, and gains may owe capital-gains tax (a 1031 exchange can defer both). Figures are a year-1 estimate at your 24.0% rate — not tax advice; consult a CPA.
Schools (NCES district)
- District
- Lincoln Park School District
- NCES district ID
- 2621600
- Math proficiency
- 15% ▼ -5.00%
- Reading proficiency
- 32% ▬ 0.00%
- Median HH income
- $41,486
- Composite
- 19.93/100
- National rank
- #8678
- State rank
- #440 of 540 in MI
Livability — Lincoln Park
- Score
- 80/100
- State rank
- #82
- US rank
- #1720
Category grades
Schools grade is shown separately in the Schools card above.
Census & demographics
- Census place
- Lincoln Park, MI
- County
- Wayne County · 1,562,939 people
- City population
- 39,257
- Metro
- Detroit-Warren-Dearborn, MI
- Population (ZIP)
- 39,257
- Household income
- $58,616
- Rent vs Own
- Severe rent burden
- 1142.0
Population outlook (Wayne County) Hauer SSP2
- Today (2025)
- 1,675,273 people
- By 2030
- 1,620,300 · -3.3%
- By 2040
- 1,502,341 · -10.3%
- By 2050
- 1,384,039 · -17.4%
- By 2075
- 1,124,592 · -32.9%
- By 2100
- 881,193 · -47.4%
Race, ethnicity, and origin ACS 2023
- Neighborhood character
- Diverse neighborhood (Simpson 0.57)
- Race & ethnicity
- White 60% Hispanic / Latino 25% Two or more races 12% Black 9% Native American 1%
- Hispanic origin (detail)
- Mexican 19% Puerto Rican 3%
- Common ancestry
- Romanian 6% Lithuanian 4% Slovak 1%
- Foreign-born
- 9% · Canada
- Languages at home
- 80% English-only · Spanish 17% Arabic 2%
Political lean MEDSL · Wayne
- 2024 margin
- Strong D (+29.0) · D 62.7% · R 33.7% · Other 3.6%
- 2008→2024 swing
- -20.5pp toward R · 2008: 49.5pp · 2024: 29.0pp
- All cycles
- 2024: D+29.0 2020: D+38.1 2016: D+37.3 2012: D+46.9 2008: D+49.5
Not yet ingested
- Civics
- —
Market trends
- HPI YoY
- ▼ -108.25%
- Current HPI
- 222.8545
- Rent YoY
- ▲ 4.65%
- Metro
- Detroit-Warren-Dearborn, MI
- State GDP YoY
- ▲ 1.37%
- F500 in state
- 28
Industry mix (Fortune 500 HQ in MI)
| Industry | F500 HQs | Revenue |
|---|---|---|
| Automotive Parts | 3 | $48B |
|
||
| Automotive | 2 | $372B |
|
||
| Chemicals | 1 | $45B |
|
||
| Automotive Retail | 1 | $29B |
|
||
| Healthcare / Medical Devices | 1 | $23B |
|
||
| Automotive Technology | 1 | $20B |
|
||
Price history
+448.7% since first listed28 events — show timeline
- 2024-12-17 Pending — REALCOMP
- 2023-07-13 Listed $167,000 REALCOMP
- 2023-06-24 Pending — MiRealSource-MiMLS
- 2023-06-24 Pending — REALCOMP
- 2023-06-14 Sold (Public Records) $159,000 Public Records
- 2023-04-27 Listing Removed — MiRealSource-MiMLS
- 2023-04-27 Listing Removed — MiRealSource-MiMLS
- 2023-04-27 Listing Removed — REALCOMP
- 2023-04-27 Listing Removed — REALCOMP
- 2023-04-17 Contingent — MiRealSource-MiMLS
- 2023-04-17 Contingent — REALCOMP
- 2023-04-13 Price Changed $167,000 MiRealSource-MiMLS
- 2023-04-12 Price Changed $167,000 REALCOMP
- 2023-04-05 Price Changed $170,000 MiRealSource-MiMLS
- 2023-04-04 Price Changed $170,000 REALCOMP
- 2023-03-26 Listed $167,000 MiRealSource-MiMLS
- 2023-03-26 Listed $169,000 MiRealSource-MiMLS
- 2023-03-26 Listed $169,000 REALCOMP
- 2018-01-30 Sold (Public Records) $85,000 Public Records
- 2017-12-21 Sold (MLS) $85,000 MiRealSource-MiMLS
- 2017-12-21 Sold (MLS) $85,000 REALCOMP
- 2017-11-09 Pending — MiRealSource-MiMLS
- 2017-11-09 Pending — REALCOMP
- 2017-09-22 Listed $85,000 MiRealSource-MiMLS
- 2017-09-22 Listed $85,000 REALCOMP
- 1995-07-14 Sold (Public Records) $56,900 Public Records
- 1993-01-29 Sold (Public Records) $39,000 Public Records
- 1992-10-28 Sold (Public Records) $30,436 Public Records
Property tax history
+6.0%/yrLatest (2025): $3,588 · -1.9% YoY. Source: county tax records.
Cash-flow waterfall
monthlySold comps — $/sqft
last 12 mo · ≤1 miLoading sold comps…