 Duplex
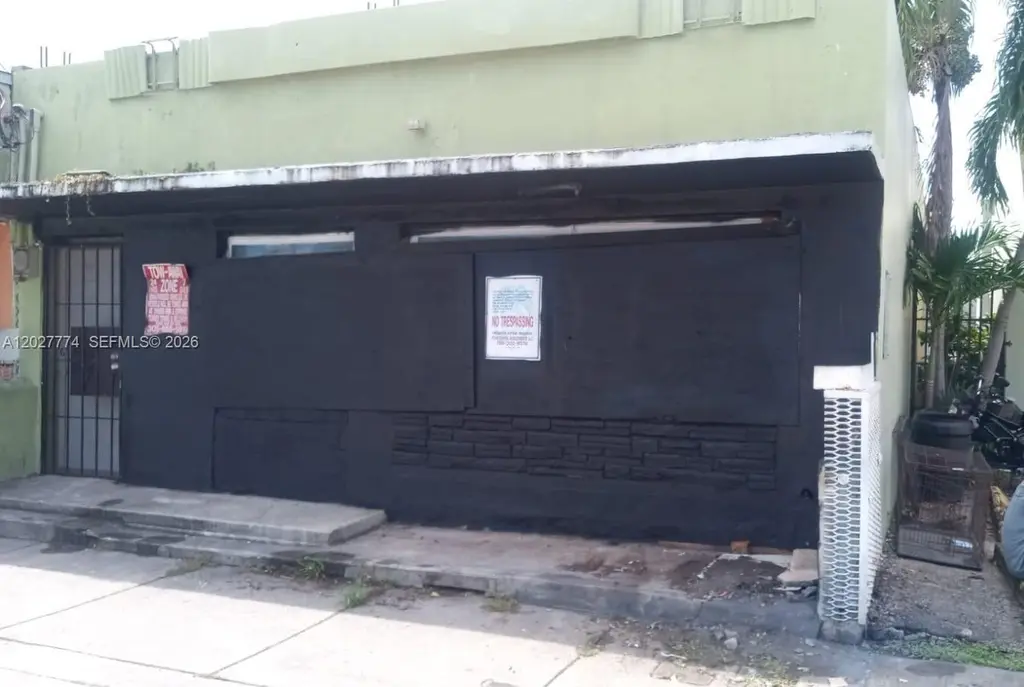
6930 NW 15th Ave · Miami, FL
Flood risk No data
- FEMA flood zone
- —
- Chance of flooding over 30 yrs
- —
- Est. flood insurance / yr
- —
Fire risk No data
- Est. fire insurance / yr
- —
Heat risk No data
- Hot days now (above threshold)
- —
- Hot days in 30 yrs
- —
Wind risk No data
- Chance of severe wind over 30 yrs
- —
Air-quality risk No data
- Unhealthy air days now
- —
- Unhealthy air days in 30 yrs
- —
Risk factors via First Street. Map © Google.
Why this score? — see what drove the B- grade
The composite is a weighted blend of 9 inputs, each scored 0–100. Each bar is that input's sub-score; the figure is the points it added to the 100-point composite (weight × sub-score).
- Cash flow +30.0/30.0
- 1% rule +10.0/10.0
- DSCR +10.0/10.0
- ARV discount +7.5/15.0
- Schools +4.2/10.0
- Livability +3.9/5.0
- Rent growth +2.3/5.0
- Condition / age +1.0/5.0
- Appreciation +0.0/10.0
$200,000
🖨 Deal sheet (PDF) 📄 Offer letter ✓ Due diligence
Multi-family units
County records classify this as Multi-Family (2-4 Unit). Listing-text estimate: 2 units. confirmed
Listing remarks
"VACANT LIBERTY CITY DUPLEX – POSSIBLE 8-UNIT DEVELOPMENT SITE Legal duplex in Liberty City. Front unit: 3BR/2BA + office. Rear unit: 1BR/1BA. Approx. 1,687 SF building on 2,500 SF lot. No liens, code fines, or demolition orders. Due diligence documents and contractor estimate available. Property sold AS-IS. Cash only. Buyer assumes expired/open permits. 5-day inspection period. Excellent value-add or redevelopment opportunity. T4-O zoning allows mixed-use development and may qualify for up to 8 units under Live Local (buyer to verify). Offered at $200,000. Property sold AS-IS. Cash buyers only. Buyer to assume any expired/open permits. 5-day inspection period.
Key facts
- Legal duplex
- T4 o zoning
- Built 1948
Tags
Property features AI
Finance
- Financial info: Multifamily: two units (one 3-bed/2-bath renting for $1,150; one 1-bed/1-bath renting for $500)
Exterior
- Parking: On-street parking available; One unit lists a den
- Utilities: Public sewer; Cable not available
- Home design: Single-story property; Block construction; Effective year built reported
- Construction: Block construction
- Exterior features: Less than quarter acre lot
Interior
- Bedrooms: One unit with 3 bedrooms; One unit with 1 bedroom
- Flooring: Ceramic tile
- Bathrooms: One unit with 2 full bathrooms; One unit with 1 full bathroom
- Interior features: Ceramic tile flooring
Neighborhood map
What this means for you Summary
Snapshot
- This is a 2 × 3.0-bed/2.0-bath units multifamily listed at $200k. Condition is rated poor.
Deal economics
- At list price, monthly cash flow is $3k ($33k/yr) — positive. Per door: $1k/mo.
- The deal already cash-flows at list — no discount required.
- Meets the 1% rule at list price ($5k rent vs $200k).
- Recommended offer: $197k (1.5% below list) — sets the bar for market timing.
- Cap rate 22.7% vs local median 1.9% in Miami — top-decile yield for the area; either an underpriced asset or a hidden risk that comps aren't pricing in. Stress-test before assuming the spread holds.
Location & tenants
- Location reads 78/100 on livability (#177 in FL, #2,724 nationally) — a middle-class / working-renter tenant base. Strengths: amenities A+, commute A+, health & safety A+; Watch: employment C-, crime F, cost of living F.
- Miami-Dade (suburban): math 45% / reading 54% proficiency, ranked #40 of 73 in FL (top 55%) — families likely to look elsewhere, expect single-tenant / working-renter base with shorter leases; 64% free/reduced lunch — lower-income household profile, screen leases tightly.
- Market conditions: Rents soft (-0.7%/yr); 230 active listings in the ZIP; 10,051 units permitted in Miami-Dade County in 2024 (7,758 in 5+ unit buildings).
- At $5,220/mo this rent would consume 124% of the median local household income ($51k/yr) (locally 2419% of renters already pay >50% of income on rent) — very limited rent-growth headroom before tenants either downsize or default.
Forward outlook
- Local home prices are declining (-3.0%/yr); year-one equity from $1k of loan paydown is wiped out by about $6k of value loss. Plan a longer hold.
- Miami-Dade County population projected at +28% by 2050 — long-run rental-demand tailwind backs the buy-and-hold thesis.
- At projected returns (-3.0% appreciation + 0.0% rent growth), your $56k cash investment doubles in ~2 years — after that, you're playing with house money.
Negotiation context
- It's been on market 20 days — a 2% lower offer ($197k) is reasonable based on typical stale-listing flexibility.
- 6 sale attempts since 3y ago with the ask held roughly flat each time — persistent listings suggest the price (not the market) is what's stuck; bring a comps-based counter.
Risks & watch-outs
- Watch-outs: built in 1948 — expect roof / HVAC / electrical / plumbing capex.
Questions for the listing agent
- Can we see the unit-by-unit rent roll, current vacancy, and any below-market leases? What's the average tenancy length?
- What capital expenditures (roof, boiler, parking lot, exteriors) have been made in the last 5 years, and what's planned in the next 2?
- Have any recent inspections been done? Can we get a copy of the seller's disclosures and any deferred-maintenance estimates?
- Built in 1948 — when were the roof, HVAC, electrical panel, plumbing, and water heater last replaced?
- Is there a deadline driving the sale (1031 exchange, divorce, estate, relocation)? That informs how much negotiation room exists.
- Schools are B-rated — typically a magnet for longer-tenancy family renters. What's the average tenant stay here, and is there a school-zone premium baked into asking?
- Crime grade is F in this area — have there been break-ins, vandalism, or insurance claims at this property in the last 3 years? What carrier currently insures it and at what premium?
- What's the average days-on-market for RENTAL listings here right now (not sales)? A rising rental-DOM trend means longer vacancies and softer asking-rent achievability than the comps imply.
- What's the recent tenant-quality profile in this submarket — average credit score on applications, eviction rate, late-payment / NSF rate, and stable-employment percentage? A property-management company in the area should have these aggregated.
- How much new apartment / multifamily construction is in the pipeline within 1–3 miles? Heavy new supply (>2% of stock underway) typically softens rents 12–24 months out; light construction supports rent growth.
Investment metrics
- 1% rule
- 2.61% ✓
- Cap rate
- 22.74%
- Cash-on-cash
- 58.75%
- DSCR
- 3.61
- GRM
- 3.2
CMA / ARV
No comps found within radius.
Projected returns pro-forma
-3.0% appreciation · 0.0% rent growth · sell at horizon
- IRR
- 53.9%
- Equity multiple
- 3.27×
- Total profit
- $126,989
- Equity at exit
- $29,821
- IRR
- 57.9%
- Equity multiple
- 5.94×
- Total profit
- $276,627
- Equity at exit
- $17,292
Cash invested: $56,000 (down + closing). Projections, not guarantees.
Landlord ↔ Tenant lean methodology
- Overall (STATE)
- 87 Strongly Landlord-Friendly
- State Florida
- 87 Strongly Landlord-Friendly · R+3
- County
- — inherits STATE
- City
- — inherits STATE
ZIP-level market 33147
- Home prices YoY
- -30.9%
- Rents YoY
- -0.7%
- Active inventory
- 230
- Price-to-rent
- 6.4×
Monthly cashflow live
- Estimated rent
- $5,220 medium interval (Pro) →
- Mortgage (P&I)
- −$1,049
- Tax est. 1.5%
- −$250 /mo · $3,000/yr
- Insurance
- −$83
- HOA
- −$0
- Vacancy / Maint / Mgmt
- −$1,096
- Net cashflow
- $2,742
Break-even live
Sensitivity live
| Price | -10% $2,880 | -5% $2,811 | +0% $2,742 | +5% $2,673 | +10% $2,603 |
|---|---|---|---|---|---|
| Rent | -10% $2,329 | -5% $2,535 | +0% $2,742 | +5% $2,948 | +10% $3,154 |
| Rate | -1.0pp $2,842 | -0.5pp $2,793 | base $2,742 | +0.5pp $2,690 | +1.0pp $2,637 |
2-unit breakdown (identical units grouped — click to expand)
| Units | Beds | Baths | Est. rent |
|---|---|---|---|
| 2× units | 3.0 | 2 | $5,220 |
| #1 | 3.0 | 2 | $2,610 |
| #2 | 3.0 | 2 | $2,610 |
| Total (2 units) | $5,220 | ||
UW: 25.0% down · 7.5% · 30yr · 1.5% tax · 5.0% vac · 8.0% maint · 8.0% mgmt
Financing live
Cash to close
- Down payment
- $50,000
- Closing costs
- $6,000
- Reserves months
- —
- Total cash needed
- —
Loan-product check · same deal, 3 products live
Conventional
25% down · 7.5% · 30yr
- Down + closing
- —
- Monthly P&I
- —
- Monthly cashflow
- —
- DSCR
- —
- Eligible?
- —
Personal DTI + credit; lowest rate.
DSCR
20% down · 8.5% · 30yr
- Down + closing
- —
- Monthly P&I
- —
- Monthly cashflow
- —
- DSCR
- —
- Eligible?
- —
No personal income docs; deal must DSCR.
Hard money
10% down · 12.0% · 12mo
- Down + closing
- —
- Monthly P&I
- —
- Monthly cashflow
- —
- DSCR
- —
- Eligible?
- —
Short-term bridge; refi at stabilization.
Listing history 13 events
-
2026-06-21days on market $200,000 Active 20 DOM
-
2026-06-18days on market $200,000 Active 17 DOM
-
2026-06-17days on market $200,000 Active 16 DOM
-
2026-06-16days on market $200,000 Active 15 DOM
-
2026-06-15days on market $200,000 Active 14 DOM
-
2026-06-13days on market $200,000 Active 12 DOM
-
2026-06-09days on market $200,000 Active 8 DOM
-
2026-06-08days on market $200,000 Active 7 DOM
-
2026-06-07days on market $200,000 Active 6 DOM
-
2026-06-04days on market $200,000 Active 3 DOM
-
2026-06-03days on market $200,000 Active 2 DOM
-
2026-06-02remarks 669-char remark
-
2026-06-02$200,000 Active 1 DOM
ⓘ Source: listings_history table (triggers on properties + properties_extension) + one-shot
backfill from property_details.listing_events for pre-trigger history.
Nearby sold comps map
Loading sold comps map…
Walkable amenities ~0.75 mi
Loading nearby amenities…
Taxation est. · year 1
- Rental income
- $62,640
- − Mortgage interest
- −$11,203
- − Property taxes
- −$3,000
- − Insurance
- −$1,000
- − Repairs & maintenance
- −$5,011
- − Management
- −$5,011
- − Depreciation
- −$5,818
- Taxable income
- $31,596
- Est. tax owed @ 24.0%
- −$7,583
- After-tax cash flow
- $25,317/yr
For passive investors: Depreciation is non-cash, so a rental often shows a tax loss while cash-flowing — sheltering income. Rental losses are passive: they offset passive income freely, and up to $25,000/yr can offset ordinary (W-2) income if you actively participate and your MAGI is under $100k (phasing out to $0 by $150k); unused losses carry forward. On sale, claimed depreciation is recaptured at up to 25%, and gains may owe capital-gains tax (a 1031 exchange can defer both). Figures are a year-1 estimate at your 24.0% rate — not tax advice; consult a CPA.
Condition & rehab AI · 13 photos
This property requires extensive repairs and renovations to bring it up to a livable condition. Significant structural and exterior work is needed, along with updates to the interior and HVAC systems. Potential buyers should be aware of the extensive work required.
Repairs flagged
- Major Kitchen cabinets — The cabinets are unfinished and in need of complete replacement.
- Major Bathroom fixtures — The fixtures are outdated and need to be replaced.
- Major Roof repair — The roof shows significant damage and needs to be replaced.
- Major Exterior siding repair — The siding is peeling and needs to be replaced or repaired.
- Major Windows repair — The windows are damaged and need to be replaced.
- Major HVAC and mechanical systems — The systems are outdated and need to be replaced or repaired.
Value-add opportunities
- Resale Kitchen renovation — A modern kitchen will attract more buyers and increase the property's value.
- Resale Bathroom renovation — Upgraded bathrooms will appeal to potential buyers and increase the property's value.
- Both Exterior siding and roof repair — These repairs will improve the property's curb appeal and increase its value.
- Both HVAC and mechanical systems replacement — Modern systems will improve the property's functionality and increase its value.
Renovation cost estimate screening
| Repair item | Severity | Est. cost |
|---|---|---|
| Kitchen cabinets · The cabinets are unfinished and in need of complete replacement. | Major | $15,000–50,000 |
| Bathroom fixtures · The fixtures are outdated and need to be replaced. | Major | $15,000–50,000 |
| Roof repair · The roof shows significant damage and needs to be replaced. | Major | $15,000–50,000 |
| Exterior siding repair · The siding is peeling and needs to be replaced or repaired. | Major | $15,000–50,000 |
| Windows repair · The windows are damaged and need to be replaced. | Major | $15,000–50,000 |
| HVAC and mechanical systems · The systems are outdated and need to be replaced or repaired. | Major | $15,000–50,000 |
| Total estimated repair cost · 6 items | $90,000–300,000 |
Value-add ROI direction
- Resale Kitchen renovation — A modern kitchen will attract more buyers and increase the property's value. ↑
- Resale Bathroom renovation — Upgraded bathrooms will appeal to potential buyers and increase the property's value. ↑
- Both Exterior siding and roof repair — These repairs will improve the property's curb appeal and increase its value. ↑
- Both HVAC and mechanical systems replacement — Modern systems will improve the property's functionality and increase its value. ↑
ⓘ Cost ranges are severity-bucket heuristics (US national rule-of-thumb). Get contractor quotes + a written scope before underwriting a rehab budget.
Schools (NCES district)
- District
- Miami-Dade
- NCES district ID
- 1200390
- Math proficiency
- 45% ▼ -16.00%
- Reading proficiency
- 54% ▼ -5.00%
- Median HH income
- $43,928
- Composite
- 41.76/100
- National rank
- #3397
- State rank
- #40 of 73 in FL
Livability — Miami
- Score
- 78/100
- State rank
- #177
- US rank
- #2724
Category grades
Schools grade is shown separately in the Schools card above.
Census & demographics
- Census place
- Miami, FL
- County
- Miami-Dade County · 2,697,751 people
- City population
- 827,308
- Metro
- Miami-Fort Lauderdale-Pompano Beach, FL
- Population (ZIP)
- 50,419
- Household income
- $50,704
- Rent vs Own
- Severe rent burden
- 2419.0
Population outlook (Miami-Dade County) Hauer SSP2
- Today (2025)
- 3,126,439 people
- By 2030
- 3,325,765 · +6.4%
- By 2040
- 3,697,561 · +18.3%
- By 2050
- 4,012,134 · +28.3%
- By 2075
- 4,605,612 · +47.3%
- By 2100
- 4,866,598 · +55.7%
Race, ethnicity, and origin ACS 2023
- Neighborhood character
- Majority Hispanic (52%)
- Race & ethnicity
- Hispanic / Latino 52% Black 46% Two or more races 22% White 1%
- Hispanic origin (detail)
- Puerto Rican 3% Cuban 24% Dominican 4%
- Common ancestry
- Hispanic 5%
- Foreign-born
- 39% · Canada, Jamaica, Dominican Republic
- Languages at home
- 45% English-only · Spanish 50% French/Haitian/Cajun 5%
Political lean MEDSL · Miami-Dade
- 2024 margin
- R (+11.4) · D 43.9% · R 55.4%
- 2008→2024 swing
- -27.6pp toward R · 2008: 16.1pp · 2024: -11.4pp
- All cycles
- 2024: R+11.4 2020: D+7.3 2016: D+29.6 2012: D+23.7 2008: D+16.1
Not yet ingested
- Civics
- —
Market trends
- HPI YoY
- ▼ -286.84%
- Current HPI
- 642.2677
- Rent YoY
- ▼ -0.71%
- Metro
- Miami-Fort Lauderdale-Pompano Beach, FL
- State GDP YoY
- ▲ 3.28%
- F500 in state
- 36
Industry mix (Fortune 500 HQ in FL)
| Industry | F500 HQs | Revenue |
|---|---|---|
| Industrial Technology | 2 | $29B |
|
||
| Insurance | 2 | $17B |
|
||
| Retail | 1 | $60B |
|
||
| Technology Distribution | 1 | $58B |
|
||
| Homebuilding | 1 | $35B |
|
||
| Technology Manufacturing | 1 | $35B |
|
||
Price history
-49.4% since first listed19 events — show timeline
- 2026-05-29 Listed $200,000 MARMLS
- 2025-07-03 Pending — MARMLS
- 2025-07-03 Listing Removed — MARMLS
- 2025-06-24 Price Changed $230,000 MARMLS
- 2025-06-24 Relisted — MARMLS
- 2025-06-18 Pending — MARMLS
- 2025-05-14 Price Changed $290,000 MARMLS
- 2025-01-28 Relisted — MARMLS
- 2025-01-27 Relisted — MARMLS
- 2025-01-27 Price Changed $350,000 MARMLS
- 2025-01-27 Listing Removed — MARMLS
- 2025-01-20 Listing Removed — MARMLS
- 2024-08-06 Price Changed $379,000 MARMLS
- 2024-07-31 Price Changed $385,000 MARMLS
- 2024-03-06 Price Changed $395,000 MARMLS
- 2024-03-06 Listed $200,000 MARMLS
- 2023-12-29 Listing Removed — MARMLS
- 2023-09-29 Price Changed $420,000 MARMLS
- 2023-09-13 Listed $395,000 MARMLS
Cash-flow waterfall
monthlySold comps — $/sqft
last 12 mo · ≤1 miLoading sold comps…