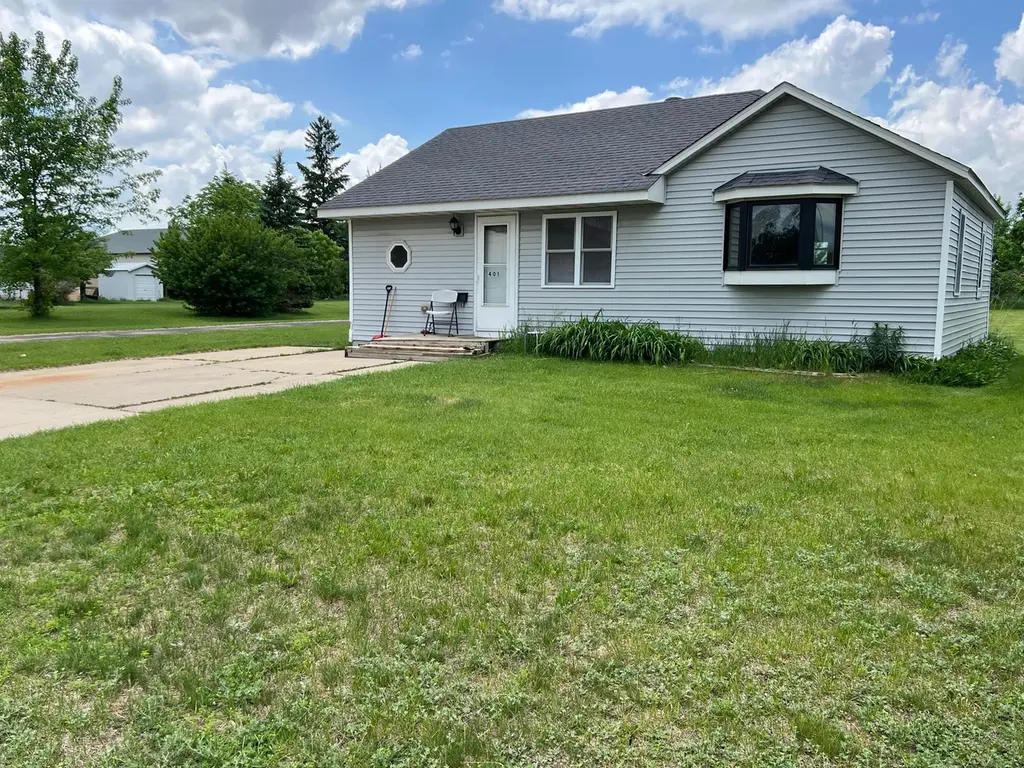
401 4th St NW · Wadena, MN
Flood risk 1/10 · Minimal
- FEMA flood zone
- X
- Chance of flooding over 30 yrs
- 0.0%
- Est. flood insurance / yr
- $473 – $860
Fire risk 4/10 · Minor
- Est. fire insurance / yr
- $888 – $1,650
Heat risk 2/10 · Minimal
- Hot days now (above 95°F)
- 7 days/yr
- Hot days in 30 yrs
- 12 days/yr
Wind risk 1/10 · Minimal
- Chance of severe wind over 30 yrs
- —
Air-quality risk 3/10 · Minor
- Unhealthy air days now
- 2 days/yr
- Unhealthy air days in 30 yrs
- 3 days/yr
Risk factors via First Street. Map © Google.
Why this score? — see what drove the C grade
The composite is a weighted blend of 9 inputs, each scored 0–100. Each bar is that input's sub-score; the figure is the points it added to the 100-point composite (weight × sub-score).
- Cash flow +23.1/30.0
- ARV discount +7.5/15.0
- DSCR +7.4/10.0
- 1% rule +5.6/10.0
- Livability +3.4/5.0
- Schools +3.3/10.0
- Rent growth +2.5/5.0
- Condition / age +2.5/5.0
- Appreciation +0.0/10.0
$79,900
🖨 Deal sheet (PDF) 📄 Offer letter ✓ Due diligence
Listing remarks
BACK ON THE MARKET!! Smaller home in NW Wadena. Roof, siding, windows, flooring, bath, some electric done after tornado of 2010. Great starter or rental property.
Key facts
- 7,492 sq ft lot
- Built 1930
- Listed 17 days
Property features AI
Finance
- Other: Property type: Residential; Lot approx. 0.172 acres (dimensions 50 x 150); Publicly maintained city street with curbs, paved surface and street lights; No pool; Other detached structure on site
- Financial info: Conventional financing available
Exterior
- Parking: Driveway with non-standard surface
- Utilities: City water connected; City sewer connected; Natural gas fuel; Electric service
- Home design: Residential property; One story; Main-level living
- Construction: Frame construction; Asphalt roof; Block foundation; Built-on/block foundation dimensions approx. 24 x 34
- Exterior features: Vinyl exterior; Enclosed rear porch; Rear porch
Interior
- Kitchen: Range; Refrigerator; Electric water heater
- Bedrooms: 1 bedroom on the main level (approx. 9.3 x 13.3)
- Bathrooms: 1 three-quarter bathroom
- Heating & cooling: Forced air heating; Window air conditioning unit(s)
- Interior features: Informal dining area; Enclosed rear porch
- Laundry & utility: Washer; Dryer (laundry in basement)
Neighborhood map
What this means for you Summary
Snapshot
- This is a 1-bed/1.0-bath single-family listed at $80k.
Deal economics
- At list price, monthly cash flow is $143 ($2k/yr) — positive.
- The deal already cash-flows at list — no discount required.
- Meets the 1% rule at list price ($844 rent vs $80k).
- Recommended offer: $79k (1.5% below list) — sets the bar for market timing.
- Cap rate 8.4% vs local median 3.3% in Wadena — top-decile yield for the area; either an underpriced asset or a hidden risk that comps aren't pricing in. Stress-test before assuming the spread holds.
Location & tenants
- Location reads 67/100 on livability (#433 in MN) — a middle-class / working-renter tenant base. Strengths: cost of living A+, housing A+, crime A; Watch: health & safety C-, amenities F, commute F.
- Wadena-Deer Creek School District (town): math 33% / reading 45% proficiency, ranked #235 of 301 in MN (top 78%) — families likely to look elsewhere, expect single-tenant / working-renter base with shorter leases.
- Zoned schools: Wadena-Deer Creek Elementary (math 42% / reading 32%, grade F, #636 of 857 statewide, top 76%, 449 students, 62% FRL); Wadena-Deer Creek 5Th And 6Th Grade (math 27% / reading 57%, grade D-, #131 of 258 statewide, top 53%, 170 students, 58% FRL); Wadena-Deer Creek Senior High (math 32% / reading 47%, grade F, #246 of 471 statewide, top 59%, 469 students, 50% FRL) — zoned schools average 57% FRL vs 40% district-wide (16 pts higher); higher-poverty schools than district average — tighter screening recommended.
- Market conditions: 50 active listings in the ZIP; 52 units permitted in Wadena County in 2024 (0 in 5+ unit buildings).
Forward outlook
- Local home prices are declining (-3.0%/yr); year-one equity from $552 of loan paydown is wiped out by about $2k of value loss. Plan a longer hold.
- Wadena County population projected to shrink 6% by 2050 — rents likely to lag national; underwrite the cash flow, not the appreciation.
Negotiation context
- It's been on market 17 days — a 2% lower offer ($79k) is reasonable based on typical stale-listing flexibility.
- 2 sale attempts; this cycle's ask has dropped $14k (15%) from the opening price — seller is motivated, your offer sets the floor, not the list.
- Current owner paid $34k; list at $80k implies a 133% gain — meaningful room to come down on a strong offer.
Risks & watch-outs
- Watch-outs: built in 1930 — expect roof / HVAC / electrical / plumbing capex.
Questions for the listing agent
- Built in 1930 — when were the roof, HVAC, electrical panel, plumbing, and water heater last replaced?
- Is there a deadline driving the sale (1031 exchange, divorce, estate, relocation)? That informs how much negotiation room exists.
- Schools are D-rated, which usually means shorter tenancies and higher turnover. Who's the typical renter profile here, and what's been the actual vacancy rate?
- What's the average days-on-market for RENTAL listings here right now (not sales)? A rising rental-DOM trend means longer vacancies and softer asking-rent achievability than the comps imply.
- What's the recent tenant-quality profile in this submarket — average credit score on applications, eviction rate, late-payment / NSF rate, and stable-employment percentage? A property-management company in the area should have these aggregated.
- How much new for-sale + rental construction is in the pipeline within 1–3 miles? Heavy new supply typically softens prices + rents 12–24 months out; constrained supply supports both.
Investment metrics
- 1% rule
- 1.06% ✓
- Cap rate
- 8.44%
- Cash-on-cash
- 7.66%
- DSCR
- 1.34
- GRM
- 7.9
CMA / ARV
No comps found within radius.
Projected returns pro-forma
-3.0% appreciation · 3.0% rent growth · sell at horizon
- IRR
- -4.6%
- Equity multiple
- 0.83×
- Total profit
- $-3,855
- Equity at exit
- $11,913
- IRR
- 5.1%
- Equity multiple
- 1.37×
- Total profit
- $8,339
- Equity at exit
- $6,908
Cash invested: $22,372 (down + closing). Projections, not guarantees.
Landlord ↔ Tenant lean methodology
- Overall (STATE)
- 46 Balanced
- State Minnesota
- 46 Balanced · D+2
- County
- — inherits STATE
- City
- — inherits STATE
ZIP-level market 56482
- Home prices YoY
- -7.6%
- Active inventory
- 50
- Price-to-rent
- 7.9×
Monthly cashflow live
- Estimated rent
- $844 medium interval (Pro) →
- Mortgage (P&I)
- −$419
- Tax from tax record
- −$72 /mo · $858/yr
- Insurance
- −$33
- HOA
- −$0
- Vacancy / Maint / Mgmt
- −$177
- Net cashflow
- $143
Break-even live
Sensitivity live
| Price | -10% $188 | -5% $165 | +0% $143 | +5% $120 | +10% $98 |
|---|---|---|---|---|---|
| Rent | -10% $76 | -5% $110 | +0% $143 | +5% $176 | +10% $210 |
| Rate | -1.0pp $183 | -0.5pp $163 | base $143 | +0.5pp $122 | +1.0pp $101 |
UW: 25.0% down · 7.5% · 30yr · 1.5% tax · 5.0% vac · 8.0% maint · 8.0% mgmt
Financing live
Cash to close
- Down payment
- $19,975
- Closing costs
- $2,397
- Reserves months
- —
- Total cash needed
- —
Loan-product check · same deal, 3 products live
Conventional
25% down · 7.5% · 30yr
- Down + closing
- —
- Monthly P&I
- —
- Monthly cashflow
- —
- DSCR
- —
- Eligible?
- —
Personal DTI + credit; lowest rate.
DSCR
20% down · 8.5% · 30yr
- Down + closing
- —
- Monthly P&I
- —
- Monthly cashflow
- —
- DSCR
- —
- Eligible?
- —
No personal income docs; deal must DSCR.
Hard money
10% down · 12.0% · 12mo
- Down + closing
- —
- Monthly P&I
- —
- Monthly cashflow
- —
- DSCR
- —
- Eligible?
- —
Short-term bridge; refi at stabilization.
Listing history 26 events
-
2026-06-21days on market $79,900 Active 17 DOM
-
2026-06-21days on market $79,900 Active 16 DOM
-
2026-06-18days on market $79,900 Active 14 DOM
-
2026-06-17days on market $79,900 Active 13 DOM
-
2026-06-16days on market $79,900 Active 12 DOM
-
2026-06-15days on market $79,900 Active 11 DOM
-
2026-06-13days on market $79,900 Active 9 DOM
-
2026-06-12days on market $79,900 Active 8 DOM
-
2026-06-09days on market $79,900 Active 5 DOM
-
2026-06-08days on market $79,900 Active 4 DOM
-
2026-06-07days on market $79,900 Active 3 DOM
-
2026-06-07days on market $79,900 Active 2 DOM
-
2026-06-04days on market $79,900 Active 148 DOM
-
2026-06-02days on market $79,900 Active 147 DOM
-
2026-06-01days on market $79,900 Active 146 DOM
-
2026-05-31days on market $79,900 Active 145 DOM
-
2026-05-31days on market $79,900 Active 144 DOM
-
2026-05-27status Active
-
2026-05-27historical Contingent - Subject to Financing
-
2026-05-09historical
-
2026-05-01historical Contingent - Subject to Financing
-
2026-04-29historical
-
2026-02-18historical Contingent - Subject to Financing
-
2026-02-16price $79,900
-
2025-12-17$93,600 Active
-
2006-08-01soldstatus $34,265
ⓘ Source: listings_history table (triggers on properties + properties_extension) + one-shot
backfill from property_details.listing_events for pre-trigger history.
Tax reassessment forecast MN · Partial reset (capped growth)
- Current annual tax
- $858 · $72/mo
- Projected year-2 tax
- $876 · $73/mo
- Expected delta
- +$18/yr (+$2/mo · 2.1%)
ⓘ Screening estimate from a state-policy table — verify with the county assessor before closing.
Climate risk First Street
- Flood 1/10 Low FEMA zone X · 0% chance over 30 yrs
- Wildfire 4/10 Moderate
- Heat 2/10 Low 7 d/yr ≥95°F today · 12 d/yr by 30 yrs out
- Wind 1/10 Low
- Air quality 3/10 Moderate 2 unhealthy d/yr today · 3 by 30 yrs out
Nearby sold comps map
Loading sold comps map…
Walkable amenities ~0.75 mi
Loading nearby amenities…
Taxation est. · year 1
- Rental income
- $10,126
- − Mortgage interest
- −$4,476
- − Property taxes
- −$858
- − Insurance
- −$400
- − Repairs & maintenance
- −$810
- − Management
- −$810
- − Depreciation
- −$2,324
- Taxable income
- $448
- Est. tax owed @ 24.0%
- −$108
- After-tax cash flow
- $1,606/yr
For passive investors: Depreciation is non-cash, so a rental often shows a tax loss while cash-flowing — sheltering income. Rental losses are passive: they offset passive income freely, and up to $25,000/yr can offset ordinary (W-2) income if you actively participate and your MAGI is under $100k (phasing out to $0 by $150k); unused losses carry forward. On sale, claimed depreciation is recaptured at up to 25%, and gains may owe capital-gains tax (a 1031 exchange can defer both). Figures are a year-1 estimate at your 24.0% rate — not tax advice; consult a CPA.
Schools (NCES district)
- District
- Wadena-Deer Creek School District
- NCES district ID
- 2700022
- Math proficiency
- 33% ▼ -15.00%
- Reading proficiency
- 45% ▼ -11.00%
- Median HH income
- $38,917
- Composite
- 32.56/100
- National rank
- #5683
- State rank
- #235 of 301 in MN
Livability — Wadena
- Score
- 67/100
- State rank
- #433
- US rank
- #10325
Category grades
Schools grade is shown separately in the Schools card above.
Census & demographics
- Census place
- Wadena, MN
- Population (ZIP)
- 7,494
Population outlook (Wadena County) Hauer SSP2
- Today (2025)
- 13,856 people
- By 2030
- 13,689 · -1.2%
- By 2040
- 13,382 · -3.4%
- By 2050
- 13,062 · -5.7%
- By 2075
- 12,185 · -12.1%
- By 2100
- 10,297 · -25.7%
Race, ethnicity, and origin ACS 2023
- Neighborhood character
- Predominantly White (91%)
- Race & ethnicity
- White 91% Two or more races 7% Hispanic / Latino 3%
- Common ancestry
- Portuguese 12% Romanian 2% Lithuanian 2%
- Foreign-born
- 3% · Canada
- Languages at home
- 95% English-only · German/W. Germanic 2% Spanish 1%
Political lean MEDSL · Wadena
- 2024 margin
- Solid R (+51.5) · D 23.6% · R 75.1% · Other 1.2%
- 2008→2024 swing
- -34.1pp toward R · 2008: -17.4pp · 2024: -51.5pp
- All cycles
- 2024: R+51.5 2020: R+45.5 2016: R+45.7 2012: R+24.4 2008: R+17.4
Not yet ingested
- Civics
- —
Market trends
- HPI YoY
- ▼ -18.45%
- Current HPI
- 223.9404
- Rent YoY
- —
- Metro
- —
- State GDP YoY
- ▲ 2.41%
- F500 in state
- 34
Industry mix (Fortune 500 HQ in MN)
| Industry | F500 HQs | Revenue |
|---|---|---|
| Healthcare | 2 | $407B |
|
||
| Retail | 2 | $150B |
|
||
| Consumer Goods | 2 | $32B |
|
||
| Industrial Machinery | 2 | $6B |
|
||
| Agriculture | 1 | $40B |
|
||
| Healthcare / Medical Devices | 1 | $32B |
|
||
Price history
+133.2% since first listed9 events — show timeline
- 2026-05-27 Relisted — NORTHSTARMLS as Distributed by MLS Grid
- 2026-05-27 Contingent — NORTHSTARMLS as Distributed by MLS Grid
- 2026-05-09 Listing Removed — NORTHSTARMLS as Distributed by MLS Grid
- 2026-05-01 Contingent — NORTHSTARMLS as Distributed by MLS Grid
- 2026-04-29 Listing Removed — NORTHSTARMLS as Distributed by MLS Grid
- 2026-02-18 Contingent — NORTHSTARMLS as Distributed by MLS Grid
- 2026-02-16 Price Changed $79,900 NORTHSTARMLS as Distributed by MLS Grid
- 2025-12-17 Listed $93,600 NORTHSTARMLS as Distributed by MLS Grid
- 2006-08-01 Sold (Public Records) $34,265 Public Records
Property tax history
+6.4%/yrLatest (2026): $858 · +6.5% YoY. Source: county tax records.
Cash-flow waterfall
monthlySold comps — $/sqft
last 12 mo · ≤1 miLoading sold comps…