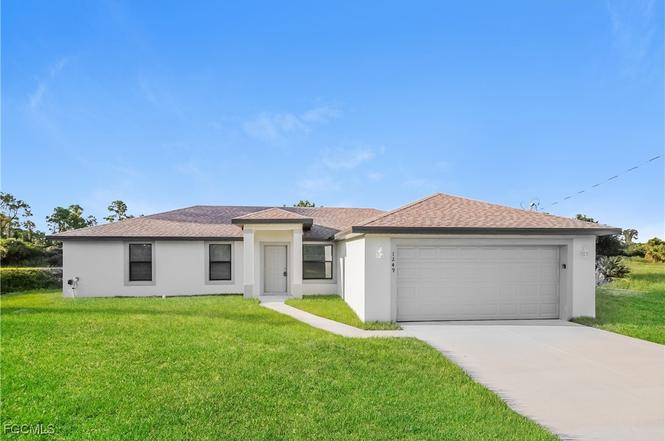
1249 Cordoba St E · Lehigh Acres, FL
Flood risk 4/10 · Minor
- FEMA flood zone
- X (unshaded)
- Chance of flooding over 30 yrs
- 0.22%
- Est. flood insurance / yr
- $507 – $1,088
Fire risk 4/10 · Minor
- Est. fire insurance / yr
- $947 – $1,759
Heat risk 9/10 · Severe
- Hot days now (above 108°F)
- 7 days/yr
- Hot days in 30 yrs
- 26 days/yr
Wind risk 10/10 · Severe
- Chance of severe wind over 30 yrs
- 99.0%
Air-quality risk 2/10 · Minimal
- Unhealthy air days now
- 1 days/yr
- Unhealthy air days in 30 yrs
- 2 days/yr
Risk factors via First Street. Map © Google.
Why this score? — see what drove the C+ grade
The composite is a weighted blend of 9 inputs, each scored 0–100. Each bar is that input's sub-score; the figure is the points it added to the 100-point composite (weight × sub-score).
- Cash flow +16.2/30.0
- ARV discount +15.0/15.0
- Appreciation +10.0/10.0
- DSCR +5.0/10.0
- Schools +4.1/10.0
- 1% rule +3.1/10.0
- Livability +3.0/5.0
- Condition / age +2.5/5.0
- Rent growth +1.3/5.0
$270,000
🖨 Deal sheet (PDF) 📄 Offer letter ✓ Due diligence
Listing remarks MLS
Brand new construction!! Estimated completion July 2022 * * * Move in ready, laminate vinyl planks throughout, stainless steel appliances, 4-bedroom home.
Key facts
- Conveniently located
- Open-concept layout
- 0.24 acre lot
Tags
Property features AI
Finance
- Other: Lot is rectangular with south exposure
- Financial info: Pets allowed
- HOA & community: Non-gated community; No association fee listed
Exterior
- Parking: Attached 2-car garage
- Security: Smoke detector(s)
- Utilities: Well water; Septic sewer; Cable available
- Home design: Single-story home; Resale property; North-facing
- Construction: Block, concrete and stucco construction; Shingle roof; Built on conventional foundation
- Exterior features: Patio; Manual shutters; Smoke detectors
Interior
- Kitchen: Dishwasher; Microwave; Range; Refrigerator
- Bedrooms: Split bedrooms
- Flooring: Vinyl
- Bathrooms: 2 full bathrooms
- Heating & cooling: Central heating (electric); Central air conditioning (electric)
- Interior features: Double-hung windows; Family/Dining room; Combined living and dining area; Separate shower (shower only option); Split bedroom layout; Unfurnished
- Laundry & utility: Has washer/dryer hookup
Neighborhood map
What this means for you Summary
Snapshot
- This is a 4-bed/2.0-bath single-family listed at $270k.
Deal economics
- At list price, monthly cash flow is $145 ($2k/yr) — positive.
- The deal already cash-flows at list — no discount required.
- To meet the 1% rule (rent ≥ 1% of price), the offer needs to be $218k (19.3% below list).
- Recommended offer: $218k (19.3% below list) — sets the bar for 1% rule.
- Cap rate 6.9% vs local median 4.7% in Lehigh Acres — top-decile yield for the area; either an underpriced asset or a hidden risk that comps aren't pricing in. Stress-test before assuming the spread holds.
Location & tenants
- Location reads 59/100 on livability (#826 in FL) — a working-class tenant base; expect higher turnover. Strengths: cost of living A+, housing A+; Watch: crime C-, employment D+, schools D-.
- Lee (suburban): math 47% / reading 50% proficiency, ranked #42 of 73 in FL (top 58%) — families likely to look elsewhere, expect single-tenant / working-renter base with shorter leases.
- Market conditions: Rents falling (-4.7%/yr); 2460 active listings in the ZIP; 23 comparable units currently listed for rent nearby; rentals at typical pace (median 20d on market — plan ~3-4 weeks tenant-placement turnaround); 15,411 units permitted in Lee County in 2024 (4,686 in 5+ unit buildings).
- This rent runs 36% of the median local income ($72k/yr) — at the standard rent-burdened threshold; future hikes will face affordability resistance.
Forward outlook
- In year one you build about $29k of equity ($2k loan paydown + $27k appreciation (10.0% local appreciation)).
- Lee County population projected at +44% by 2050 — long-run rental-demand tailwind backs the buy-and-hold thesis.
- At projected returns (10.0% appreciation + 0.0% rent growth), your $76k cash investment doubles in ~3 years — after that, you're playing with house money.
- By year 2, paydown + projected appreciation supports a ~$46k cash-out refi (75% LTV) — recoverable capital for the next deal without selling this one.
Negotiation context
- It's been on market 148 days — a 12% lower offer ($238k) is reasonable based on typical stale-listing flexibility.
- 4 sale attempts since 4y ago; this cycle's ask has dropped $15k (5%) from the opening price — seller is motivated, your offer sets the floor, not the list.
Risks & watch-outs
- Climate carrying-cost: severe wind risk, 99% chance of damaging wind over 30y; extreme-heat days projected 7→26/yr by 2055 (HVAC capex compounding) — expect insurance premiums to compound above CPI over the hold.
Questions for the listing agent
- It's been on market 148 days. Have you received any prior offers? Is the seller open to a 19% concession, seller financing, or rate buy-down credit?
- Why hasn't it sold? Are there any deal-killer items the seller is aware of (foundation, flood, title, zoning, code violations)?
- Is there a deadline driving the sale (1031 exchange, divorce, estate, relocation)? That informs how much negotiation room exists.
- Schools are D-rated, which usually means shorter tenancies and higher turnover. Who's the typical renter profile here, and what's been the actual vacancy rate?
- What's the average days-on-market for RENTAL listings here right now (not sales)? A rising rental-DOM trend means longer vacancies and softer asking-rent achievability than the comps imply.
- What's the recent tenant-quality profile in this submarket — average credit score on applications, eviction rate, late-payment / NSF rate, and stable-employment percentage? A property-management company in the area should have these aggregated.
- How much new for-sale + rental construction is in the pipeline within 1–3 miles? Heavy new supply typically softens prices + rents 12–24 months out; constrained supply supports both.
Investment metrics
- 1% rule
- 0.81% ✗
- Cap rate
- 6.94%
- Cash-on-cash
- 2.30%
- DSCR
- 1.10
- GRM
- 10.3
CMA / ARV
- ARV (on-the-fly)
- $353,248
- Comps found
- 2
Show comp detail 2 sales within ~0.75 mi
| Address | Dist | Beds/Ba | Sqft | Sold | Price | $/sf | Match |
|---|---|---|---|---|---|---|---|
| 242 Nebraska Ave S | 0.46mi | 3/2.0 (-1) | 1,673 (+6%) | 1mo | $375,000 | $224 | 62 |
| 1131 Crocus St | 0.68mi | 4/3.0 | 1,719 (+9%) | 6mo | $335,000 | $195 | 44 |
Match score weights: distance 35% · size 25% · config 20% · recency 20%. Top-matched comps best support the ARV.
Projected returns pro-forma
10.0% appreciation · 0.0% rent growth · sell at horizon
- IRR
- 25.0%
- Equity multiple
- 2.98×
- Total profit
- $149,745
- Equity at exit
- $243,237
- IRR
- 21.4%
- Equity multiple
- 6.58×
- Total profit
- $421,993
- Equity at exit
- $524,551
Cash invested: $75,600 (down + closing). Projections, not guarantees.
Landlord ↔ Tenant lean methodology
- Overall (STATE)
- 87 Strongly Landlord-Friendly
- State Florida
- 87 Strongly Landlord-Friendly · R+3
- County
- — inherits STATE
- City
- — inherits STATE
ZIP-level market 33974
- Home prices YoY
- 5.8%
- Rents YoY
- -4.7%
- Active inventory
- 2460
- Price-to-rent
- 10.3×
Monthly cashflow live
- Estimated rent
- $2,180 high interval (Pro) →
- Mortgage (P&I)
- −$1,416
- Tax from tax record
- −$49 /mo · $582/yr
- Insurance
- −$112
- HOA
- −$0
- Vacancy / Maint / Mgmt
- −$458
- Net cashflow
- $145
Break-even live
Sensitivity live
| Price | -10% $298 | -5% $221 | +0% $145 | +5% $68 | +10% $-331 |
|---|---|---|---|---|---|
| Rent | -10% $-27 | -5% $59 | +0% $145 | +5% $231 | +10% $317 |
| Rate | -1.0pp $281 | -0.5pp $214 | base $145 | +0.5pp $75 | +1.0pp $4 |
UW: 25.0% down · 7.5% · 30yr · 1.5% tax · 5.0% vac · 8.0% maint · 8.0% mgmt
Financing live
Cash to close
- Down payment
- $67,500
- Closing costs
- $8,100
- Reserves months
- —
- Total cash needed
- —
Loan-product check · same deal, 3 products live
Conventional
25% down · 7.5% · 30yr
- Down + closing
- —
- Monthly P&I
- —
- Monthly cashflow
- —
- DSCR
- —
- Eligible?
- —
Personal DTI + credit; lowest rate.
DSCR
20% down · 8.5% · 30yr
- Down + closing
- —
- Monthly P&I
- —
- Monthly cashflow
- —
- DSCR
- —
- Eligible?
- —
No personal income docs; deal must DSCR.
Hard money
10% down · 12.0% · 12mo
- Down + closing
- —
- Monthly P&I
- —
- Monthly cashflow
- —
- DSCR
- —
- Eligible?
- —
Short-term bridge; refi at stabilization.
Rent comps 23 comps
| Address | Beds | Baths | Sqft | Rent | $/sqft | DOM | Units | Dist |
|---|---|---|---|---|---|---|---|---|
| 315 Melissa Ave Unit A Lehigh Acres, FL | 3.0 | 2.0 | 1199 | $1,550 | $1.29 | 3d | 1 | 0.23mi |
| 1252 County St E Lehigh Acres, FL | 4.0 | 2.0 | 1571 | $1,995 | $1.27 | 24d | 1 | 0.23mi |
| 1228 Chrisholm St Lehigh Acres, FL | 4.0 | 2.0 | 1811 | $2,500 | $1.38 | 2d | 1 | 0.23mi |
| 1226 Chrisholm St Lehigh Acres, FL | 4.0 | 2.0 | 1811 | $2,500 | $1.38 | 2d | 1 | 0.25mi |
| 313 Melissa Ave Unit A Lehigh Acres, FL | 3.0 | 2.0 | 1199 | $1,575 | $1.31 | 3d | 1 | 0.25mi |
| 327 Lester Ave S Lehigh Acres, FL | 4.0 | 2.0 | 1577 | $2,195 | $1.39 | 2d | 1 | 0.42mi |
| 462 Lampion Ave S Unit Main house Lehigh Acres, FL | 3.0 | 2.0 | 1089 | $1,600 | $1.47 | 3d | 1 | 0.64mi |
| 459 Lackey Ave S Lehigh Acres, FL | 4.0 | 2.0 | 1833 | $1,825 | $1.00 | 2d | 1 | 0.70mi |
| 1122 Randolph St Lehigh Acres, FL | 3.0 | 2.0 | 1550 | $2,100 | $1.35 | 24d | 1 | 0.73mi |
| 444 Genoa Ave S Lehigh Acres, FL | 4.0 | 2.0 | 1389 | $1,750 | $1.26 | 21d | 1 | 0.79mi |
| 1245 Amherst St E Lehigh Acres, FL | 3.0 | 2.0 | 1149 | $1,620 | $1.41 | 14d | 1 | 0.84mi |
| 442 Genoa Ave S Lehigh Acres, FL | 4.0 | 2.0 | 1365 | $1,750 | $1.28 | 3d | 1 | 0.92mi |
| 1224 Bayou St Lehigh Acres, FL | 3.0 | 2.0 | 1272 | $1,750 | $1.38 | 24d | 1 | 1.02mi |
| 1144 Essex St E Lehigh Acres, FL | 3.0 | 2.0 | 1464 | $1,650 | $1.13 | 20d | 1 | 1.05mi |
| 232 Fowler Ave Lehigh Acres, FL | 3.0 | 2.0 | 1582 | $2,664 | $1.68 | 24d | 1 | 1.11mi |
| 1018 Kent St E Lehigh Acres, FL | 3.0 | 2.0 | 1600 | $2,000 | $1.25 | 16d | 1 | 1.14mi |
| 1260 Milwaukee Blvd Unit 1262 Lehigh Acres, FL | 3.0 | 2.0 | 1084 | $1,750 | $1.61 | 24d | 1 | 1.17mi |
| 1256 Milwaukee Blvd Lehigh Acres, FL | 3.0 | 2.0 | 1084 | $1,800 | $1.66 | 24d | 1 | 1.17mi |
| 1248 Hillcrest St E Lehigh Acres, FL | 3.0 | 2.0 | 1055 | $1,650 | $1.56 | 3d | 1 | 1.23mi |
| 556 Sherwood Ave S Lehigh Acres, FL | 3.0 | 2.0 | 1582 | $2,175 | $1.37 | 24d | 1 | 1.36mi |
| 970 Lakeside Dr Lehigh Acres, FL | 3.0 | 2.0 | 1325 | $1,800 | $1.36 | 20d | 1 | 1.43mi |
| 947 Grant Blvd Lehigh Acres, FL | 4.0 | 2.0 | 1650 | $2,145 | $1.30 | 24d | 1 | 1.47mi |
| 637 Montclair Ave S Lehigh Acres, FL | 3.0 | 2.0 | 1497 | $1,660 | $1.11 | 24d | 1 | 1.47mi |
Listing history 14 events
-
2026-05-01status Pending
-
2026-04-02price $270,000
-
2026-03-06price $275,000
-
2026-01-30price $280,000
-
2025-11-20historical $2,250
-
2025-11-17$285,000 Active
-
2025-11-15$2,250
-
2025-11-14historical $2,175
-
2025-11-14price $2,175
-
2025-11-06price $2,195
-
2025-10-29$2,250
-
2022-08-05soldstatus $306,500 Closed 157-char remark
Show marketing remark (157 chars)
Brand new construction!! Estimated completion July 2022 * * * Move in ready, laminate vinyl planks throughout, stainless steel appliances, 4-bedroom home.
-
2022-07-07status Pending 157-char remark
Show marketing remark (157 chars)
Brand new construction!! Estimated completion July 2022 * * * Move in ready, laminate vinyl planks throughout, stainless steel appliances, 4-bedroom home.
-
2022-07-05$315,000 Active 157-char remark
Show marketing remark (157 chars)
Brand new construction!! Estimated completion July 2022 * * * Move in ready, laminate vinyl planks throughout, stainless steel appliances, 4-bedroom home.
ⓘ Source: listings_history table (triggers on properties + properties_extension) + one-shot
backfill from property_details.listing_events for pre-trigger history.
Tax reassessment forecast FL · Resets to sale price
- Current annual tax
- $582 · $49/mo
- Projected year-2 tax
- $2,241 · $187/mo
- Expected delta
- +$1,659/yr (+$138/mo · 284.9%)
ⓘ Screening estimate from a state-policy table — verify with the county assessor before closing.
Climate risk First Street
- Flood 4/10 Moderate FEMA zone X (unshaded) · 22% chance over 30 yrs
- Wildfire 4/10 Moderate
- Heat 9/10 Extreme 7 d/yr ≥108°F today · 26 d/yr by 30 yrs out
- Wind 10/10 Extreme 99% chance of damaging wind over 30 yrs
- Air quality 2/10 Low 1 unhealthy d/yr today · 2 by 30 yrs out
Nearby sold comps map
Loading sold comps map…
Walkable amenities ~0.75 mi
Loading nearby amenities…
Taxation est. · year 1
- Rental income
- $26,154
- − Mortgage interest
- −$15,124
- − Property taxes
- −$582
- − Insurance
- −$1,350
- − Repairs & maintenance
- −$2,092
- − Management
- −$2,092
- − Depreciation
- −$7,855
- Taxable loss
- −$2,941
- Est. tax savings @ 24.0%
- +$706
- After-tax cash flow
- $2,445/yr
For passive investors: Depreciation is non-cash, so a rental often shows a tax loss while cash-flowing — sheltering income. Rental losses are passive: they offset passive income freely, and up to $25,000/yr can offset ordinary (W-2) income if you actively participate and your MAGI is under $100k (phasing out to $0 by $150k); unused losses carry forward. On sale, claimed depreciation is recaptured at up to 25%, and gains may owe capital-gains tax (a 1031 exchange can defer both). Figures are a year-1 estimate at your 24.0% rate — not tax advice; consult a CPA.
Schools (NCES district)
- District
- Lee
- NCES district ID
- 1201080
- Math proficiency
- 47% ▼ -11.00%
- Reading proficiency
- 50% ▼ -4.00%
- Median HH income
- $49,518
- Composite
- 41.49/100
- National rank
- #3458
- State rank
- #42 of 73 in FL
Livability — Lehigh Acres
- Score
- 59/100
- State rank
- #826
- US rank
- #20055
Category grades
Schools grade is shown separately in the Schools card above.
Census & demographics
- Census place
- Lehigh Acres, FL
- County
- Lee County · 788,662 people
- City population
- 130,638
- Metro
- Cape Coral-Fort Myers, FL
- Population (ZIP)
- 19,927
- Household income
- $72,192
- Rent vs Own
- Severe rent burden
- 434.0
Population outlook (Lee County) Hauer SSP2
- Today (2025)
- 871,946 people
- By 2030
- 955,468 · +9.6%
- By 2040
- 1,113,587 · +27.7%
- By 2050
- 1,256,891 · +44.1%
- By 2075
- 1,560,270 · +78.9%
- By 2100
- 1,726,848 · +98.0%
Race, ethnicity, and origin ACS 2023
- Neighborhood character
- Diverse neighborhood (Simpson 0.64)
- Race & ethnicity
- Hispanic / Latino 52% Two or more races 31% White 26% Black 18%
- Hispanic origin (detail)
- Mexican 12% Puerto Rican 7% Cuban 20% Dominican 4%
- Common ancestry
- Hispanic 7% Italian 1% Portuguese 1%
- Foreign-born
- 32% · Canada, Jamaica
- Languages at home
- 48% English-only · Spanish 43% French/Haitian/Cajun 7% Other Indo-European 1%
Political lean MEDSL · Lee
- 2024 margin
- Strong R (+28.4) · D 35.5% · R 63.9%
- 2008→2024 swing
- -18.0pp toward R · 2008: -10.4pp · 2024: -28.4pp
- All cycles
- 2024: R+28.4 2020: R+19.2 2016: R+20.4 2012: R+16.6 2008: R+10.4
Not yet ingested
- Civics
- —
Market trends
- HPI YoY
- ▲ 16.53%
- Current HPI
- 303.3399
- Rent YoY
- ▼ -4.68%
- Metro
- Cape Coral-Fort Myers, FL
- State GDP YoY
- ▲ 3.28%
- F500 in state
- 36
Industry mix (Fortune 500 HQ in FL)
| Industry | F500 HQs | Revenue |
|---|---|---|
| Industrial Technology | 2 | $29B |
|
||
| Insurance | 2 | $17B |
|
||
| Retail | 1 | $60B |
|
||
| Technology Distribution | 1 | $58B |
|
||
| Homebuilding | 1 | $35B |
|
||
| Technology Manufacturing | 1 | $35B |
|
||
Price history
-14.3% since first listed14 events — show timeline
- 2026-05-01 Pending — FORTMLS
- 2026-04-02 Price Changed $270,000 FORTMLS
- 2026-03-06 Price Changed $275,000 FORTMLS
- 2026-01-30 Price Changed $280,000 FORTMLS
- 2025-11-20 Rental Removed $2,250 ZUMPER1
- 2025-11-17 Listed $285,000 FORTMLS
- 2025-11-15 Listed for Rent $2,250 ZUMPER1
- 2025-11-14 Rental Removed $2,175 NAPLESMLS
- 2025-11-14 Price Changed $2,175 NAPLESMLS
- 2025-11-06 Price Changed $2,195 NAPLESMLS
- 2025-10-29 Listed for Rent $2,250 NAPLESMLS
- 2022-08-05 Sold (MLS) $306,500 FORTMLS
- 2022-07-07 Pending — FORTMLS
- 2022-07-05 Listed $315,000 FORTMLS
Property tax history
+30.8%/yrLatest (2022): $582 · +124.3% YoY. Source: county tax records.
Cash-flow waterfall
monthlySold comps — $/sqft
last 12 mo · ≤1 miLoading sold comps…