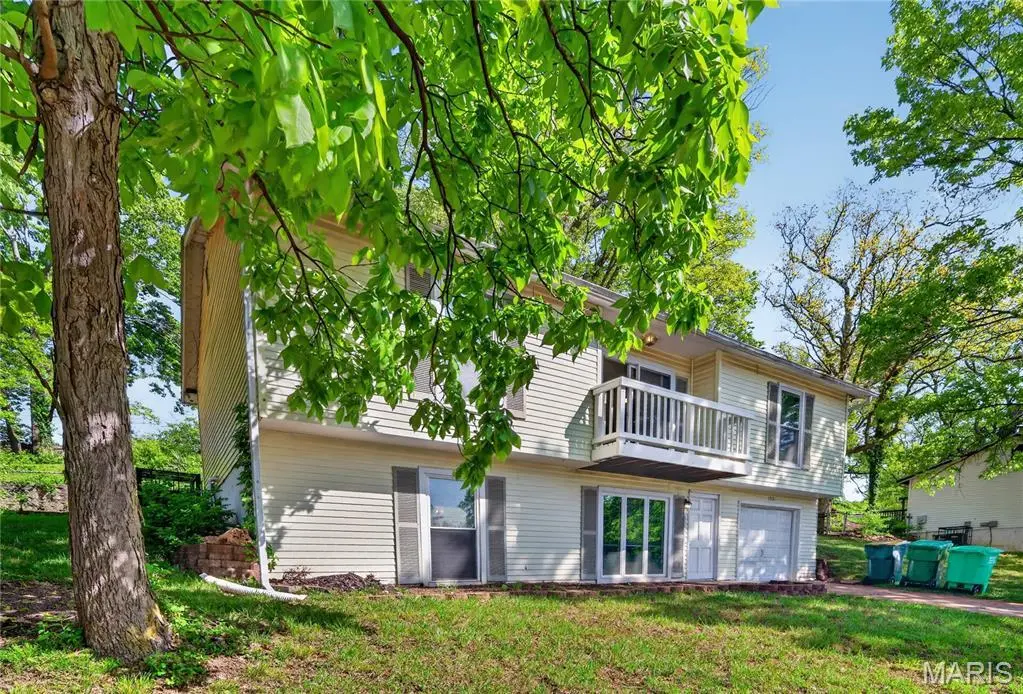
1921 Americana Way · Murphy, MO
Flood risk 1/10 · Minimal
- FEMA flood zone
- X (unshaded)
- Chance of flooding over 30 yrs
- 0.0%
- Est. flood insurance / yr
- $473 – $860
Fire risk 3/10 · Minor
- Est. fire insurance / yr
- $1,054 – $1,958
Heat risk 5/10 · Moderate
- Hot days now (above 107°F)
- 7 days/yr
- Hot days in 30 yrs
- 21 days/yr
Wind risk 2/10 · Minimal
- Chance of severe wind over 30 yrs
- 1.0%
Air-quality risk 3/10 · Minor
- Unhealthy air days now
- 2 days/yr
- Unhealthy air days in 30 yrs
- 4 days/yr
Risk factors via First Street. Map © Google.
Why this score? — see what drove the C- grade
The composite is a weighted blend of 9 inputs, each scored 0–100. Each bar is that input's sub-score; the figure is the points it added to the 100-point composite (weight × sub-score).
- Cash flow +16.7/30.0
- ARV discount +15.0/15.0
- DSCR +5.2/10.0
- Rent growth +4.4/5.0
- 1% rule +3.9/10.0
- Schools +3.5/10.0
- Livability +3.0/5.0
- Condition / age +2.5/5.0
- Appreciation +0.0/10.0
$224,900
🖨 Deal sheet 📄 Offer letter ✓ Due diligence
Listing remarks MLS
Welcome to this beautifully maintained home in the heart of Fenton, offering comfort, convenience, and a highly desirable location. Nestled in a quiet, established neighborhood, this property features a spacious and inviting layout with abundant natural light throughout. The main living area flows effortlessly into the kitchen and dining space, creating the perfect setting for both everyday living and entertaining. The kitchen offers ample cabinetry and workspace, ideal for home cooks and gatherings alike. Generous bedroom sizes provide flexibility for family, guests, or a home office. The primary suite serves as a relaxing retreat, complete with its own private bath. Step outside to enjoy the backyard perfect for outdoor dining, gardening, or simply unwinding. Additional highlights include a well-kept exterior, attached garage, and thoughtful updates that enhance both style and functionality. Conveniently located near shopping, dining, parks, and major highways, with access to the sought-after Northwest R-I School District, this home combines suburban tranquility with everyday accessibility. Don’t miss your opportunity to make this move-in-ready home your own schedule your showing today!
Key facts
- Ample cabinetry
- Well-kept exterior
- Thoughtful updates
Tags
Neighborhood map
What this means for you Summary
Snapshot
- This is a 3-bed/1.0-bath other listed at $225k.
Deal economics
- At list price, monthly cash flow is $140 ($2k/yr) — positive.
- The deal already cash-flows at list — no discount required.
- To meet the 1% rule (rent ≥ 1% of price), the offer needs to be $201k (10.7% below list).
- Recommended offer: $201k (10.7% below list) — sets the bar for 1% rule.
- Cap rate 7.0% vs local median 3.0% in Murphy — top-decile yield for the area; either an underpriced asset or a hidden risk that comps aren't pricing in. Stress-test before assuming the spread holds.
Location & tenants
- Location reads 60/100 on livability (#461 in MO) — a middle-class / working-renter tenant base. Strengths: cost of living A+, housing A+; Watch: crime D+, employment D+, schools F.
- Northwest R-I (suburban): math 37% / reading 43% proficiency, ranked #128 of 324 in MO (top 40%) — families likely to look elsewhere, expect single-tenant / working-renter base with shorter leases.
- Market conditions: Rents rising fast (+7.7%/yr); 146 active listings in the ZIP; 1 comparable units currently listed for rent nearby; solid renter incomes; 807 units permitted in Jefferson County in 2024 (104 in 5+ unit buildings).
Forward outlook
- Local home prices are declining (-3.0%/yr); year-one equity from $2k of loan paydown is wiped out by about $7k of value loss. Plan a longer hold.
Negotiation context
- It's been on market 61 days — a 6% lower offer ($211k) is reasonable based on typical stale-listing flexibility.
- Current owner paid $78k; list at $225k implies a 188% gain — meaningful room to come down on a strong offer.
Risks & watch-outs
- Climate carrying-cost: extreme-heat days projected 7→21/yr by 2055 (HVAC capex compounding) — expect insurance premiums to compound above CPI over the hold.
Questions for the listing agent
- It's been on market 61 days. Have you received any prior offers? Is the seller open to a 11% concession, seller financing, or rate buy-down credit?
- Built in 1977 — when were the roof, HVAC, electrical panel, plumbing, and water heater last replaced?
- What does the HOA fee cover, when was the last increase, and are there any pending special assessments or reserve-fund shortfalls?
- Why hasn't it sold? Are there any deal-killer items the seller is aware of (foundation, flood, title, zoning, code violations)?
- Is there a deadline driving the sale (1031 exchange, divorce, estate, relocation)? That informs how much negotiation room exists.
- Schools are F-rated, which usually means shorter tenancies and higher turnover. Who's the typical renter profile here, and what's been the actual vacancy rate?
- Crime grade is D in this area — have there been break-ins, vandalism, or insurance claims at this property in the last 3 years? What carrier currently insures it and at what premium?
- What's the average days-on-market for RENTAL listings here right now (not sales)? A rising rental-DOM trend means longer vacancies and softer asking-rent achievability than the comps imply.
- What's the recent tenant-quality profile in this submarket — average credit score on applications, eviction rate, late-payment / NSF rate, and stable-employment percentage? A property-management company in the area should have these aggregated.
- How much new for-sale + rental construction is in the pipeline within 1–3 miles? Heavy new supply typically softens prices + rents 12–24 months out; constrained supply supports both.
Investment metrics
- 1% rule
- 0.89% ✗
- Cap rate
- 7.04%
- Cash-on-cash
- 2.67%
- DSCR
- 1.12
- GRM
- 9.3
CMA / ARV
- ARV (median comp)
- $274,229
- List price
- $224,900
- Delta
- -17.99%
- Verdict
- UNDERPRICED
- Comps
- 20 within 1.0 mi
Projected returns pro-forma
-3.0% appreciation · 7.72% rent growth · sell at horizon
- IRR
- -7.2%
- Equity multiple
- 0.72×
- Total profit
- $-17,578
- Equity at exit
- $33,533
- IRR
- 7.2%
- Equity multiple
- 1.65×
- Total profit
- $41,231
- Equity at exit
- $19,445
Cash invested: $62,972 (down + closing). Projections, not guarantees.
Landlord ↔ Tenant lean methodology
- Overall (STATE)
- 81 Strongly Landlord-Friendly
- State Missouri
- 81 Strongly Landlord-Friendly · R+10
- County
- — inherits STATE
- City
- — inherits STATE
ZIP-level market 63026
- Rents YoY
- 7.7%
- Active inventory
- 146
- Price-to-rent
- 9.3×
Monthly cashflow live
- Estimated rent
- $2,008 medium interval (Pro) →
- Mortgage (P&I)
- −$1,179
- Tax from tax record
- −$132 /mo · $1,580/yr
- Insurance
- −$94
- HOA
- −$42
- Vacancy / Maint / Mgmt
- −$422
- Net cashflow
- $140
Break-even live
UW: 25.0% down · 7.5% · 30yr · 1.5% tax · 5.0% vac · 8.0% maint · 8.0% mgmt
Financing live
Cash to close
- Down payment
- $56,225
- Closing costs
- $6,747
- Reserves months
- —
- Total cash needed
- —
Loan-product check · same deal, 3 products live
Conventional
25% down · 7.5% · 30yr
- Down + closing
- —
- Monthly P&I
- —
- Monthly cashflow
- —
- DSCR
- —
- Eligible?
- —
Personal DTI + credit; lowest rate.
DSCR
20% down · 8.5% · 30yr
- Down + closing
- —
- Monthly P&I
- —
- Monthly cashflow
- —
- DSCR
- —
- Eligible?
- —
No personal income docs; deal must DSCR.
Hard money
10% down · 12.0% · 12mo
- Down + closing
- —
- Monthly P&I
- —
- Monthly cashflow
- —
- DSCR
- —
- Eligible?
- —
Short-term bridge; refi at stabilization.
Rent comps 1 comps
| Address | Beds | Baths | Sqft | Rent | $/sqft | DOM | Units | Dist |
|---|---|---|---|---|---|---|---|---|
| 2668 Winding Valley Dr Fenton, MO | 3.0 | 2.5 | 2533 | $2,776 | $1.10 | 14d | 1 | 0.77mi |
HOA detail
- Monthly dues
- $42 · $504/yr
Listing history 17 events
-
2026-06-18days on market $224,900 Active 61 DOM
-
2026-06-17days on market $224,900 Active 60 DOM
-
2026-06-16days on market $224,900 Active 59 DOM
-
2026-06-15days on market $224,900 Active 58 DOM
-
2026-06-13days on market $224,900 Active 56 DOM
-
2026-06-13pricedays on market $224,900 Active 55 DOM
-
2026-06-09days on market $234,900 Active 52 DOM
-
2026-06-08days on market $234,900 Active 51 DOM
-
2026-06-07days on market $234,900 Active 50 DOM
-
2026-06-05days on market $234,900 Active 47 DOM
-
2026-06-03days on market $234,900 Active 46 DOM
-
2026-06-02days on market $234,900 Active 45 DOM
-
2026-06-01days on market $234,900 Active 44 DOM
-
2026-05-31days on market $234,900 Active 43 DOM
-
2026-04-18$234,900 Active 1217-char remark
Show marketing remark (1217 chars)
Welcome to this beautifully maintained home in the heart of Fenton, offering comfort, convenience, and a highly desirable location. Nestled in a quiet, established neighborhood, this property features a spacious and inviting layout with abundant natural light throughout. The main living area flows effortlessly into the kitchen and dining space, creating the perfect setting for both everyday living and entertaining. The kitchen offers ample cabinetry and workspace, ideal for home cooks and gatherings alike. Generous bedroom sizes provide flexibility for family, guests, or a home office. The primary suite serves as a relaxing retreat, complete with its own private bath. Step outside to enjoy the backyard perfect for outdoor dining, gardening, or simply unwinding. Additional highlights include a well-kept exterior, attached garage, and thoughtful updates that enhance both style and functionality. Conveniently located near shopping, dining, parks, and major highways, with access to the sought-after Northwest R-I School District, this home combines suburban tranquility with everyday accessibility. Don’t miss your opportunity to make this move-in-ready home your own schedule your showing today!
-
2005-07-27soldstatus
-
1994-09-14soldstatus $78,000
ⓘ Source: listings_history table (triggers on properties + properties_extension) + one-shot
backfill from property_details.listing_events for pre-trigger history.
Tax reassessment forecast MO · Resets to sale price
- Current annual tax
- $1,580 · $132/mo
- Projected year-2 tax
- $2,182 · $182/mo
- Expected delta
- +$601/yr (+$50/mo · 38.0%)
ⓘ Screening estimate from a state-policy table — verify with the county assessor before closing.
Climate risk First Street
- Flood 1/10 Low FEMA zone X (unshaded) · 0% chance over 30 yrs
- Wildfire 3/10 Moderate
- Heat 5/10 Major 7 d/yr ≥107°F today · 21 d/yr by 30 yrs out
- Wind 2/10 Low 100% chance of damaging wind over 30 yrs
- Air quality 3/10 Moderate 2 unhealthy d/yr today · 4 by 30 yrs out
Nearby sold comps map
Loading sold comps map…
Walkable amenities ~0.75 mi
Loading nearby amenities…
Taxation est. · year 1
- Rental income
- $24,102
- − Mortgage interest
- −$12,598
- − Property taxes
- −$1,580
- − Insurance
- −$1,124
- − Repairs & maintenance
- −$1,928
- − Management
- −$1,928
- − HOA
- −$504
- − Depreciation
- −$6,543
- Taxable loss
- −$2,104
- Est. tax savings @ 24.0%
- +$505
- After-tax cash flow
- $2,183/yr
For passive investors: Depreciation is non-cash, so a rental often shows a tax loss while cash-flowing — sheltering income. Rental losses are passive: they offset passive income freely, and up to $25,000/yr can offset ordinary (W-2) income if you actively participate and your MAGI is under $100k (phasing out to $0 by $150k); unused losses carry forward. On sale, claimed depreciation is recaptured at up to 25%, and gains may owe capital-gains tax (a 1031 exchange can defer both). Figures are a year-1 estimate at your 24.0% rate — not tax advice; consult a CPA.
Schools (NCES district)
- District
- Northwest R-I
- NCES district ID
- 2922890
- Math proficiency
- 37% ▼ -9.00%
- Reading proficiency
- 43% ▼ -9.00%
- Median HH income
- $55,998
- Composite
- 35.05/100
- National rank
- #5034
- State rank
- #128 of 324 in MO
Livability — Murphy
- Score
- 60/100
- State rank
- #461
- US rank
- #18506
Category grades
Schools grade is shown separately in the Schools card above.
Census & demographics
- County
- Jefferson County · 108,544 people
- Metro
- St. Louis, MO-IL
- Population (ZIP)
- 45,354
- Household income
- $97,553
- Rent vs Own
- Severe rent burden
- 513.0
Population outlook (Jefferson County) Hauer SSP2
- Today (2025)
- 235,088 people
- By 2030
- 238,365 · +1.4%
- By 2040
- 240,156 · +2.2%
- By 2050
- 234,651 · -0.2%
- By 2075
- 214,569 · -8.7%
- By 2100
- 179,697 · -23.6%
Race, ethnicity, and origin ACS 2023
- Neighborhood character
- Predominantly White (87%)
- Race & ethnicity
- White 87% Two or more races 8% Hispanic / Latino 3% Asian 2% Black 1%
- Common ancestry
- Romanian 4% Lithuanian 3% Slovak 1%
- Foreign-born
- 3% · Canada, China
- Languages at home
- 95% English-only · Spanish 1% Russian/Polish/Slavic 1% Other Indo-European 1%
Political lean MEDSL · Jefferson
- 2024 margin
- Solid R (+36.7) · D 31.0% · R 67.7% · Other 1.3%
- 2008→2024 swing
- -39.3pp toward R · 2008: 2.5pp · 2024: -36.7pp
- All cycles
- 2024: R+36.7 2020: R+33.9 2016: R+35.3 2012: R+12.7 2008: D+2.5
Not yet ingested
- Civics
- —
Market trends
- HPI YoY
- ▼ -300.59%
- Current HPI
- 211.8944
- Rent YoY
- ▲ 7.72%
- Metro
- St. Louis, MO-IL
- State GDP YoY
- ▲ 1.84%
- F500 in state
- 20
Industry mix (Fortune 500 HQ in MO)
| Industry | F500 HQs | Revenue |
|---|---|---|
| Healthcare | 1 | $163B |
|
||
| Insurance | 1 | $21B |
|
||
| Industrial Technology | 1 | $17B |
|
||
| Retail | 1 | $16B |
|
||
| Industrial Distribution | 1 | $10B |
|
||
| Utilities | 1 | $9B |
|
||
Price history
+201.2% since first listed3 events — show timeline
- 2026-04-18 Listed $234,900 MARIS as Distributed by MLS Grid
- 2005-07-27 Sold (Public Records) — Public Records
- 1994-09-14 Sold (Public Records) $78,000 Public Records
Property tax history
+2.4%/yrLatest (2025): $1,580 · +4.0% YoY. Source: county tax records.
Cash-flow waterfall
monthlySold comps — $/sqft
last 12 mo · ≤1 miLoading sold comps…