 🏷️ Likely Rental
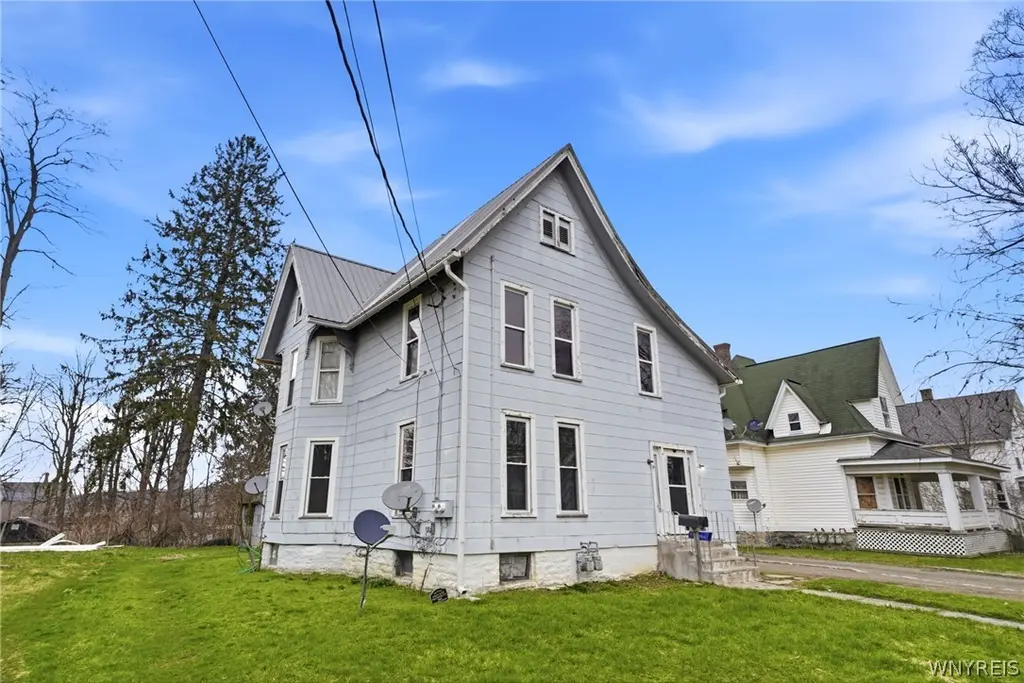
119 Chestnut St · Gowanda, NY
Flood risk No data
- FEMA flood zone
- —
- Chance of flooding over 30 yrs
- —
- Est. flood insurance / yr
- —
Fire risk No data
- Est. fire insurance / yr
- —
Heat risk No data
- Hot days now (above threshold)
- —
- Hot days in 30 yrs
- —
Wind risk No data
- Chance of severe wind over 30 yrs
- —
Air-quality risk No data
- Unhealthy air days now
- —
- Unhealthy air days in 30 yrs
- —
Risk factors via First Street. Map © Google.
Why this score? — see what drove the A grade
The composite is a weighted blend of 9 inputs, each scored 0–100. Each bar is that input's sub-score; the figure is the points it added to the 100-point composite (weight × sub-score).
- Cash flow +30.0/30.0
- ARV discount +15.0/15.0
- 1% rule +10.0/10.0
- DSCR +10.0/10.0
- Appreciation +10.0/10.0
- Schools +3.5/10.0
- Livability +3.5/5.0
- Rent growth +2.5/5.0
- Condition / age +2.5/5.0
$135,000
🖨 Deal sheet 📄 Offer letter ✓ Due diligence
Multi-family units
County records classify this as Multi-Family (2-4 Unit). Listing-text estimate: 1 unit. estimate disagrees with records
Listing remarks MLS
Welcome to 119 Chestnut Street in the Village of Gowanda, an income producing property offering strong updates and great investment potential. Both the upper and lower apartments have been recently refreshed with new paint, updated flooring, and fully remodeled bathrooms. The lower unit features all new windows installed in 2025, a recently serviced and flushed hot water tank, and a back porch finished with low maintenance Trex decking, adding great tenant appeal. The upper apartment also includes a newer hot water tank. Major mechanical and exterior improvements provide peace of mind, including a newer metal roof (installed prior to current ownership), a brand-new gutter system in 2025 (approximately $12,000 investment), and updated glass block windows in the basement. Whether you're looking to expand your portfolio or owner occupy while generating rental income, this property offers a strong combination of updates, functionality, and long-term value.
Key facts
- Hot water tank
- Strong updates
- Back porch
Tags
Neighborhood map
What this means for you Summary
Snapshot
- This is a 4-bed/2.0-bath multifamily listed at $135k.
Deal economics
- At list price, monthly cash flow is $828 ($10k/yr) — positive.
- The deal already cash-flows at list — no discount required.
- Meets the 1% rule at list price ($2k rent vs $135k).
- Recommended offer: $127k (6.0% below list) — sets the bar for market timing.
Location & tenants
- Location reads 70/100 on livability (#457 in NY) — a middle-class / working-renter tenant base. Strengths: cost of living A+, housing A+, health & safety A+; Watch: schools C-, amenities F, commute F.
- Gowanda Central School District (rural): math 38% / reading 44% proficiency, ranked #513 of 590 in NY (top 87%) — families likely to look elsewhere, expect single-tenant / working-renter base with shorter leases.
- Market conditions: 24 active listings in the ZIP; 128 units permitted in Cattaraugus County in 2024 (21 in 5+ unit buildings).
Forward outlook
- In year one you build about $14k of equity ($933 loan paydown + $14k appreciation (10.0% local appreciation)).
- Cattaraugus County population projected at -28% by 2050 — secular population decline; favor cash flow + early exit over multi-decade hold.
- At projected returns (10.0% appreciation + 3.0% rent growth), your $38k cash investment doubles in ~2 years — after that, you're playing with house money.
- By year 3, paydown + projected appreciation supports a ~$37k cash-out refi (75% LTV) — recoverable capital for the next deal without selling this one.
Negotiation context
- It's been on market 65 days — a 6% lower offer ($127k) is reasonable based on typical stale-listing flexibility.
- 2 sale attempts since 16y ago with the ask held roughly flat each time — persistent listings suggest the price (not the market) is what's stuck; bring a comps-based counter.
- Current owner paid $45k; list at $135k implies a 200% gain — meaningful room to come down on a strong offer.
Risks & watch-outs
- Watch-outs: built in 1920 — expect roof / HVAC / electrical / plumbing capex.
Questions for the listing agent
- It's been on market 65 days. Have you received any prior offers? Is the seller open to a 6% concession, seller financing, or rate buy-down credit?
- Built in 1920 — when were the roof, HVAC, electrical panel, plumbing, and water heater last replaced?
- Why hasn't it sold? Are there any deal-killer items the seller is aware of (foundation, flood, title, zoning, code violations)?
- Is there a deadline driving the sale (1031 exchange, divorce, estate, relocation)? That informs how much negotiation room exists.
- What's the average days-on-market for RENTAL listings here right now (not sales)? A rising rental-DOM trend means longer vacancies and softer asking-rent achievability than the comps imply.
- What's the recent tenant-quality profile in this submarket — average credit score on applications, eviction rate, late-payment / NSF rate, and stable-employment percentage? A property-management company in the area should have these aggregated.
- How much new apartment / multifamily construction is in the pipeline within 1–3 miles? Heavy new supply (>2% of stock underway) typically softens rents 12–24 months out; light construction supports rent growth.
Investment metrics
- 1% rule
- 1.66% ✓
- Cap rate
- 13.65%
- Cash-on-cash
- 26.29%
- DSCR
- 2.17
- GRM
- 5.0
CMA / ARV
- ARV (median comp)
- $224,398
- List price
- $135,000
- Delta
- -39.84%
- Verdict
- UNDERPRICED
- Comps
- 11 within 1.0 mi
Projected returns pro-forma
10.0% appreciation · 3.0% rent growth · sell at horizon
- IRR
- 44.1%
- Equity multiple
- 4.34×
- Total profit
- $126,307
- Equity at exit
- $121,619
- IRR
- 38.2%
- Equity multiple
- 9.74×
- Total profit
- $330,549
- Equity at exit
- $262,275
Cash invested: $37,800 (down + closing). Projections, not guarantees.
Landlord ↔ Tenant lean methodology
- Overall (STATE)
- 15 Strongly Tenant-Friendly
- State New York
- 15 Strongly Tenant-Friendly · D+10
- County
- — inherits STATE
- City
- — inherits STATE
ZIP-level market 14070
- Home prices YoY
- 8.8%
- Active inventory
- 24
- Price-to-rent
- 10.1×
Monthly cashflow live
- Estimated rent
- $2,237 medium interval (Pro) →
- Mortgage (P&I)
- −$708
- Tax from tax record
- −$175 /mo · $2,099/yr
- Insurance
- −$56
- HOA
- −$0
- Vacancy / Maint / Mgmt
- −$470
- Net cashflow
- $828
Break-even live
2-unit breakdown (identical units grouped — click to expand)
| Units | Beds | Baths | Est. rent |
|---|---|---|---|
| 2× units | 2 | 1 | $2,236 |
| #1 | 2 | 1 | $1,118 |
| #2 | 2 | 1 | $1,118 |
| Total (2 units) | $2,237 | ||
UW: 25.0% down · 7.5% · 30yr · 1.5% tax · 5.0% vac · 8.0% maint · 8.0% mgmt
Financing live
Cash to close
- Down payment
- $33,750
- Closing costs
- $4,050
- Reserves months
- —
- Total cash needed
- —
Loan-product check · same deal, 3 products live
Conventional
25% down · 7.5% · 30yr
- Down + closing
- —
- Monthly P&I
- —
- Monthly cashflow
- —
- DSCR
- —
- Eligible?
- —
Personal DTI + credit; lowest rate.
DSCR
20% down · 8.5% · 30yr
- Down + closing
- —
- Monthly P&I
- —
- Monthly cashflow
- —
- DSCR
- —
- Eligible?
- —
No personal income docs; deal must DSCR.
Hard money
10% down · 12.0% · 12mo
- Down + closing
- —
- Monthly P&I
- —
- Monthly cashflow
- —
- DSCR
- —
- Eligible?
- —
Short-term bridge; refi at stabilization.
Listing history 21 events
-
2026-06-18days on market $135,000 Active 65 DOM
-
2026-06-17days on market $135,000 Active 64 DOM
-
2026-06-16days on market $135,000 Active 63 DOM
-
2026-06-15days on market $135,000 Active 62 DOM
-
2026-06-13days on market $135,000 Active 60 DOM
-
2026-06-12days on market $135,000 Active 59 DOM
-
2026-06-09days on market $135,000 Active 56 DOM
-
2026-06-08days on market $135,000 Active 55 DOM
-
2026-06-07days on market $135,000 Active 54 DOM
-
2026-06-07days on market $135,000 Active 53 DOM
-
2026-06-04days on market $135,000 Active 50 DOM
-
2026-06-02days on market $135,000 Active 49 DOM
-
2026-06-01days on market $135,000 Active 48 DOM
-
2026-05-31days on market $135,000 Active 47 DOM
-
2026-04-14$135,000 Active 966-char remark
Show marketing remark (966 chars)
Welcome to 119 Chestnut Street in the Village of Gowanda, an income producing property offering strong updates and great investment potential. Both the upper and lower apartments have been recently refreshed with new paint, updated flooring, and fully remodeled bathrooms. The lower unit features all new windows installed in 2025, a recently serviced and flushed hot water tank, and a back porch finished with low maintenance Trex decking, adding great tenant appeal. The upper apartment also includes a newer hot water tank. Major mechanical and exterior improvements provide peace of mind, including a newer metal roof (installed prior to current ownership), a brand-new gutter system in 2025 (approximately $12,000 investment), and updated glass block windows in the basement. Whether you're looking to expand your portfolio or owner occupy while generating rental income, this property offers a strong combination of updates, functionality, and long-term value.
-
2021-02-16soldstatus $45,000
-
2021-01-29soldstatus $43,701
-
2010-09-30soldstatus $50,000 383-char remark
Show marketing remark (383 chars)
Investors Delight! Income property. Zoned Residential and Huge lot is zoned Commercial! Ton's of possibilities. Two family home w/ Bright large rooms. New roof in 2009, furnaces 2 yr old, newer hot water tanks, newer carpeting, 9 ft attic with fan and 24 inches of insulation. Detached garage and detached work shop. Lot widens out in back , zoned commercial and is partially fenced.
-
2010-09-30soldstatus $50,000
Show marketing remark (383 chars)
Investors Delight! Income property. Zoned Residential and Huge lot is zoned Commercial! Ton's of possibilities. Two family home w/ Bright large rooms. New roof in 2009, furnaces 2 yr old, newer hot water tanks, newer carpeting, 9 ft attic with fan and 24 inches of insulation. Detached garage and detached work shop. Lot widens out in back , zoned commercial and is partially fenced.
-
2010-07-13$55,000 383-char remark
Show marketing remark (383 chars)
Investors Delight! Income property. Zoned Residential and Huge lot is zoned Commercial! Ton's of possibilities. Two family home w/ Bright large rooms. New roof in 2009, furnaces 2 yr old, newer hot water tanks, newer carpeting, 9 ft attic with fan and 24 inches of insulation. Detached garage and detached work shop. Lot widens out in back , zoned commercial and is partially fenced.
-
2001-12-11soldstatus $39,000
ⓘ Source: listings_history table (triggers on properties + properties_extension) + one-shot
backfill from property_details.listing_events for pre-trigger history.
Tax reassessment forecast NY · Partial reset (capped growth)
- Current annual tax
- $2,099 · $175/mo
- Projected year-2 tax
- $2,190 · $183/mo
- Expected delta
- +$91/yr (+$8/mo · 4.4%)
ⓘ Screening estimate from a state-policy table — verify with the county assessor before closing.
Nearby sold comps map
Loading sold comps map…
Walkable amenities ~0.75 mi
Loading nearby amenities…
Taxation est. · year 1
- Rental income
- $26,844
- − Mortgage interest
- −$7,562
- − Property taxes
- −$2,099
- − Insurance
- −$675
- − Repairs & maintenance
- −$2,148
- − Management
- −$2,148
- − Depreciation
- −$3,927
- Taxable income
- $8,286
- Est. tax owed @ 24.0%
- −$1,989
- After-tax cash flow
- $7,949/yr
For passive investors: Depreciation is non-cash, so a rental often shows a tax loss while cash-flowing — sheltering income. Rental losses are passive: they offset passive income freely, and up to $25,000/yr can offset ordinary (W-2) income if you actively participate and your MAGI is under $100k (phasing out to $0 by $150k); unused losses carry forward. On sale, claimed depreciation is recaptured at up to 25%, and gains may owe capital-gains tax (a 1031 exchange can defer both). Figures are a year-1 estimate at your 24.0% rate — not tax advice; consult a CPA.
Schools (NCES district)
- District
- Gowanda Central School District
- NCES district ID
- 3612390
- Math proficiency
- 38% ▼ -13.00%
- Reading proficiency
- 44% ▲ 3.00%
- Median HH income
- $43,777
- Composite
- 34.71/100
- National rank
- #5138
- State rank
- #513 of 590 in NY
Livability — Gowanda
- Score
- 70/100
- State rank
- #457
- US rank
- #7988
Category grades
Schools grade is shown separately in the Schools card above.
Census & demographics
- Census place
- Gowanda, NY
- Population (ZIP)
- 5,437
Population outlook (Cattaraugus County) Hauer SSP2
- Today (2025)
- 71,623 people
- By 2030
- 67,751 · -5.4%
- By 2040
- 59,488 · -16.9%
- By 2050
- 51,601 · -28.0%
- By 2075
- 35,025 · -51.1%
- By 2100
- 21,243 · -70.3%
Race, ethnicity, and origin ACS 2023
- Neighborhood character
- Predominantly White (81%)
- Race & ethnicity
- White 81% Native American 10% Hispanic / Latino 5% Two or more races 3% Black 1%
- Hispanic origin (detail)
- Puerto Rican 4%
- Common ancestry
- Romanian 9% Italian 3% Slovak 2%
- Foreign-born
- 3% · Canada
- Languages at home
- 94% English-only · Spanish 3% German/W. Germanic 1%
Political lean MEDSL · Cattaraugus
- 2024 margin
- Solid R (+32.8) · D 33.6% · R 66.4%
- 2008→2024 swing
- -22.2pp toward R · 2008: -10.6pp · 2024: -32.8pp
- All cycles
- 2024: R+32.8 2020: R+29.5 2016: R+34.4 2012: R+13.4 2008: R+10.6
Not yet ingested
- Civics
- —
Market trends
- HPI YoY
- ▲ 21.64%
- Current HPI
- 269.1092
- Rent YoY
- —
- Metro
- —
- State GDP YoY
- ▲ 2.60%
- F500 in state
- 92
Industry mix (Fortune 500 HQ in NY)
| Industry | F500 HQs | Revenue |
|---|---|---|
| Financial Services | 10 | $950B |
|
||
| Consumer Goods | 9 | $162B |
|
||
| Insurance | 4 | $225B |
|
||
| Telecommunications | 2 | $144B |
|
||
| Pharmaceuticals | 2 | $112B |
|
||
| Media / Entertainment | 2 | $69B |
|
||
Price history
+246.2% since first listed7 events — show timeline
- 2026-04-14 Listed $135,000 WNYREIS
- 2021-02-16 Sold (Public Records) $45,000 Public Records
- 2021-01-29 Sold (Public Records) $43,701 Public Records
- 2010-09-30 Sold (Public Records) $50,000 Public Records
- 2010-09-30 Sold (MLS) $50,000 WNYREIS
- 2010-07-13 Listed $55,000 WNYREIS
- 2001-12-11 Sold (Public Records) $39,000 Public Records
Property tax history
+0.7%/yrLatest (2025): $2,099 · -1.4% YoY. Source: county tax records.
Cash-flow waterfall
monthlySold comps — $/sqft
last 12 mo · ≤1 miLoading sold comps…