 Multi-family
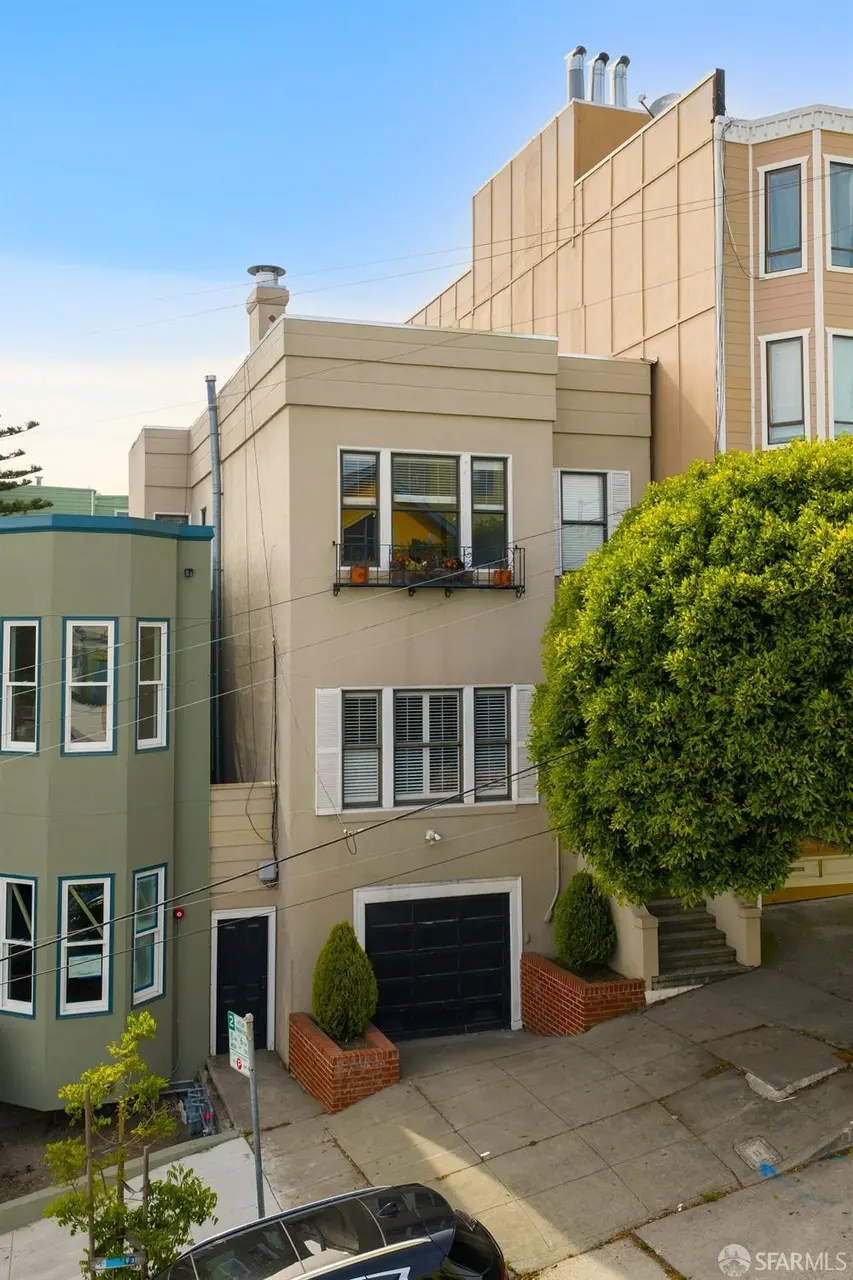
819 Lyon St · San Francisco, CA
Flood risk 1/10 · Minimal
- FEMA flood zone
- X (unshaded)
- Chance of flooding over 30 yrs
- 0.0%
- Est. flood insurance / yr
- $507 – $1,088
Fire risk 1/10 · Minimal
- Est. fire insurance / yr
- $659 – $1,223
Heat risk 2/10 · Minimal
- Hot days now (above 78°F)
- 7 days/yr
- Hot days in 30 yrs
- 17 days/yr
Wind risk 1/10 · Minimal
- Chance of severe wind over 30 yrs
- —
Air-quality risk 8/10 · Major
- Unhealthy air days now
- 15 days/yr
- Unhealthy air days in 30 yrs
- 15 days/yr
Risk factors via First Street. Map © Google.
Why this score? — see what drove the C grade
The composite is a weighted blend of 9 inputs, each scored 0–100. Each bar is that input's sub-score; the figure is the points it added to the 100-point composite (weight × sub-score).
- Cash flow +12.6/30.0
- ARV discount +12.6/15.0
- Appreciation +9.3/10.0
- Rent growth +5.0/5.0
- Schools +5.0/10.0
- Livability +3.8/5.0
- DSCR +3.7/10.0
- Condition / age +2.5/5.0
- 1% rule +2.2/10.0
$1,800,000
🖨 Deal sheet 📄 Offer letter ✓ Due diligence
Multi-family units
County records classify this as Multi-Family (2-4 Unit). Listing-text estimate: 1 unit. estimate disagrees with records
Listing remarks
819 Lyon Street is a classic San Francisco three-unit property offering tons of opportunity. The building consists of two one-bedroom unitsone vacant and one occupiedand a spacious two-story, two-bedroom, two-bath flat that will be delivered vacant, making it especially attractive for an owner-user. Interior features include grand 12-foot ceilings, wood floors, smart layouts, and partial views, while the main flat showcases a traditional living and dining room separated by elegant double parlor doors. The vacant one-bedroom has been refreshed with new engineered wood flooring, and the property benefits from a large, sun-filled backyard and a one-car garage delivered vacant. The roof was rep
Key facts
- Three unit property
- Wood floors
- Two story flat
Tags
Property features AI
Finance
- Other: Total living/building area reported as 3,322 (source: appraiser)
- Financial info: One unit currently leased; two units vacant
- HOA & community: No association fee
Exterior
- Parking: One independent parking space
- Security: No security features provided
- Utilities: No utility details provided
- Home design: Residential income property (triplex); Three-unit building; Built in 1900
- Construction: Year built 1900
- Exterior features: Lot has no special features listed
Interior
- Kitchen: No specific kitchen appliance details provided
- Bedrooms: Total of 4 bedrooms across the property; Unit breakdown: one 2-bedroom unit (owner's flat), two 1-bedroom units
- Flooring: No flooring details provided
- Bathrooms: Total of 1 bathroom reported (1 full bathroom); Unit breakdown: owner's flat is 2 baths (2br/2ba), other two units are 1 bath each
- Heating & cooling: No heating or cooling details provided
- Interior features: Owner's flat is a two-story unit; Property configured as three separate units (triplex); One unit is furnished: none (no furnished units)
- Laundry & utility: No laundry or utility appliance details provided
Neighborhood map
What this means for you Summary
Snapshot
- This is a 4-bed/4.0-bath multifamily listed at $1.80M.
Deal economics
- At list price, monthly cash flow is $-241 ($-3k/yr) — negative.
- To cash-flow at today's rent, offer at most $1.76M (2.4% below list).
- To meet the 1% rule (rent ≥ 1% of price), the offer needs to be $1.30M (27.5% below list).
- Recommended offer: $1.30M (27.5% below list) — sets the bar for 1% rule.
- Cap rate 6.1% vs local median 2.1% in San Francisco — top-decile yield for the area; either an underpriced asset or a hidden risk that comps aren't pricing in. Stress-test before assuming the spread holds.
Location & tenants
- Location reads 76/100 on livability (#90 in CA, #3,143 nationally) — a middle-class / working-renter tenant base. Strengths: amenities A+, commute A+, employment A+; Watch: crime F, cost of living F.
- San Francisco Unified (urban): math 50% / reading 56% proficiency, ranked #322 of 1,400 in CA (top 23%) — acceptable for families but not a draw, mixed tenant base, ~2y average lease.
- Market conditions: Rents rising fast (+20.6%/yr); 61 active listings in the ZIP; 17 comparable units currently listed for rent nearby; rentals at typical pace (median 18d on market — plan ~3-4 weeks tenant-placement turnaround); high-income renter base; 750 units permitted in San Francisco County in 2024 (688 in 5+ unit buildings).
- At $13,048/mo this rent would consume 103% of the median local household income ($152k/yr) (locally 2151% of renters already pay >50% of income on rent) — very limited rent-growth headroom before tenants either downsize or default.
Forward outlook
- In year one you build about $166k of equity ($12k loan paydown + $153k appreciation (8.5% local appreciation)).
- San Francisco County population projected at +39% by 2050 — long-run rental-demand tailwind backs the buy-and-hold thesis.
- By year 2, paydown + projected appreciation supports a ~$266k cash-out refi (75% LTV) — recoverable capital for the next deal without selling this one.
Negotiation context
- It's been on market 21 days — a 2% lower offer ($1.77M) is reasonable based on typical stale-listing flexibility.
Risks & watch-outs
- Watch-outs: built in 1900 — expect roof / HVAC / electrical / plumbing capex.
Questions for the listing agent
- What do current leases actually rent for vs. the listed asking? Can we see a recent rent roll and the last 12 months of T-12 income?
- Built in 1900 — when were the roof, HVAC, electrical panel, plumbing, and water heater last replaced?
- Is there a deadline driving the sale (1031 exchange, divorce, estate, relocation)? That informs how much negotiation room exists.
- Schools are B-rated — typically a magnet for longer-tenancy family renters. What's the average tenant stay here, and is there a school-zone premium baked into asking?
- Crime grade is F in this area — have there been break-ins, vandalism, or insurance claims at this property in the last 3 years? What carrier currently insures it and at what premium?
- What's the average days-on-market for RENTAL listings here right now (not sales)? A rising rental-DOM trend means longer vacancies and softer asking-rent achievability than the comps imply.
- What's the recent tenant-quality profile in this submarket — average credit score on applications, eviction rate, late-payment / NSF rate, and stable-employment percentage? A property-management company in the area should have these aggregated.
- How much new apartment / multifamily construction is in the pipeline within 1–3 miles? Heavy new supply (>2% of stock underway) typically softens rents 12–24 months out; light construction supports rent growth.
Investment metrics
- 1% rule
- 0.72% ✗
- Cap rate
- 6.13%
- Cash-on-cash
- -0.57%
- DSCR
- 0.97
- GRM
- 11.5
CMA / ARV
- ARV (median comp)
- $2,029,088
- List price
- $1,800,000
- Delta
- -11.29%
- Verdict
- UNDERPRICED
- Comps
- 20 within 1.0 mi
Show comp detail 12 sales within ~0.75 mi
| Address | Dist | Beds/Ba | Sqft | Sold | Price | $/sf | Match |
|---|---|---|---|---|---|---|---|
| 233 Central Ave | 0.49mi | 4/4.0 | 2,250 (-2%) | 6mo | $950,000 | $422 | 69 |
| 2825 Pine St | 0.54mi | 4/3.0 | 2,335 (+2%) | 4mo | $2,400,000 | $1,028 | 65 |
| 2013-2015 Golden Gate Ave | 0.07mi | 3/1.0 (-1) | 2,385 (+4%) | 10mo | $1,500,000 | $629 | 65 |
| 1904-1904 1/2 Golden Gate Ave | 0.09mi | 4/— | 2,600 (+13%) | 14mo | $1,600,000 | $615 | 63 |
| 2843-2845 Geary Blvd | 0.38mi | 3/2.0 (-1) | 2,400 (+4%) | 1mo | $1,525,000 | $635 | 61 |
| 2336-2338 Golden Gate Ave | 0.30mi | 4/— | 2,100 (-9%) | 18mo | $1,300,000 | $619 | 56 |
| 1451-1453 Hayes St | 0.37mi | 5/3.0 (+1) | 2,100 (-9%) | 6mo | $1,260,000 | $600 | 54 |
| 1343 Pierce St | 0.50mi | 4/— | 2,500 (+9%) | 13mo | $1,230,000 | $492 | 51 |
| 2342-2344 Golden Gate Ave | 0.31mi | 4/2.0 | 2,100 (-9%) | 18mo | $1,600,000 | $762 | 48 |
| 719 -721 Anza St | 0.57mi | 4/2.0 | 2,500 (+9%) | 15mo | $1,858,000 | $743 | 38 |
| 1059 Haight St | 0.60mi | 5/4.0 (+1) | 2,630 (+14%) | 8mo | $1,500,000 | $570 | 36 |
| 919-921 Grove St | 0.68mi | 4/2.0 | 2,106 (-8%) | 19mo | $1,640,000 | $779 | 30 |
Match score weights: distance 35% · size 25% · config 20% · recency 20%. Top-matched comps best support the ARV.
Projected returns pro-forma
8.52% appreciation · 8.0% rent growth · sell at horizon
- IRR
- 22.2%
- Equity multiple
- 2.69×
- Total profit
- $854,098
- Equity at exit
- $1,431,280
- IRR
- 21.5%
- Equity multiple
- 6.29×
- Total profit
- $2,665,655
- Equity at exit
- $2,904,156
Cash invested: $504,000 (down + closing). Projections, not guarantees.
Landlord ↔ Tenant lean methodology
- Overall (CITY)
- 0 Strongly Tenant-Friendly
- State California
- 18 Strongly Tenant-Friendly · D+13
- County
- — inherits STATE
- City San Francisco
- 0 Strongly Tenant-Friendly · D+57
ZIP-level market 94115
- Home prices YoY
- 3.9%
- Rents YoY
- 20.6%
- Active inventory
- 61
- Price-to-rent
- 35.4×
Monthly cashflow live
- Estimated rent
- $13,048 high interval (Pro) →
- Mortgage (P&I)
- −$9,439
- Tax from tax record
- −$359 /mo · $4,312/yr
- Insurance
- −$750
- HOA
- −$0
- Vacancy / Maint / Mgmt
- −$2,740
- Net cashflow
- $-241
Break-even live
3-unit breakdown (identical units grouped — click to expand)
| Units | Beds | Baths | Est. rent |
|---|---|---|---|
| 2× units | 1 | 1 | $8,464 |
| #1 | 1 | 1 | $4,232 |
| #2 | 1 | 1 | $4,232 |
| 1× unit | 2 | 2 | $4,585 |
| Total (3 units) | $13,048 | ||
UW: 25.0% down · 7.5% · 30yr · 1.5% tax · 5.0% vac · 8.0% maint · 8.0% mgmt
Financing live
Cash to close
- Down payment
- $450,000
- Closing costs
- $54,000
- Reserves months
- —
- Total cash needed
- —
Loan-product check · same deal, 3 products live
Conventional
25% down · 7.5% · 30yr
- Down + closing
- —
- Monthly P&I
- —
- Monthly cashflow
- —
- DSCR
- —
- Eligible?
- —
Personal DTI + credit; lowest rate.
DSCR
20% down · 8.5% · 30yr
- Down + closing
- —
- Monthly P&I
- —
- Monthly cashflow
- —
- DSCR
- —
- Eligible?
- —
No personal income docs; deal must DSCR.
Hard money
10% down · 12.0% · 12mo
- Down + closing
- —
- Monthly P&I
- —
- Monthly cashflow
- —
- DSCR
- —
- Eligible?
- —
Short-term bridge; refi at stabilization.
Rent comps 17 comps
| Address | Beds | Baths | Sqft | Rent | $/sqft | DOM | Units | Dist |
|---|---|---|---|---|---|---|---|---|
| 2577 Post St San Francisco, CA | 4.0 | 3.0 | 2754 | $15,000 | $5.45 | 2d | 1 | 0.32mi |
| 2156 Sutter St San Francisco, CA | 3.0 | 2.0 | 1900 | $9,995 | $5.26 | 24d | 1 | 0.65mi |
| 1436 Waller St Unit 1436 San Francisco, CA | 3.0 | 2.0 | 1800 | $6,890 | $3.83 | 43d | 1 | 0.70mi |
| 447 Spruce St San Francisco, CA | 3.0 | 1.0 | 1640 | $8,595 | $5.24 | 43d | 1 | 0.75mi |
| 643 Cole St San Francisco, CA | 3.0 | 1.5 | 1600 | $5,245 | $3.28 | 43d | 1 | 0.79mi |
| 124 Alpine Ter San Francisco, CA | 3.0 | 2.0 | 2200 | $11,995 | $5.45 | 13d | 1 | 0.80mi |
| 124 Alpine Ter San Francisco, CA | 3.0 | 2.0 | 2200 | $12,500 | $5.68 | 24d | 1 | 0.80mi |
| 124 Alpine Ter San Francisco, CA | 3.0 | 2.0 | 2200 | $11,995 | $5.45 | 10d | 1 | 0.80mi |
| 82 Parnassus Ave San Francisco, CA | 3.0 | 1.0 | 1701 | $2,800 | $1.65 | 1d | 1 | 1.00mi |
| 143 4th Ave San Francisco, CA | 3.0 | 2.5 | 1668 | $10,500 | $6.29 | 43d | 1 | 1.13mi |
| 1961 California St San Francisco, CA | 3.0 | 2.0 | 1838 | $6,079 | $3.31 | 43d | 1 | 1.20mi |
| 143 Corbett Ave San Francisco, CA | 4.0 | 4.0 | 2500 | $10,500 | $4.20 | 43d | 1 | 1.22mi |
| 623 8th Ave Unit 623 San Francisco, CA | 3.0 | 1.5 | 1660 | $6,295 | $3.79 | 5d | 1 | 1.24mi |
| 2090 Green St San Francisco, CA | 3.0 | 1.5 | 2000 | $12,995 | $6.50 | 10d | 1 | 1.34mi |
| 1265 Stanyan St San Francisco, CA | 3.0 | 2.0 | 2005 | $13,900 | $6.93 | 7d | 1 | 1.36mi |
| 270 Eureka St San Francisco, CA | 3.0 | 1.0 | 2024 | $6,995 | $3.46 | 2d | 1 | 1.49mi |
| 2335 Francisco St San Francisco, CA | 3.0 | 3.0 | 2100 | $11,995 | $5.71 | 17d | 1 | 1.50mi |
Listing history 2 events
-
2026-05-01$1,800,000 Active 930-char remark
-
2022-07-23price $2,595
ⓘ Source: listings_history table (triggers on properties + properties_extension) + one-shot
backfill from property_details.listing_events for pre-trigger history.
Tax reassessment forecast CA · Resets to sale price
- Current annual tax
- $4,312 · $359/mo
- Projected year-2 tax
- $13,680 · $1,140/mo
- Expected delta
- +$9,368/yr (+$781/mo · 217.3%)
ⓘ Screening estimate from a state-policy table — verify with the county assessor before closing.
Climate risk First Street
- Flood 1/10 Low FEMA zone X (unshaded) · 0% chance over 30 yrs
- Wildfire 1/10 Low
- Heat 2/10 Low 7 d/yr ≥78°F today · 17 d/yr by 30 yrs out
- Wind 1/10 Low
- Air quality 8/10 Severe 15 unhealthy d/yr today · 15 by 30 yrs out
Nearby sold comps map
Loading sold comps map…
Walkable amenities ~0.75 mi
Loading nearby amenities…
Taxation est. · year 1
- Rental income
- $156,576
- − Mortgage interest
- −$100,828
- − Property taxes
- −$4,312
- − Insurance
- −$9,000
- − Repairs & maintenance
- −$12,526
- − Management
- −$12,526
- − Depreciation
- −$52,364
- Taxable loss
- −$34,979
- Est. tax savings @ 24.0%
- +$8,395
- After-tax cash flow
- $5,506/yr
For passive investors: Depreciation is non-cash, so a rental often shows a tax loss while cash-flowing — sheltering income. Rental losses are passive: they offset passive income freely, and up to $25,000/yr can offset ordinary (W-2) income if you actively participate and your MAGI is under $100k (phasing out to $0 by $150k); unused losses carry forward. On sale, claimed depreciation is recaptured at up to 25%, and gains may owe capital-gains tax (a 1031 exchange can defer both). Figures are a year-1 estimate at your 24.0% rate — not tax advice; consult a CPA.
Schools (NCES district)
- District
- San Francisco Unified
- NCES district ID
- 0634410
- Math proficiency
- 50% ▬ 0.00%
- Reading proficiency
- 56% ▲ 1.00%
- Median HH income
- $81,249
- Composite
- 50.14/100
- National rank
- #4088
- State rank
- #322 of 1400 in CA
Livability — San Francisco
- Score
- 76/100
- State rank
- #90
- US rank
- #3143
Category grades
Schools grade is shown separately in the Schools card above.
Census & demographics
- Census place
- San Francisco, CA
- County
- San Francisco County · 827,552 people
- City population
- 827,552
- Metro
- San Francisco-Oakland-Berkeley, CA
- Population (ZIP)
- 32,629
- Household income
- $151,524
- Rent vs Own
- Severe rent burden
- 2151.0
Population outlook (San Francisco County) Hauer SSP2
- Today (2025)
- 1,030,936 people
- By 2030
- 1,110,409 · +7.7%
- By 2040
- 1,270,010 · +23.2%
- By 2050
- 1,435,001 · +39.2%
- By 2075
- 1,779,074 · +72.6%
- By 2100
- 1,966,767 · +90.8%
Race, ethnicity, and origin ACS 2023
- Neighborhood character
- Diverse neighborhood (Simpson 0.70)
- Race & ethnicity
- White 49% Asian 20% Two or more races 11% Hispanic / Latino 11% Black 10%
- Hispanic origin (detail)
- Mexican 6%
- Common ancestry
- Scotch-Irish 3% Romanian 3% Lithuanian 3%
- Foreign-born
- 26% · Canada, China, South Korea
- Languages at home
- 71% English-only · Spanish 6% Chinese 5% Russian/Polish/Slavic 3%
Political lean MEDSL · San Francisco
- 2024 margin
- Solid D (+64.8) · D 80.3% · R 15.5% · Other 4.1%
- 2008→2024 swing
- -5.7pp toward R · 2008: 70.5pp · 2024: 64.8pp
- All cycles
- 2024: D+64.8 2020: D+72.5 2016: D+76.1 2012: D+70.2 2008: D+70.5
Not yet ingested
- Civics
- —
Market trends
- HPI YoY
- ▲ 8.52%
- Current HPI
- 224.7175
- Rent YoY
- ▲ 20.62%
- Metro
- San Francisco-Oakland-Berkeley, CA
- State GDP YoY
- ▲ 3.21%
- F500 in state
- 116
Industry mix (Fortune 500 HQ in CA)
| Industry | F500 HQs | Revenue |
|---|---|---|
| Technology | 27 | $1,492B |
|
||
| Financial Services | 3 | $174B |
|
||
| Retail | 3 | $44B |
|
||
| Insurance | 3 | $26B |
|
||
| Media / Entertainment | 2 | $115B |
|
||
| Pharmaceuticals / Biotech | 2 | $62B |
|
||
Price history
+71190.9% since first listed4 events — show timeline
- 2026-05-29 Sold (MLS) $1,850,000 San Francisco MLS
- 2026-05-22 Pending — San Francisco MLS
- 2026-05-01 Listed $1,800,000 San Francisco MLS
- 2022-07-23 Price Changed $2,595 RENT.
Property tax history
+1.8%/yrLatest (2025): $4,312 · +3.2% YoY. Source: county tax records.
Cash-flow waterfall
monthlySold comps — $/sqft
last 12 mo · ≤1 miLoading sold comps…