 🔨 Auction
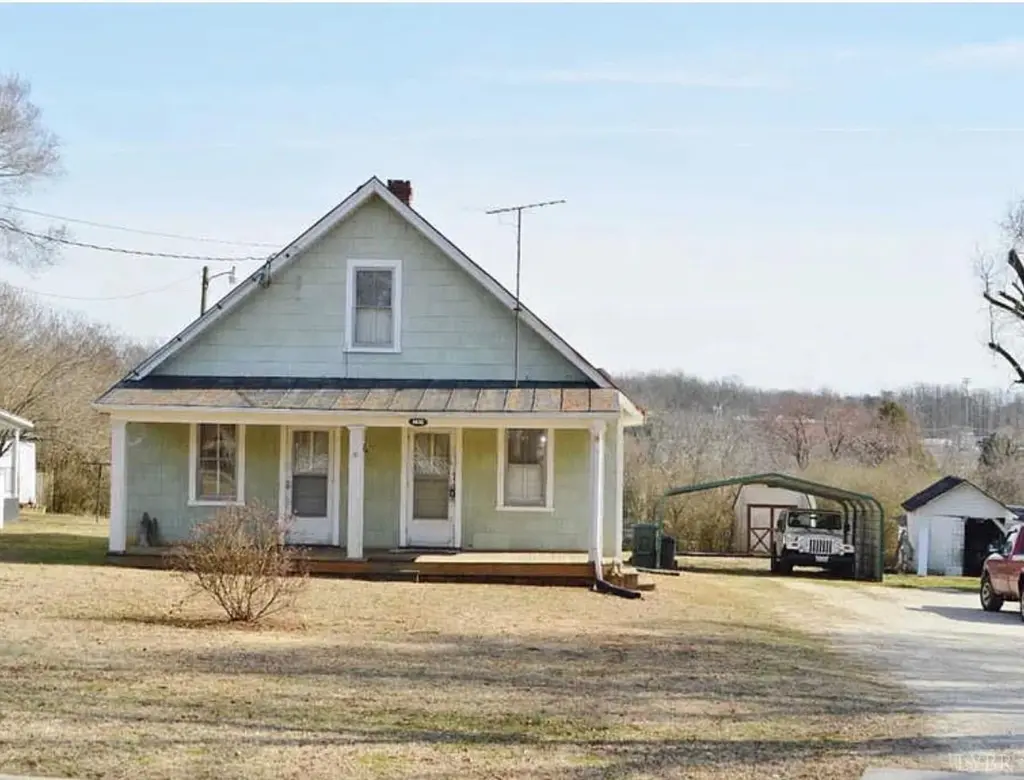
1432 Church St · Appomattox, VA
Flood risk 1/10 · Minimal
- FEMA flood zone
- X (unshaded)
- Chance of flooding over 30 yrs
- 0.0%
- Est. flood insurance / yr
- $507 – $1,088
Fire risk 5/10 · Moderate
- Est. fire insurance / yr
- $666 – $1,236
Heat risk 5/10 · Moderate
- Hot days now (above 102°F)
- 7 days/yr
- Hot days in 30 yrs
- 18 days/yr
Wind risk 3/10 · Minor
- Chance of severe wind over 30 yrs
- 5.0%
Air-quality risk 2/10 · Minimal
- Unhealthy air days now
- 0 days/yr
- Unhealthy air days in 30 yrs
- 1 days/yr
Risk factors via First Street. Map © Google.
Why this score? — see what drove the F grade
The composite is a weighted blend of 9 inputs, each scored 0–100. Each bar is that input's sub-score; the figure is the points it added to the 100-point composite (weight × sub-score).
- Appreciation +8.3/10.0
- ARV discount +7.5/15.0
- Schools +5.2/10.0
- Livability +3.9/5.0
- Cash flow +3.7/30.0
- Rent growth +2.5/5.0
- Condition / age +2.5/5.0
- 1% rule +0.1/10.0
- DSCR +0.0/10.0
$40,000
🖨 Deal sheet (PDF) 📄 Offer letter ✓ Due diligence
Listing remarks
* Attention Investors * This home is waiting for you to bring it back to life. This home sits on a nice level lot in a great location. Just minutes from Historic Appomattox. Property is going to Auction August 14th at 1:00 pm. Bidding will be both live and online on our website! Listing price is opening bid price.
Key facts
- 0.29 acre lot
- Built 1950
- Listed 8 days
Property features AI
Finance
- Financial info: Annual tax approximately $800
Exterior
- Parking: Off-street parking
- Home design: Single-family residence; One story
- Construction: Asbestos exterior material
- Exterior features: Metal roof; Lot of about 0.29 acres
Interior
- Flooring: Carpet; Vinyl
- Bathrooms: 1 full bathroom
- Heating & cooling: Heat pump
- Interior features: Electric water heater; Partial basement
- Laundry & utility: Laundry on the main level
Neighborhood map
What this means for you Summary
Snapshot
- This is a 3-bed/1.0-bath single-family listed at $40k.
Deal economics
- At list price, monthly cash flow is $-722 ($-9k/yr) — negative.
- The deal already cash-flows at list — no discount required.
- Meets the 1% rule at list price ($1k rent vs $40k).
Location & tenants
- Location reads 77/100 on livability (#98 in VA, #3,144 nationally) — a middle-class / working-renter tenant base. Strengths: crime A+, cost of living A+, health & safety A+; Watch: amenities F, commute F, employment F.
- Appomattox County Public School District (rural): math 53% / reading 69% proficiency, ranked #56 of 131 in VA (top 43%) — acceptable for families but not a draw, mixed tenant base, ~2y average lease.
- Zoned schools: Appomattox Elementary (math 50% / reading 65%, grade C+, #588 of 1,108 statewide, top 54%, 531 students, 74% FRL); Appomattox Middle (math 49% / reading 68%, grade B, #171 of 342 statewide, top 50%, 539 students, 74% FRL); Appomattox County High (math 77% / reading 87%, grade A, #40 of 319 statewide, top 15%, 699 students, 73% FRL) — zoned schools average 73% FRL vs 41% district-wide (32 pts higher); higher-poverty schools than district average — tighter screening recommended.
- Market conditions: 101 active listings in the ZIP; 95 units permitted in Appomattox County in 2024 (0 in 5+ unit buildings).
Forward outlook
- In year one you build about $18k of equity ($2k loan paydown + $16k appreciation (6.6% local appreciation)).
- Appomattox County population projected at +7% by 2050 — modest demand growth; plan on rents tracking national, not racing it.
- By year 3, paydown + projected appreciation supports a ~$44k cash-out refi (75% LTV) — recoverable capital for the next deal without selling this one.
Negotiation context
- Only 9 days on market — expect competitive offers; lowballing is unlikely to land.
- 4 sale attempts since 10y ago with the ask held roughly flat each time — persistent listings suggest the price (not the market) is what's stuck; bring a comps-based counter.
Risks & watch-outs
- Watch-outs: property tax is 9.3% of price; built in 1950 — expect roof / HVAC / electrical / plumbing capex.
- Climate carrying-cost: moderate wildfire risk; extreme-heat days projected 7→18/yr by 2055 (HVAC capex compounding) — expect insurance premiums to compound above CPI over the hold.
Questions for the listing agent
- What do current leases actually rent for vs. the listed asking? Can we see a recent rent roll and the last 12 months of T-12 income?
- Built in 1950 — when were the roof, HVAC, electrical panel, plumbing, and water heater last replaced?
- Property tax is high relative to price — has the assessment been appealed recently, and will the sale trigger a re-assessment?
- Is there a deadline driving the sale (1031 exchange, divorce, estate, relocation)? That informs how much negotiation room exists.
- Schools are A-rated — typically a magnet for longer-tenancy family renters. What's the average tenant stay here, and is there a school-zone premium baked into asking?
- The area grade is low — what's the realistic commute time and amenity access for the typical tenant pool here? Any planned neighborhood developments (good or bad) we should know about?
- What's the average days-on-market for RENTAL listings here right now (not sales)? A rising rental-DOM trend means longer vacancies and softer asking-rent achievability than the comps imply.
- What's the recent tenant-quality profile in this submarket — average credit score on applications, eviction rate, late-payment / NSF rate, and stable-employment percentage? A property-management company in the area should have these aggregated.
- How much new for-sale + rental construction is in the pipeline within 1–3 miles? Heavy new supply typically softens prices + rents 12–24 months out; constrained supply supports both.
Investment metrics
- 1% rule
- 0.51% ✗
- Cap rate
- 2.79%
- Cash-on-cash
- -12.51%
- DSCR
- 0.44
- GRM
- 16.5
CMA / ARV
- ARV (on-the-fly)
- $247,480
- Comps found
- 12
Show comp detail 12 sales within ~0.75 mi
| Address | Dist | Beds/Ba | Sqft | Sold | Price | $/sf | Match |
|---|---|---|---|---|---|---|---|
| 746 Church St | 0.64mi | 3/2.0 | 1,363 (+1%) | 2mo | $305,000 | $224 | 62 |
| 216 Avery Ln | 0.43mi | 4/3.0 (+1) | 1,430 (+6%) | 0mo | $373,400 | $261 | 56 |
| 310 Lee Grant Ave | 0.44mi | 3/1.0 | 1,225 (-9%) | 13mo | $225,500 | $184 | 54 |
| 4550 Pumping Station Rd | 0.67mi | 3/2.0 | 1,288 (-4%) | 7mo | $218,000 | $169 | 52 |
| 212 High St | 0.71mi | 4/1.5 (+1) | 1,431 (+6%) | 2mo | $115,000 | $80 | 48 |
| 583 Cornfield Ln | 0.72mi | 3/2.0 | 1,300 (-3%) | 12mo | $335,000 | $258 | 47 |
| 159 Second St | 0.69mi | 3/1.0 | 1,524 (+13%) | 2mo | $199,000 | $131 | 44 |
| 681 Cornfield Ln | 0.70mi | 3/2.0 | 1,500 (+12%) | 3mo | $290,000 | $193 | 42 |
| 682 Cornfield Ln | 0.70mi | 3/2.0 | 1,500 (+12%) | 4mo | $294,900 | $197 | 41 |
| 208 Lee Grant Ave | 0.52mi | 2/1.0 (-1) | 1,160 (-14%) | 8mo | $109,000 | $94 | 41 |
| 1110 Confederate Blvd Blvd | 0.68mi | 3/1.0 | 1,527 (+14%) | 7mo | $189,900 | $124 | 40 |
| 1289 Confederate Blvd | 0.62mi | 3/2.0 | 1,165 (-13%) | 6mo | $174,500 | $150 | 40 |
Match score weights: distance 35% · size 25% · config 20% · recency 20%. Top-matched comps best support the ARV.
Projected returns pro-forma
6.56% appreciation · 3.0% rent growth · sell at horizon
- IRR
- 6.9%
- Equity multiple
- 1.49×
- Total profit
- $33,701
- Equity at exit
- $164,347
- IRR
- 8.8%
- Equity multiple
- 2.92×
- Total profit
- $133,298
- Equity at exit
- $305,915
Cash invested: $69,294 (down + closing). Projections, not guarantees.
Landlord ↔ Tenant lean methodology
- Overall (STATE)
- 55 Moderately Landlord-Leaning
- State Virginia
- 55 Moderately Landlord-Leaning · D+2
- County
- — inherits STATE
- City
- — inherits STATE
ZIP-level market 24522
- Home prices YoY
- 3.3%
- Active inventory
- 101
- Price-to-rent
- 2.7×
Monthly cashflow live
- Estimated rent
- $1,250 medium interval (Pro) →
- Mortgage (P&I)
- −$1,298
- Tax est. 1.5%
- −$309 /mo · $3,712/yr
- Insurance
- −$103
- HOA
- −$0
- Vacancy / Maint / Mgmt
- −$263
- Net cashflow
- $-722
Break-even live
Sensitivity live
| Price | -10% $-313 | -5% $-383 | +0% $-722 | +5% $-808 | +10% $-894 |
|---|---|---|---|---|---|
| Rent | -10% $-821 | -5% $-772 | +0% $-722 | +5% $-673 | +10% $-624 |
| Rate | -1.0pp $-598 | -0.5pp $-660 | base $-722 | +0.5pp $-787 | +1.0pp $-852 |
UW: 25.0% down · 7.5% · 30yr · 1.5% tax · 5.0% vac · 8.0% maint · 8.0% mgmt
Financing live
Cash to close
- Down payment
- $61,870
- Closing costs
- $7,424
- Reserves months
- —
- Total cash needed
- —
Loan-product check · same deal, 3 products live
Conventional
25% down · 7.5% · 30yr
- Down + closing
- —
- Monthly P&I
- —
- Monthly cashflow
- —
- DSCR
- —
- Eligible?
- —
Personal DTI + credit; lowest rate.
DSCR
20% down · 8.5% · 30yr
- Down + closing
- —
- Monthly P&I
- —
- Monthly cashflow
- —
- DSCR
- —
- Eligible?
- —
No personal income docs; deal must DSCR.
Hard money
10% down · 12.0% · 12mo
- Down + closing
- —
- Monthly P&I
- —
- Monthly cashflow
- —
- DSCR
- —
- Eligible?
- —
Short-term bridge; refi at stabilization.
Listing history 8 events
-
2026-06-21days on market $40,000 Active 9 DOM
-
2026-06-19days on market $40,000 Active 7 DOM
-
2026-06-18days on market $40,000 Active 6 DOM
-
2026-06-17days on market $40,000 Active 5 DOM
-
2026-06-16days on market $40,000 Active 4 DOM
-
2026-06-15days on market $40,000 Active 3 DOM
-
2026-06-13remarks 316-char remark
-
2026-06-13$40,000 Active 1 DOM
ⓘ Source: listings_history table (triggers on properties + properties_extension) + one-shot
backfill from property_details.listing_events for pre-trigger history.
Tax reassessment forecast VA · Resets to sale price
- Current annual tax
- $481 · $40/mo
- Projected year-2 tax
- $481 · $40/mo
- Expected delta
- $0/yr ($0/mo · 0.0%)
ⓘ Screening estimate from a state-policy table — verify with the county assessor before closing.
Climate risk First Street
- Flood 1/10 Low FEMA zone X (unshaded) · 0% chance over 30 yrs
- Wildfire 5/10 Major
- Heat 5/10 Major 7 d/yr ≥102°F today · 18 d/yr by 30 yrs out
- Wind 3/10 Moderate 5% chance of damaging wind over 30 yrs
- Air quality 2/10 Low 0 unhealthy d/yr today · 1 by 30 yrs out
Nearby sold comps map
Loading sold comps map…
Walkable amenities ~0.75 mi
Loading nearby amenities…
Taxation est. · year 1
- Rental income
- $15,004
- − Mortgage interest
- −$13,863
- − Property taxes
- −$3,712
- − Insurance
- −$1,237
- − Repairs & maintenance
- −$1,200
- − Management
- −$1,200
- − Depreciation
- −$7,199
- Taxable loss
- −$13,408
- Est. tax savings @ 24.0%
- +$3,218
- After-tax cash flow
- $-5,452/yr
For passive investors: Depreciation is non-cash, so a rental often shows a tax loss while cash-flowing — sheltering income. Rental losses are passive: they offset passive income freely, and up to $25,000/yr can offset ordinary (W-2) income if you actively participate and your MAGI is under $100k (phasing out to $0 by $150k); unused losses carry forward. On sale, claimed depreciation is recaptured at up to 25%, and gains may owe capital-gains tax (a 1031 exchange can defer both). Figures are a year-1 estimate at your 24.0% rate — not tax advice; consult a CPA.
Schools (NCES district)
- District
- Appomattox County Public School District
- NCES district ID
- 5100240
- Math proficiency
- 53% ▼ -31.00%
- Reading proficiency
- 69% ▼ -8.00%
- Median HH income
- $50,059
- Composite
- 51.85/100
- National rank
- #1663
- State rank
- #56 of 131 in VA
Livability — Appomattox
- Score
- 77/100
- State rank
- #98
- US rank
- #3144
Category grades
Schools grade is shown separately in the Schools card above.
Census & demographics
- Census place
- Appomattox, VA
- Population (ZIP)
- 10,494
Population outlook (Appomattox County) Hauer SSP2
- Today (2025)
- 16,213 people
- By 2030
- 16,548 · +2.1%
- By 2040
- 17,047 · +5.1%
- By 2050
- 17,286 · +6.6%
- By 2075
- 17,710 · +9.2%
- By 2100
- 16,609 · +2.4%
Race, ethnicity, and origin ACS 2023
- Neighborhood character
- Predominantly White (75%)
- Race & ethnicity
- White 75% Black 19% Two or more races 3% Hispanic / Latino 2%
- Common ancestry
- Slovak 2% Italian 2% Serbian 1%
- Foreign-born
- 2% · Canada
- Languages at home
- 99% English-only · Spanish 0%
Political lean MEDSL · Appomattox
- 2024 margin
- Solid R (+51.0) · D 24.1% · R 75.1%
- 2008→2024 swing
- -21.4pp toward R · 2008: -29.6pp · 2024: -51.0pp
- All cycles
- 2024: R+51.0 2020: R+46.2 2016: R+46.4 2012: R+36.4 2008: R+29.6
Not yet ingested
- Civics
- —
Market trends
- HPI YoY
- ▲ 6.56%
- Current HPI
- 205.9082
- Rent YoY
- —
- Metro
- —
- State GDP YoY
- ▲ 2.40%
- F500 in state
- 50
Industry mix (Fortune 500 HQ in VA)
| Industry | F500 HQs | Revenue |
|---|---|---|
| Aerospace / Defense | 4 | $236B |
|
||
| Technology / Defense | 3 | $32B |
|
||
| Financial Services | 2 | $176B |
|
||
| Utilities | 2 | $27B |
|
||
| Insurance | 2 | $25B |
|
||
| Technology | 2 | $15B |
|
||
Price history
-49.9% since first listed4 events — show timeline
- 2026-06-12 Listed $40,000 LMLS
- 2018-02-19 Listed $73,000 LMLS
- 2017-06-28 Listed $69,900 LMLS
- 2016-07-25 Listed $79,900 LMLS
Property tax history
+0.3%/yrLatest (2025): $481 · +0.0% YoY. Source: county tax records.
Cash-flow waterfall
monthlySold comps — $/sqft
last 12 mo · ≤1 miLoading sold comps…