 🌊 Lakefront
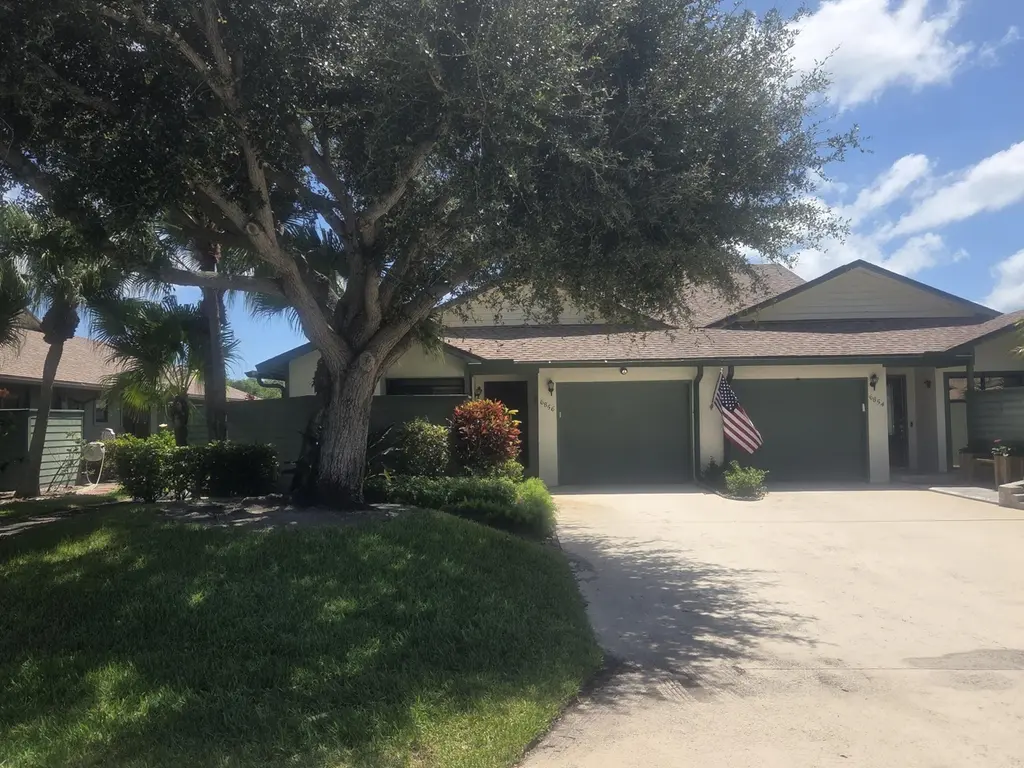
6856 SE Bunker Hill Dr · Hobe Sound, FL
Flood risk 1/10 · Minimal
- FEMA flood zone
- X (unshaded)
- Chance of flooding over 30 yrs
- 0.0%
- Est. flood insurance / yr
- $507 – $1,088
Fire risk 2/10 · Minimal
- Est. fire insurance / yr
- $947 – $1,759
Heat risk 10/10 · Severe
- Hot days now (above 106°F)
- 7 days/yr
- Hot days in 30 yrs
- 26 days/yr
Wind risk 10/10 · Severe
- Chance of severe wind over 30 yrs
- 99.0%
Air-quality risk 2/10 · Minimal
- Unhealthy air days now
- 1 days/yr
- Unhealthy air days in 30 yrs
- 1 days/yr
Risk factors via First Street. Map © Google.
Why this score? — see what drove the C grade
The composite is a weighted blend of 9 inputs, each scored 0–100. Each bar is that input's sub-score; the figure is the points it added to the 100-point composite (weight × sub-score).
- Cash flow +17.4/30.0
- ARV discount +15.0/15.0
- 1% rule +6.7/10.0
- DSCR +5.4/10.0
- Schools +4.5/10.0
- Livability +3.5/5.0
- Rent growth +3.0/5.0
- Condition / age +2.5/5.0
- Appreciation +0.0/10.0
$239,000
🖨 Deal sheet 📄 Offer letter ✓ Due diligence
Listing remarks
Welcome to your waterfront Villa in Bunker Hill at Heritage Ridge East, located in the charming community of Hobe Sound, Florida. This single-story residence offers 1,384 square feet of living space with two comfortable bedrooms and two full bathrooms, providing an efficient and well-appointed layout. The one-car garage adds convenient covered parking and storage. As a waterfront property, this home captures the appeal of waterside living in this established community. The thoughtful floor plan makes excellent use of the available square footage, offering practicality for everyday living and entertaining. This villa presents an excellent opportunity for those seeking to renovate a waterfro
Key facts
- Waterfront villa
- $546 HOA
- Garage
Tags
Property features AI
Finance
- Other: Pets allowed with number/size limits
- HOA & community: Association: Bunker Hill POA (also referenced: heritage Ridge North POA); Monthly HOA fee ($505); Association amenities include clubhouse, golf course, and pool; HOA covers cable TV, structure maintenance, common areas, common real estate tax, reserve funds, and roof repairs
Exterior
- Parking: Attached garage with garage door opener; Covered parking space; Two open parking spaces (three total parking spaces)
- Security: Smoke detector(s)
- Utilities: Public water; Public sewer; Electricity connected; Cable available; Water connected; Sewer connected
- Home design: Condominium; One story; Resale condition; Facing west
- Construction: Frame and stucco construction; Composition/shingle roof; Built area reported from appraiser
- Exterior features: Covered patio; Patio; Waterfront property (no specific waterfront features listed)
Interior
- Kitchen: Disposal; Dishwasher; Electric range; Microwave; Refrigerator
- Bedrooms: Two main-level bedrooms
- Flooring: Carpet; Ceramic tile / tile
- Bathrooms: Two full bathrooms on the main level
- Heating & cooling: Central heating (heat pump); Central air conditioning; Ceiling fan(s)
- Interior features: Cathedral ceilings and vaulted ceiling areas; High ceilings; Walk-in closet(s); Skylight(s)
- Laundry & utility: Laundry room with washer/dryer area inside; Laundry hook-ups located in the garage
Neighborhood map
What this means for you Summary
Snapshot
- This is a 2-bed/2.0-bath single-family listed at $239k.
Deal economics
- At list price, monthly cash flow is $179 ($2k/yr) — positive.
- The deal already cash-flows at list — no discount required.
- Meets the 1% rule at list price ($3k rent vs $239k).
- Cap rate 7.2% vs local median 3.5% in Hobe Sound — top-decile yield for the area; either an underpriced asset or a hidden risk that comps aren't pricing in. Stress-test before assuming the spread holds.
Location & tenants
- Location reads 69/100 on livability (#497 in FL) — a middle-class / working-renter tenant base. Strengths: housing A+, crime A, cost of living A; Watch: employment C-, amenities F, commute F.
- Martin (suburban): math 52% / reading 53% proficiency, ranked #24 of 73 in FL (top 33%) — acceptable for families but not a draw, mixed tenant base, ~2y average lease.
- Zoned schools: Murray Middle School (math 45% / reading 43%, grade D, #327 of 571 statewide, top 57%, 616 students, 69% FRL); South Fork High School (math 36% / reading 48%, grade F, #275 of 667 statewide, top 42%, 1,810 students, 51% FRL) — zoned schools average 60% FRL vs 41% district-wide (19 pts higher); higher-poverty schools than district average — tighter screening recommended.
- Market conditions: Rents rising (+1.8%/yr); 279 active listings in the ZIP; 18 comparable units currently listed for rent nearby; rentals at typical pace (median 23d on market — plan ~3-4 weeks tenant-placement turnaround); 737 units permitted in Martin County in 2024 (167 in 5+ unit buildings).
- At $2,785/mo this rent would consume 47% of the median local household income ($70k/yr) (locally 317% of renters already pay >50% of income on rent) — very limited rent-growth headroom before tenants either downsize or default.
Forward outlook
- Local home prices are declining (-3.0%/yr); year-one equity from $2k of loan paydown is wiped out by about $7k of value loss. Plan a longer hold.
- Martin County population projected at +19% by 2050 — long-run rental-demand tailwind backs the buy-and-hold thesis.
Negotiation context
- Only 10 days on market — expect competitive offers; lowballing is unlikely to land.
- Current owner paid $105k; list at $239k implies a 128% gain — meaningful room to come down on a strong offer.
Risks & watch-outs
- Climate carrying-cost: severe wind risk, 99% chance of damaging wind over 30y; extreme-heat days projected 7→26/yr by 2055 (HVAC capex compounding) — expect insurance premiums to compound above CPI over the hold.
Questions for the listing agent
- What does the HOA fee cover, when was the last increase, and are there any pending special assessments or reserve-fund shortfalls?
- Is there a deadline driving the sale (1031 exchange, divorce, estate, relocation)? That informs how much negotiation room exists.
- This sits on a lake — are riparian / water-frontage rights deeded with the parcel? Any dock permits, shoreline easements, or HOA water-use restrictions?
- What's the documented flood / surge / shoreline-erosion history here (FEMA AND non-FEMA — e.g., storm surge, creek backup, septic-field saturation)?
- Any water-quality or seasonal algae-bloom issues that affect tenant satisfaction or short-term-rental demand?
- What's the average days-on-market for RENTAL listings here right now (not sales)? A rising rental-DOM trend means longer vacancies and softer asking-rent achievability than the comps imply.
- What's the recent tenant-quality profile in this submarket — average credit score on applications, eviction rate, late-payment / NSF rate, and stable-employment percentage? A property-management company in the area should have these aggregated.
- How much new for-sale + rental construction is in the pipeline within 1–3 miles? Heavy new supply typically softens prices + rents 12–24 months out; constrained supply supports both.
Investment metrics
- 1% rule
- 1.17% ✓
- Cap rate
- 7.19%
- Cash-on-cash
- 3.21%
- DSCR
- 1.14
- GRM
- 7.2
CMA / ARV
- ARV (on-the-fly)
- $362,608
- Comps found
- 12
Show comp detail 12 sales within ~0.75 mi
| Address | Dist | Beds/Ba | Sqft | Sold | Price | $/sf | Match |
|---|---|---|---|---|---|---|---|
| 6756 SE Bunker Hill Dr | 0.15mi | 2/2.0 | 1,384 (0%) | 2mo | $339,000 | $245 | 91 |
| 6785 SE Bunker Hill Dr | 0.11mi | 2/2.0 | 1,384 (0%) | 10mo | $325,000 | $235 | 86 |
| 6854 SE Bunker Hill Dr | 0.01mi | 2/2.0 | 1,384 (0%) | 19mo | $302,000 | $218 | 84 |
| 6796 SE Yorktown Dr | 0.19mi | 2/2.0 | 1,309 (-5%) | 4mo | $310,000 | $237 | 79 |
| 6639 SE Yorktown Dr | 0.29mi | 2/2.0 | 1,338 (-3%) | 4mo | $365,000 | $273 | 78 |
| 6787 SE Yorktown Dr | 0.16mi | 2/2.0 | 1,365 (-1%) | 17mo | $362,000 | $265 | 76 |
| 6677 SE Yorktown Dr | 0.25mi | 2/2.0 | 1,338 (-3%) | 16mo | $350,000 | $262 | 69 |
| 6893 SE Bunker Hill Dr | 0.05mi | 3/2.0 (+1) | 1,587 (+15%) | 1mo | $410,000 | $258 | 67 |
| 6140 SE Georgetown Pl | 0.55mi | 2/2.0 | 1,282 (-7%) | 7mo | $285,000 | $222 | 56 |
| 5713 SE Kawana Trl | 0.63mi | 2/2.0 | 1,500 (+8%) | 2mo | $512,000 | $341 | 55 |
| 6264 SE Ames Way | 0.41mi | 3/2.0 (+1) | 1,556 (+12%) | 14mo | $432,000 | $278 | 43 |
| 7843 SE Lexington Ave | 0.61mi | 3/2.0 (+1) | 1,534 (+11%) | 12mo | $425,000 | $277 | 39 |
Match score weights: distance 35% · size 25% · config 20% · recency 20%. Top-matched comps best support the ARV.
Projected returns pro-forma
-3.0% appreciation · 1.8% rent growth · sell at horizon
- IRR
- -12.7%
- Equity multiple
- 0.55×
- Total profit
- $-30,363
- Equity at exit
- $35,636
- IRR
- -5.9%
- Equity multiple
- 0.64×
- Total profit
- $-23,953
- Equity at exit
- $20,664
Cash invested: $66,920 (down + closing). Projections, not guarantees.
Landlord ↔ Tenant lean methodology
- Overall (STATE)
- 87 Strongly Landlord-Friendly
- State Florida
- 87 Strongly Landlord-Friendly · R+3
- County
- — inherits STATE
- City
- — inherits STATE
ZIP-level market 33455
- Rents YoY
- 1.8%
- Active inventory
- 279
- Price-to-rent
- 7.2×
Monthly cashflow live
- Estimated rent
- $2,785 high interval (Pro) →
- Mortgage (P&I)
- −$1,253
- Tax from tax record
- −$122 /mo · $1,460/yr
- Insurance
- −$100
- HOA
- −$546
- Vacancy / Maint / Mgmt
- −$585
- Net cashflow
- $179
Break-even live
UW: 25.0% down · 7.5% · 30yr · 1.5% tax · 5.0% vac · 8.0% maint · 8.0% mgmt
Financing live
Cash to close
- Down payment
- $59,750
- Closing costs
- $7,170
- Reserves months
- —
- Total cash needed
- —
Loan-product check · same deal, 3 products live
Conventional
25% down · 7.5% · 30yr
- Down + closing
- —
- Monthly P&I
- —
- Monthly cashflow
- —
- DSCR
- —
- Eligible?
- —
Personal DTI + credit; lowest rate.
DSCR
20% down · 8.5% · 30yr
- Down + closing
- —
- Monthly P&I
- —
- Monthly cashflow
- —
- DSCR
- —
- Eligible?
- —
No personal income docs; deal must DSCR.
Hard money
10% down · 12.0% · 12mo
- Down + closing
- —
- Monthly P&I
- —
- Monthly cashflow
- —
- DSCR
- —
- Eligible?
- —
Short-term bridge; refi at stabilization.
Rent comps 18 comps
| Address | Beds | Baths | Sqft | Rent | $/sqft | DOM | Units | Dist |
|---|---|---|---|---|---|---|---|---|
| 6845 SE Bunker Hill Dr Hobe Sound, FL | 2.0 | 2.0 | 1552 | $3,500 | $2.26 | 13d | 1 | 0.04mi |
| 7445 SE Independence Ave Hobe Sound, FL | 2.0 | 2.0 | 1198 | $1,900 | $1.59 | 23d | 1 | 0.39mi |
| 7442 SE Jamestown Ter Hobe Sound, FL | 2.0 | 2.0 | 1384 | $1,800 | $1.30 | 23d | 1 | 0.43mi |
| 7462 SE Jamestown Ter Hobe Sound, FL | 2.0 | 2.0 | 1384 | $2,500 | $1.81 | 23d | 1 | 0.47mi |
| 6215 SE Georgetown Pl Hobe Sound, FL | 2.0 | 2.0 | 1202 | $2,600 | $2.16 | 23d | 1 | 0.48mi |
| 7568 SE Swan Ave Hobe Sound, FL | 2.0 | 2.0 | 1052 | $2,300 | $2.19 | 23d | 1 | 0.60mi |
| 6024 SE Crooked Oak Ave Hobe Sound, FL | 3.0 | 2.0 | 1800 | $3,200 | $1.78 | 23d | 1 | 0.80mi |
| 7894 SE Saratoga Dr Hobe Sound, FL | 2.0 | 2.0 | 1248 | $2,100 | $1.68 | 23d | 1 | 0.81mi |
| 8002 SE Skylark Ave Hobe Sound, FL | 3.0 | 2.0 | 990 | $2,000 | $2.02 | 23d | 1 | 1.07mi |
| 5152 SE Club Way #104 Stuart, FL | 2.0 | 2.0 | 1358 | $7,500 | $5.52 | 13d | 1 | 1.20mi |
| 5636 SE Foxcross Pl Stuart, FL | 2.0 | 2.0 | 1598 | $9,000 | $5.63 | 13d | 1 | 1.26mi |
| 8350 SE Sweetbay Dr Hobe Sound, FL | 2.0 | 2.0 | 1606 | $3,500 | $2.18 | 23d | 1 | 1.27mi |
| 5156 SE Mariner Garden Cir Stuart, FL | 3.0 | 2.5 | 1434 | $2,400 | $1.67 | 23d | 1 | 1.27mi |
| 5064 SE Mariner Garden Cir Stuart, FL | 3.0 | 2.5 | 1530 | $2,400 | $1.57 | 23d | 1 | 1.28mi |
| 5176 SE Mariner Garden Cir Stuart, FL | 3.0 | 2.5 | 1554 | $2,400 | $1.54 | 23d | 1 | 1.29mi |
| 4987 SE Mariner Garden Cir Stuart, FL | 3.0 | 2.5 | 1434 | $2,650 | $1.85 | 23d | 1 | 1.32mi |
| 7030 SE Ridgeway Ter Hobe Sound, FL | 3.0 | 2.0 | 1296 | $2,500 | $1.93 | 23d | 1 | 1.33mi |
| 5359 SE Dell St Stuart, FL | 3.0 | 2.0 | 1272 | $2,800 | $2.20 | 23d | 1 | 1.48mi |
HOA detail
- Monthly dues
- $546 · $6,552/yr
- Likely covers
- water
Listing history 9 events
-
2026-06-18days on market $239,000 Active 10 DOM
-
2026-06-17days on market $239,000 Active 9 DOM
-
2026-06-16days on market $239,000 Active 8 DOM
-
2026-06-15days on market $239,000 Active 7 DOM
-
2026-06-14days on market $239,000 Active 5 DOM
-
2026-06-13days on market $239,000 Active 4 DOM
-
2026-06-10days on market $239,000 Active 2 DOM
-
2026-06-09remarks 699-char remark
-
2026-06-09$239,000 Active 1 DOM
ⓘ Source: listings_history table (triggers on properties + properties_extension) + one-shot
backfill from property_details.listing_events for pre-trigger history.
Tax reassessment forecast FL · Resets to sale price
- Current annual tax
- $1,460 · $122/mo
- Projected year-2 tax
- $1,984 · $165/mo
- Expected delta
- +$524/yr (+$44/mo · 35.9%)
ⓘ Screening estimate from a state-policy table — verify with the county assessor before closing.
Climate risk First Street
- Flood 1/10 Low FEMA zone X (unshaded) · 0% chance over 30 yrs
- Wildfire 2/10 Low
- Heat 10/10 Extreme 7 d/yr ≥106°F today · 26 d/yr by 30 yrs out
- Wind 10/10 Extreme 99% chance of damaging wind over 30 yrs
- Air quality 2/10 Low 1 unhealthy d/yr today · 1 by 30 yrs out
Nearby sold comps map
Loading sold comps map…
Walkable amenities ~0.75 mi
Loading nearby amenities…
Taxation est. · year 1
- Rental income
- $33,416
- − Mortgage interest
- −$13,388
- − Property taxes
- −$1,460
- − Insurance
- −$1,195
- − Repairs & maintenance
- −$2,673
- − Management
- −$2,673
- − HOA
- −$6,552
- − Depreciation
- −$6,953
- Taxable loss
- −$1,478
- Est. tax savings @ 24.0%
- +$355
- After-tax cash flow
- $2,506/yr
For passive investors: Depreciation is non-cash, so a rental often shows a tax loss while cash-flowing — sheltering income. Rental losses are passive: they offset passive income freely, and up to $25,000/yr can offset ordinary (W-2) income if you actively participate and your MAGI is under $100k (phasing out to $0 by $150k); unused losses carry forward. On sale, claimed depreciation is recaptured at up to 25%, and gains may owe capital-gains tax (a 1031 exchange can defer both). Figures are a year-1 estimate at your 24.0% rate — not tax advice; consult a CPA.
Schools (NCES district)
- District
- Martin
- NCES district ID
- 1201290
- Math proficiency
- 52% ▼ -14.00%
- Reading proficiency
- 53% ▼ -4.00%
- Median HH income
- $52,482
- Composite
- 45.1/100
- National rank
- #2690
- State rank
- #24 of 73 in FL
Livability — Hobe Sound
- Score
- 69/100
- State rank
- #497
- US rank
- #8763
Category grades
Schools grade is shown separately in the Schools card above.
Census & demographics
- County
- Martin County · 165,223 people
- City population
- 20,018
- Metro
- Port St. Lucie, FL
- Population (ZIP)
- 20,018
- Household income
- $70,389
- Rent vs Own
- Severe rent burden
- 317.0
Population outlook (Martin County) Hauer SSP2
- Today (2025)
- 172,383 people
- By 2030
- 180,192 · +4.5%
- By 2040
- 194,114 · +12.6%
- By 2050
- 204,992 · +18.9%
- By 2075
- 229,641 · +33.2%
- By 2100
- 232,146 · +34.7%
Race, ethnicity, and origin ACS 2023
- Neighborhood character
- Predominantly White (84%)
- Race & ethnicity
- White 84% Hispanic / Latino 8% Two or more races 6% Black 5% Asian 1%
- Hispanic origin (detail)
- Mexican 3% Dominican 1%
- Common ancestry
- Romanian 5% Italian 2% Slovak 2%
- Foreign-born
- 8% · Canada
- Languages at home
- 91% English-only · Spanish 6% Other Indo-European 1%
Political lean MEDSL · Martin
- 2024 margin
- Solid R (+31.1) · D 34.1% · R 65.2%
- 2008→2024 swing
- -17.5pp toward R · 2008: -13.6pp · 2024: -31.1pp
- All cycles
- 2024: R+31.1 2020: R+24.6 2016: R+26.9 2012: R+22.9 2008: R+13.6
Not yet ingested
- Civics
- —
Market trends
- HPI YoY
- ▼ -287.05%
- Current HPI
- 356.7273
- Rent YoY
- ▲ 1.80%
- Metro
- Port St. Lucie, FL
- State GDP YoY
- ▲ 3.28%
- F500 in state
- 36
Industry mix (Fortune 500 HQ in FL)
| Industry | F500 HQs | Revenue |
|---|---|---|
| Industrial Technology | 2 | $29B |
|
||
| Insurance | 2 | $17B |
|
||
| Retail | 1 | $60B |
|
||
| Technology Distribution | 1 | $58B |
|
||
| Homebuilding | 1 | $35B |
|
||
| Technology Manufacturing | 1 | $35B |
|
||
Price history
+165.9% since first listed3 events — show timeline
- 2026-06-08 Listed $239,000 Beaches MLS
- 1998-01-16 Sold (Public Records) $105,000 Public Records
- 1987-06-24 Sold (Public Records) $89,900 Public Records
Property tax history
+2.6%/yrLatest (2025): $1,460 · +0.8% YoY. Source: county tax records.
Cash-flow waterfall
monthlySold comps — $/sqft
last 12 mo · ≤1 miLoading sold comps…