7151 Woodlake Pkwy #128 · San Antonio, TX
Flood risk 1/10 · Minimal
- FEMA flood zone
- X (unshaded)
- Chance of flooding over 30 yrs
- 0.0%
- Est. flood insurance / yr
- $507 – $1,088
Fire risk 2/10 · Minimal
- Est. fire insurance / yr
- $1,222 – $2,270
Heat risk 8/10 · Major
- Hot days now (above 108°F)
- 7 days/yr
- Hot days in 30 yrs
- 23 days/yr
Wind risk 8/10 · Major
- Chance of severe wind over 30 yrs
- 80.0%
Air-quality risk 2/10 · Minimal
- Unhealthy air days now
- 0 days/yr
- Unhealthy air days in 30 yrs
- 1 days/yr
Risk factors via First Street. Map © Google.
Why this score? — see what drove the B- grade
The composite is a weighted blend of 9 inputs, each scored 0–100. Each bar is that input's sub-score; the figure is the points it added to the 100-point composite (weight × sub-score).
- Cash flow +28.6/30.0
- 1% rule +10.0/10.0
- DSCR +10.0/10.0
- ARV discount +7.5/15.0
- Livability +4.0/5.0
- Condition / age +2.5/5.0
- Schools +2.4/10.0
- Rent growth +1.1/5.0
- Appreciation +0.0/10.0
$50,000
🖨 Deal sheet 📄 Offer letter ✓ Due diligence
Listing remarks
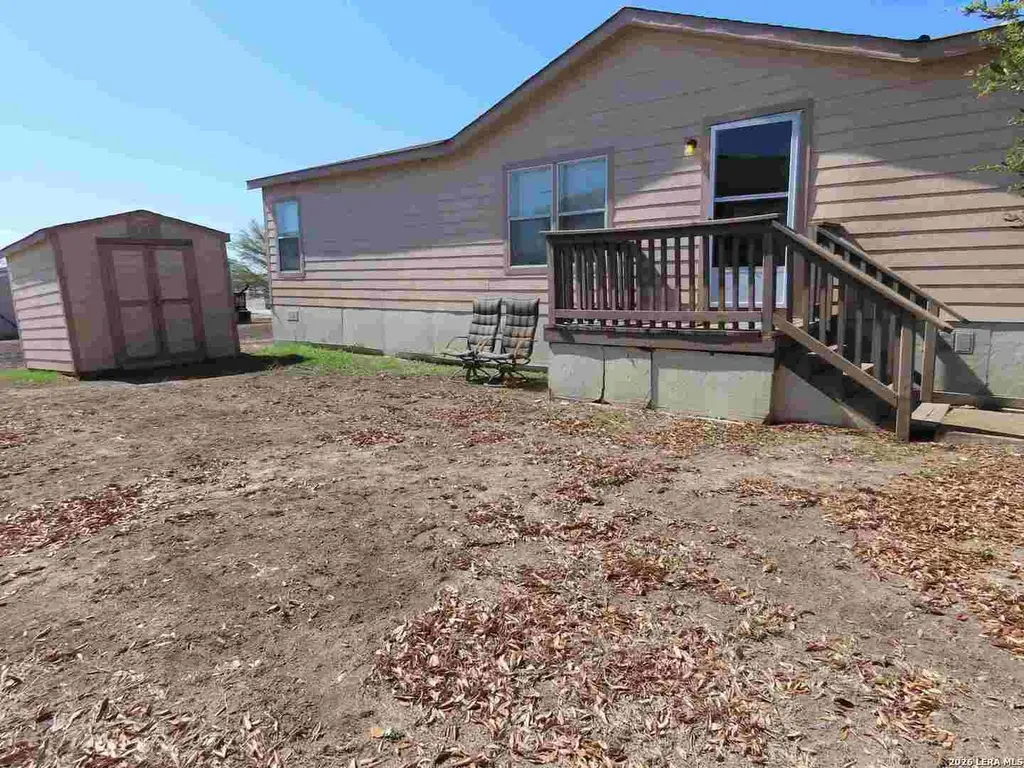
Nice Manufactured home located in the desirable Woodlake Estates neighborhood. Located just minutes from I-35, Rittiman, Walzem Rd, and Downtown. This home features 4 Bedrooms, with a large Master Bedroom and Bath. Home has a spacious living area and kitchen. The home offers a storage shed on the property.
Key facts
- Storage shed
- Built 2004
- Listed 14 days
Tags
Property features AI
Finance
- Other: Possession at closing/funding; For sale (not a short sale)
- Financial info: Down payment assistance resources not indicated
- HOA & community: Mandatory HOA; HOA fee $750 per month; Association transfer fee $150; Subdivision: Woodlake Estates
Exterior
- Parking: Details not provided
- Security: Details not provided
- Utilities: Gas supplied by CPS Energy; Electricity supplied by CPS Energy; Water supplied by SAWS; Sewer supplied by SAWS; Garbage service by CPS; Water and sewer systems present
- Home design: Pre-owned property; Approximately 22 years old
- Construction: Composition roof
- Exterior features: Siding exterior
Interior
- Kitchen: Kitchen (approx. 12 x 10)
- Bedrooms: Master bedroom on lower level with ceiling fan (approx. 14 x 15); Bedroom 2 (approx. 10 x 10); Bedroom 3 (approx. 10 x 10); Bedroom 4 (approx. 10 x 10)
- Flooring: Carpeting; Linoleum flooring
- Bathrooms: Two full bathrooms; Master bath with separate tub and shower (approx. 10 x 10)
- Heating & cooling: Central heating (electric); Central air conditioning
- Interior features: Ceiling fans; Living and dining room combination; All window coverings remain
- Laundry & utility: Details not provided
Neighborhood map
What this means for you Summary
Snapshot
- This is a 4-bed/2.0-bath manufactured listed at $50k.
Deal economics
- At list price, monthly cash flow is $165 ($2k/yr) — positive.
- The deal already cash-flows at list — no discount required.
- Meets the 1% rule at list price ($2k rent vs $50k).
- Cap rate 10.2% vs local median 3.8% in San Antonio — top-decile yield for the area; either an underpriced asset or a hidden risk that comps aren't pricing in. Stress-test before assuming the spread holds.
Location & tenants
- Location reads 80/100 on livability (#31 in TX, #1,616 nationally) — a professional / high-income tenant draw. Strengths: amenities A+, commute A+, cost of living A+; Watch: schools C-, crime F.
- Judson ISD (suburban): math 21% / reading 33% proficiency, ranked #660 of 826 in TX (top 80%) — low school quality limits family demand, transient renter base, plan for 1-2y turnover.
- Market conditions: Rents falling (-5.6%/yr); 131 active listings in the ZIP; 40 comparable units currently listed for rent nearby; rentals at typical pace (median 24d on market — plan ~3-4 weeks tenant-placement turnaround); 40% of comp listings sitting > 30 days — soft ceiling on asking rent; 8,308 units permitted in Bexar County in 2024 (2,506 in 5+ unit buildings).
- This rent runs 34% of the median local income ($57k/yr) — at the standard rent-burdened threshold; future hikes will face affordability resistance.
Forward outlook
- Local home prices are declining (-3.0%/yr); year-one equity from $346 of loan paydown is wiped out by about $2k of value loss. Plan a longer hold.
- Bexar County population projected at +50% by 2050 — long-run rental-demand tailwind backs the buy-and-hold thesis.
Negotiation context
- Only 14 days on market — expect competitive offers; lowballing is unlikely to land.
Risks & watch-outs
- Watch-outs: HOA is 46% of rent.
- Climate carrying-cost: severe wind risk, 80% chance of damaging wind over 30y; extreme-heat days projected 7→23/yr by 2055 (HVAC capex compounding) — expect insurance premiums to compound above CPI over the hold.
Questions for the listing agent
- What does the HOA fee cover, when was the last increase, and are there any pending special assessments or reserve-fund shortfalls?
- Is there a deadline driving the sale (1031 exchange, divorce, estate, relocation)? That informs how much negotiation room exists.
- Crime grade is F in this area — have there been break-ins, vandalism, or insurance claims at this property in the last 3 years? What carrier currently insures it and at what premium?
- What's the average days-on-market for RENTAL listings here right now (not sales)? A rising rental-DOM trend means longer vacancies and softer asking-rent achievability than the comps imply.
- What's the recent tenant-quality profile in this submarket — average credit score on applications, eviction rate, late-payment / NSF rate, and stable-employment percentage? A property-management company in the area should have these aggregated.
- How much new for-sale + rental construction is in the pipeline within 1–3 miles? Heavy new supply typically softens prices + rents 12–24 months out; constrained supply supports both.
Investment metrics
- 1% rule
- 3.27% ✓
- Cap rate
- 10.25%
- Cash-on-cash
- 14.11%
- DSCR
- 1.63
- GRM
- 2.6
CMA / ARV
- ARV (median comp)
- $156,000
- List price
- $50,000
- Delta
- -67.95%
- Verdict
- UNDERPRICED
- Comps
- 1 within 2.0 mi
Projected returns pro-forma
-3.0% appreciation · 0.0% rent growth · sell at horizon
- IRR
- -3.9%
- Equity multiple
- 0.86×
- Total profit
- $-1,898
- Equity at exit
- $7,455
- IRR
- -8.6%
- Equity multiple
- 0.67×
- Total profit
- $-4,602
- Equity at exit
- $4,323
Cash invested: $14,000 (down + closing). Projections, not guarantees.
Landlord ↔ Tenant lean methodology
- Overall (STATE)
- 87 Strongly Landlord-Friendly
- State Texas
- 87 Strongly Landlord-Friendly · R+5
- County
- — inherits STATE
- City
- — inherits STATE
ZIP-level market 78218
- Home prices YoY
- -16.1%
- Rents YoY
- -5.6%
- Active inventory
- 131
- Price-to-rent
- 2.6×
Monthly cashflow live
- Estimated rent
- $1,634 high interval (Pro) →
- Mortgage (P&I)
- −$262
- Tax from tax record
- −$93 /mo · $1,116/yr
- Insurance
- −$21
- HOA
- −$750
- Vacancy / Maint / Mgmt
- −$343
- Net cashflow
- $165
Break-even live
UW: 25.0% down · 7.5% · 30yr · 1.5% tax · 5.0% vac · 8.0% maint · 8.0% mgmt
Financing live
Cash to close
- Down payment
- $12,500
- Closing costs
- $1,500
- Reserves months
- —
- Total cash needed
- —
Loan-product check · same deal, 3 products live
Conventional
25% down · 7.5% · 30yr
- Down + closing
- —
- Monthly P&I
- —
- Monthly cashflow
- —
- DSCR
- —
- Eligible?
- —
Personal DTI + credit; lowest rate.
DSCR
20% down · 8.5% · 30yr
- Down + closing
- —
- Monthly P&I
- —
- Monthly cashflow
- —
- DSCR
- —
- Eligible?
- —
No personal income docs; deal must DSCR.
Hard money
10% down · 12.0% · 12mo
- Down + closing
- —
- Monthly P&I
- —
- Monthly cashflow
- —
- DSCR
- —
- Eligible?
- —
Short-term bridge; refi at stabilization.
Rent comps 40 comps
| Address | Beds | Baths | Sqft | Rent | $/sqft | DOM | Units | Dist |
|---|---|---|---|---|---|---|---|---|
| 7151 Woodlake Pkwy San Antonio, TX | 3.0 | 2.0 | 1624 | $1,300 | $0.80 | 43d | 1 | 0.02mi |
| 7151 Woodlake Pkwy San Antonio, TX | 3.0–4.0 | 2.0 | 1528 | $1,679 | $1.10 | 1d | 1 | 0.03mi |
| 7426 Circle Farm San Antonio, TX | 3.0 | 2.5 | 1572 | $1,525 | $0.97 | 43d | 1 | 0.15mi |
| 7431 Cedar Farm San Antonio, TX | 3.0 | 2.5 | 2175 | $1,700 | $0.78 | 23d | 1 | 0.17mi |
| 7831 Hedrick Farm San Antonio, TX | 3.0 | 3.0 | 1556 | $1,560 | $1.00 | 12d | 1 | 0.27mi |
| 6647 Arbor Farm San Antonio, TX | 3.0 | 2.5 | 1807 | $1,780 | $0.99 | 2d | 1 | 0.27mi |
| 7858 Hedrick Farm San Antonio, TX | 3.0 | 2.5 | 1437 | $1,485 | $1.03 | 3d | 1 | 0.28mi |
| 4943 Mesa Bonita San Antonio, TX | 3.0 | 2.0 | 1992 | $1,760 | $0.88 | 4d | 1 | 0.29mi |
| 6903 Cozy Run San Antonio, TX | 3.0 | 2.0 | 1243 | $1,550 | $1.25 | 14d | 1 | 0.33mi |
| 6734 Benke Farm San Antonio, TX | 3.0 | 2.5 | 1914 | $1,490 | $0.78 | 43d | 1 | 0.33mi |
| 4807 Heather Pass San Antonio, TX | 3.0 | 2.5 | 1554 | $1,475 | $0.95 | 23d | 1 | 0.38mi |
| 4807 Heather Pass San Antonio, TX | 3.0 | 2.5 | 1554 | $1,475 | $0.95 | 10d | 1 | 0.38mi |
| 4903 Orchid Star San Antonio, TX | 3.0 | 2.0 | 1737 | $1,590 | $0.92 | 23d | 1 | 0.43mi |
| 4822 Orchid Star San Antonio, TX | 3.0 | 2.5 | 1450 | $1,435 | $0.99 | 23d | 1 | 0.44mi |
| 7011 Winding Shelf San Antonio, TX | 3.0 | 2.0 | 1266 | $1,449 | $1.14 | 4d | 1 | 0.48mi |
| 6026 Cielo Rnch San Antonio, TX | 3.0 | 2.0 | 1800 | $1,800 | $1.00 | 43d | 1 | 0.51mi |
| 7238 Winding Fence San Antonio, TX | 4.0 | 2.0 | 1627 | $1,695 | $1.04 | 21d | 1 | 0.52mi |
| 7218 Winding Finger San Antonio, TX | 4.0 | 2.0 | 1627 | $1,645 | $1.01 | 43d | 1 | 0.55mi |
| 7211 Winding Finger San Antonio, TX | 3.0 | 2.0 | 1440 | $1,515 | $1.05 | 43d | 1 | 0.56mi |
| 7238 Azalea Sq San Antonio, TX | 3.0 | 3.0 | 1547 | $1,650 | $1.07 | 43d | 1 | 0.58mi |
| 7238 Azalea Sq San Antonio, TX | 3.0 | 2.5 | 1547 | $1,550 | $1.00 | 4d | 1 | 0.58mi |
| 7226 Winding Cloud San Antonio, TX | 3.0 | 2.0 | 1440 | $1,565 | $1.09 | 23d | 1 | 0.59mi |
| 7528 Oak Chase San Antonio, TX | 3.0 | 2.0 | 1138 | $995 | $0.87 | 43d | 1 | 0.59mi |
| 7006 Winding Draw San Antonio, TX | 4.0 | 2.5 | 1687 | $1,699 | $1.01 | 43d | 1 | 0.60mi |
| 6126 Plumbago Pl San Antonio, TX | 3.0 | 2.0 | 1436 | $1,595 | $1.11 | 43d | 1 | 0.60mi |
| 7134 Winding Draw San Antonio, TX | 3.0 | 2.0 | 1440 | $1,565 | $1.09 | 14d | 1 | 0.65mi |
| 7545 Windsor Oaks San Antonio, TX | 4.0 | 2.0 | 1300 | $1,095 | $0.84 | 43d | 1 | 0.66mi |
| 7543 Windsor Oaks San Antonio, TX | 3.0 | 2.0 | 1300 | $1,095 | $0.84 | 23d | 1 | 0.66mi |
| 7568 Windsor Oaks Unit 7572 San Antonio, TX | 3.0 | 2.0 | 1150 | $1,250 | $1.09 | 4d | 1 | 0.67mi |
| 6811 Avila San Antonio, TX | 3.0 | 2.0 | 1260 | $1,555 | $1.23 | 20d | 1 | 0.68mi |
| 7613 Oak Chase San Antonio, TX | 3.0 | 2.0 | 1200 | $1,100 | $0.92 | 43d | 1 | 0.69mi |
| 6507 Dancing Ct San Antonio, TX | 3.0 | 2.5 | 1562 | $1,500 | $0.96 | 43d | 1 | 0.70mi |
| 7636 Oak Chase Unit 1 San Antonio, TX | 3.0 | 2.0 | 1200 | $1,255 | $1.05 | 43d | 1 | 0.72mi |
| 7042 Glen Mist San Antonio, TX | 3.0 | 2.0 | 1284 | $950 | $0.74 | 43d | 1 | 0.74mi |
| 7650 Oak Chase Unit 7650 San Antonio, TX | 4.0 | 2.0 | 1250 | $1,650 | $1.32 | 43d | 1 | 0.75mi |
| 7658 Oak Chase San Antonio, TX | 3.0 | 2.0 | 1250 | $1,350 | $1.08 | 7d | 1 | 0.76mi |
| 7662 Oak Chase San Antonio, TX | 3.0 | 2.0 | 1250 | $1,200 | $0.96 | 10d | 1 | 0.76mi |
| 7664 Oak Chase San Antonio, TX | 3.0 | 2.0 | 1250 | $1,350 | $1.08 | 7d | 1 | 0.76mi |
| 7660 Oak Chase San Antonio, TX | 3.0 | 2.0 | 1250 | $1,200 | $0.96 | 10d | 1 | 0.76mi |
| 6831 De Palma San Antonio, TX | 3.0 | 2.0 | 1504 | $1,569 | $1.04 | 16d | 1 | 0.77mi |
HOA detail
- Monthly dues
- $750 · $9,000/yr
Listing history 1 events
-
2026-05-12$50,000 New 310-char remark
ⓘ Source: listings_history table (triggers on properties + properties_extension) + one-shot
backfill from property_details.listing_events for pre-trigger history.
Tax reassessment forecast TX · Resets to sale price
- Current annual tax
- $1,116 · $93/mo
- Projected year-2 tax
- $1,116 · $93/mo
- Expected delta
- $0/yr ($0/mo · 0.0%)
ⓘ Screening estimate from a state-policy table — verify with the county assessor before closing.
Climate risk First Street
- Flood 1/10 Low FEMA zone X (unshaded) · 0% chance over 30 yrs
- Wildfire 2/10 Low
- Heat 8/10 Severe 7 d/yr ≥108°F today · 23 d/yr by 30 yrs out
- Wind 8/10 Severe 80% chance of damaging wind over 30 yrs
- Air quality 2/10 Low 0 unhealthy d/yr today · 1 by 30 yrs out
Nearby sold comps map
Loading sold comps map…
Walkable amenities ~0.75 mi
Loading nearby amenities…
Taxation est. · year 1
- Rental income
- $19,605
- − Mortgage interest
- −$2,801
- − Property taxes
- −$1,116
- − Insurance
- −$250
- − Repairs & maintenance
- −$1,568
- − Management
- −$1,568
- − HOA
- −$9,000
- − Depreciation
- −$1,455
- Taxable income
- $1,847
- Est. tax owed @ 24.0%
- −$443
- After-tax cash flow
- $1,533/yr
For passive investors: Depreciation is non-cash, so a rental often shows a tax loss while cash-flowing — sheltering income. Rental losses are passive: they offset passive income freely, and up to $25,000/yr can offset ordinary (W-2) income if you actively participate and your MAGI is under $100k (phasing out to $0 by $150k); unused losses carry forward. On sale, claimed depreciation is recaptured at up to 25%, and gains may owe capital-gains tax (a 1031 exchange can defer both). Figures are a year-1 estimate at your 24.0% rate — not tax advice; consult a CPA.
Schools (NCES district)
- District
- Judson ISD
- NCES district ID
- 4824990
- Math proficiency
- 21% ▼ -21.00%
- Reading proficiency
- 33% ▼ -7.00%
- Median HH income
- $57,542
- Composite
- 24.39/100
- National rank
- #7689
- State rank
- #660 of 826 in TX
Livability — San Antonio
- Score
- 80/100
- State rank
- #31
- US rank
- #1616
Category grades
Schools grade is shown separately in the Schools card above.
Census & demographics
- Census place
- San Antonio, TX
- County
- Bexar County · 1,990,555 people
- City population
- 1,806,925
- Metro
- San Antonio-New Braunfels, TX
- Population (ZIP)
- 39,428
- Household income
- $57,285
- Rent vs Own
- Severe rent burden
- 2508.0
Population outlook (Bexar County) Hauer SSP2
- Today (2025)
- 2,336,851 people
- By 2030
- 2,560,728 · +9.6%
- By 2040
- 3,020,569 · +29.3%
- By 2050
- 3,493,522 · +49.5%
- By 2075
- 4,668,459 · +99.8%
- By 2100
- 5,533,242 · +136.8%
Race, ethnicity, and origin ACS 2023
- Neighborhood character
- Diverse neighborhood (Simpson 0.64)
- Race & ethnicity
- Hispanic / Latino 53% Two or more races 26% White 25% Black 14% Asian 3% Native American 2%
- Hispanic origin (detail)
- Mexican 41% Puerto Rican 3%
- Common ancestry
- Serbian 2% Italian 1% Romanian 1%
- Foreign-born
- 18% · Canada, Vietnam, China
- Languages at home
- 60% English-only · Spanish 34% Vietnamese 1% Other Asian/Pacific 1%
Political lean MEDSL · Bexar
- 2024 margin
- Lean D (+9.8) · D 54.3% · R 44.6% · Other 1.1%
- 2008→2024 swing
- +4.2pp toward D · 2008: 5.6pp · 2024: 9.8pp
- All cycles
- 2024: D+9.8 2020: D+18.2 2016: D+13.5 2012: D+4.6 2008: D+5.6
Not yet ingested
- Civics
- —
Market trends
- HPI YoY
- ▼ -52.17%
- Current HPI
- 271.2807
- Rent YoY
- ▼ -5.56%
- Metro
- San Antonio-New Braunfels, TX
- State GDP YoY
- ▲ 3.95%
- F500 in state
- 110
Industry mix (Fortune 500 HQ in TX)
| Industry | F500 HQs | Revenue |
|---|---|---|
| Energy | 16 | $1,198B |
|
||
| Technology | 5 | $198B |
|
||
| Engineering / Construction | 4 | $72B |
|
||
| Energy Services | 3 | $60B |
|
||
| Utilities | 3 | $41B |
|
||
| Healthcare | 2 | $330B |
|
||
Price history
2 events — show timeline
- 2026-05-28 Listing Removed — LERA
- 2026-05-12 Listed $50,000 LERA
Property tax history
+3.5%/yrLatest (2025): $1,116 · +12.2% YoY. Source: county tax records.
Cash-flow waterfall
monthlySold comps — $/sqft
last 12 mo · ≤1 miLoading sold comps…