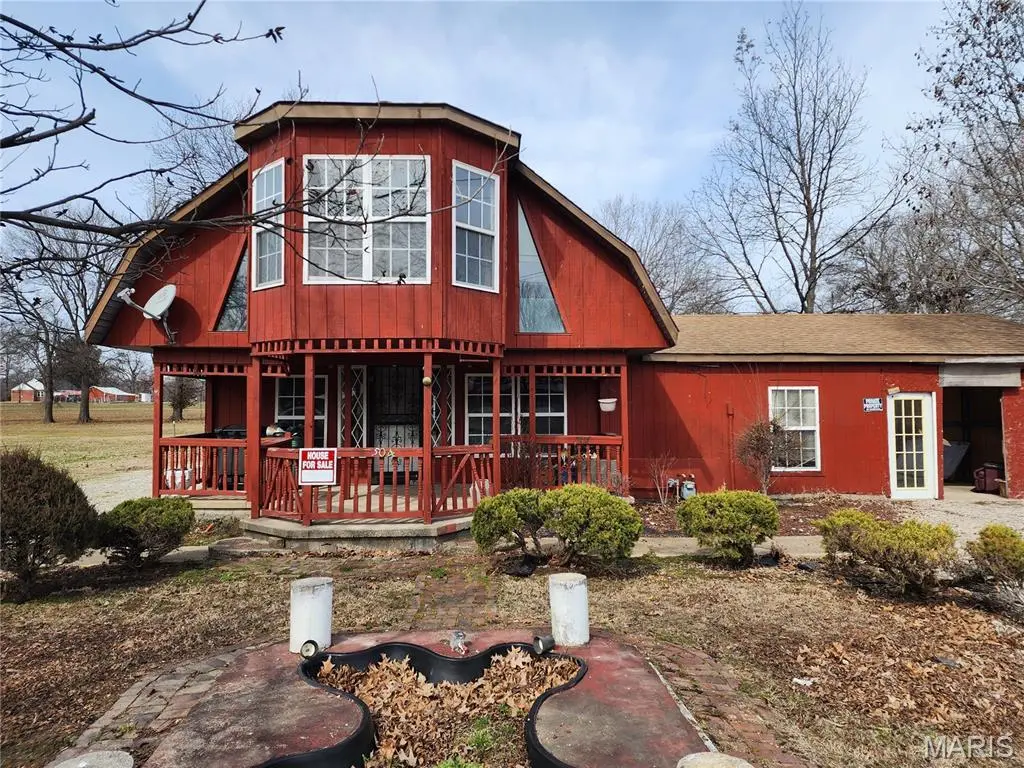
504 Allen Rd · Campbell, MO
Flood risk 1/10 · Minimal
- FEMA flood zone
- —
- Chance of flooding over 30 yrs
- 0.0%
- Est. flood insurance / yr
- —
Fire risk 1/10 · Minimal
- Est. fire insurance / yr
- $1,054 – $1,958
Heat risk 5/10 · Moderate
- Hot days now (above 109°F)
- 7 days/yr
- Hot days in 30 yrs
- 21 days/yr
Wind risk 3/10 · Minor
- Chance of severe wind over 30 yrs
- 6.0%
Air-quality risk 2/10 · Minimal
- Unhealthy air days now
- 0 days/yr
- Unhealthy air days in 30 yrs
- 1 days/yr
Risk factors via First Street. Map © Google.
Why this score? — see what drove the A- grade
The composite is a weighted blend of 9 inputs, each scored 0–100. Each bar is that input's sub-score; the figure is the points it added to the 100-point composite (weight × sub-score).
- Cash flow +30.0/30.0
- ARV discount +15.0/15.0
- 1% rule +10.0/10.0
- DSCR +10.0/10.0
- Appreciation +5.2/10.0
- Livability +3.2/5.0
- Schools +2.6/10.0
- Rent growth +2.5/5.0
- Condition / age +2.5/5.0
$49,500
🖨 Deal sheet 📄 Offer letter ✓ Due diligence
Listing remarks MLS
Check out this 1430 SF, two bedroom, one bath home in Campbell, MO. This home need a little TLC but has tons of potential and is priced to sell quickly. Sitting on almost a half acre lot with multiple outbuildings, this property will make someone a good home or supply rental income. There is a 30X32 shop building with concrete floor and a small apartment building as well. There is a lot of bang for the buck in this one. Call for your personal tour today.
Key facts
- Shop building
- Half acre lot
- Concrete floor
Tags
Neighborhood map
What this means for you Summary
Snapshot
- This is a 2-bed/1.0-bath other listed at $50k.
Deal economics
- At list price, monthly cash flow is $357 ($4k/yr) — positive.
- The deal already cash-flows at list — no discount required.
- Meets the 1% rule at list price ($870 rent vs $50k).
- Recommended offer: $45k (9.0% below list) — sets the bar for market timing.
Location & tenants
- Location reads 63/100 on livability (#358 in MO) — a middle-class / working-renter tenant base. Strengths: crime A+, cost of living A+, housing B+; Watch: health & safety C-, schools F, amenities F.
- Campbell R-II (rural): math 31% / reading 33% proficiency, ranked #264 of 324 in MO (top 82%) — families likely to look elsewhere, expect single-tenant / working-renter base with shorter leases; 63% free/reduced lunch — lower-income household profile, screen leases tightly.
- Market conditions: 16 active listings in the ZIP; 30 units permitted in Dunklin County in 2024 (0 in 5+ unit buildings).
Forward outlook
- In year one you build about $540 of equity ($342 loan paydown + $198 appreciation (0.4% local appreciation)).
- Dunklin County population projected at -22% by 2050 — secular population decline; favor cash flow + early exit over multi-decade hold.
- At projected returns (0.4% appreciation + 3.0% rent growth), your $14k cash investment doubles in ~3 years — after that, you're playing with house money.
Negotiation context
- It's been on market 104 days — a 9% lower offer ($45k) is reasonable based on typical stale-listing flexibility.
Risks & watch-outs
- Climate carrying-cost: extreme-heat days projected 7→21/yr by 2055 (HVAC capex compounding) — expect insurance premiums to compound above CPI over the hold.
Questions for the listing agent
- It's been on market 104 days. Have you received any prior offers? Is the seller open to a 9% concession, seller financing, or rate buy-down credit?
- Why hasn't it sold? Are there any deal-killer items the seller is aware of (foundation, flood, title, zoning, code violations)?
- Is there a deadline driving the sale (1031 exchange, divorce, estate, relocation)? That informs how much negotiation room exists.
- Schools are F-rated, which usually means shorter tenancies and higher turnover. Who's the typical renter profile here, and what's been the actual vacancy rate?
- What's the average days-on-market for RENTAL listings here right now (not sales)? A rising rental-DOM trend means longer vacancies and softer asking-rent achievability than the comps imply.
- What's the recent tenant-quality profile in this submarket — average credit score on applications, eviction rate, late-payment / NSF rate, and stable-employment percentage? A property-management company in the area should have these aggregated.
- How much new for-sale + rental construction is in the pipeline within 1–3 miles? Heavy new supply typically softens prices + rents 12–24 months out; constrained supply supports both.
Investment metrics
- 1% rule
- 1.76% ✓
- Cap rate
- 14.94%
- Cash-on-cash
- 30.87%
- DSCR
- 2.37
- GRM
- 4.7
CMA / ARV
- ARV (median comp)
- $68,950
- List price
- $49,500
- Delta
- -28.21%
- Verdict
- UNDERPRICED
- Comps
- 20 within 1.0 mi
Projected returns pro-forma
0.4% appreciation · 3.0% rent growth · sell at horizon
- IRR
- 32.1%
- Equity multiple
- 2.60×
- Total profit
- $22,203
- Equity at exit
- $15,372
- IRR
- 35.2%
- Equity multiple
- 5.05×
- Total profit
- $56,170
- Equity at exit
- $19,295
Cash invested: $13,860 (down + closing). Projections, not guarantees.
Landlord ↔ Tenant lean methodology
- Overall (STATE)
- 81 Strongly Landlord-Friendly
- State Missouri
- 81 Strongly Landlord-Friendly · R+10
- County
- — inherits STATE
- City
- — inherits STATE
ZIP-level market 63933
- Home prices YoY
- 0.4%
- Active inventory
- 16
- Price-to-rent
- 4.7×
Monthly cashflow live
- Estimated rent
- $870 medium interval (Pro) →
- Mortgage (P&I)
- −$260
- Tax from tax record
- −$50 /mo · $604/yr
- Insurance
- −$21
- HOA
- −$0
- Vacancy / Maint / Mgmt
- −$183
- Net cashflow
- $357
Break-even live
UW: 25.0% down · 7.5% · 30yr · 1.5% tax · 5.0% vac · 8.0% maint · 8.0% mgmt
Financing live
Cash to close
- Down payment
- $12,375
- Closing costs
- $1,485
- Reserves months
- —
- Total cash needed
- —
Loan-product check · same deal, 3 products live
Conventional
25% down · 7.5% · 30yr
- Down + closing
- —
- Monthly P&I
- —
- Monthly cashflow
- —
- DSCR
- —
- Eligible?
- —
Personal DTI + credit; lowest rate.
DSCR
20% down · 8.5% · 30yr
- Down + closing
- —
- Monthly P&I
- —
- Monthly cashflow
- —
- DSCR
- —
- Eligible?
- —
No personal income docs; deal must DSCR.
Hard money
10% down · 12.0% · 12mo
- Down + closing
- —
- Monthly P&I
- —
- Monthly cashflow
- —
- DSCR
- —
- Eligible?
- —
Short-term bridge; refi at stabilization.
Listing history 16 events
-
2026-06-18days on market $49,500 Active 104 DOM
-
2026-06-17days on market $49,500 Active 103 DOM
-
2026-06-16days on market $49,500 Active 102 DOM
-
2026-06-15days on market $49,500 Active 101 DOM
-
2026-06-13days on market $49,500 Active 99 DOM
-
2026-06-12pricedays on market $49,500 Active 98 DOM
-
2026-06-09days on market $59,500 Active 95 DOM
-
2026-06-08days on market $59,500 Active 94 DOM
-
2026-06-07days on market $59,500 Active 93 DOM
-
2026-06-05days on market $59,500 Active 91 DOM
-
2026-06-04days on market $59,500 Active 89 DOM
-
2026-06-02days on market $59,500 Active 88 DOM
-
2026-06-01days on market $59,500 Active 87 DOM
-
2026-05-31days on market $59,500 Active 86 DOM
-
2026-03-06$59,500 Active 463-char remark
Show marketing remark (463 chars)
Check out this 1430 SF, two bedroom, one bath home in Campbell, MO. This home need a little TLC but has tons of potential and is priced to sell quickly. Sitting on almost a half acre lot with multiple outbuildings, this property will make someone a good home or supply rental income. There is a 30X32 shop building with concrete floor and a small apartment building as well. There is a lot of bang for the buck in this one. Call for your personal tour today.
-
1983-03-17soldstatus
ⓘ Source: listings_history table (triggers on properties + properties_extension) + one-shot
backfill from property_details.listing_events for pre-trigger history.
Tax reassessment forecast MO · Resets to sale price
- Current annual tax
- $604 · $50/mo
- Projected year-2 tax
- $604 · $50/mo
- Expected delta
- $0/yr ($0/mo · 0.0%)
ⓘ Screening estimate from a state-policy table — verify with the county assessor before closing.
Climate risk First Street
- Flood 1/10 Low 0% chance over 30 yrs
- Wildfire 1/10 Low
- Heat 5/10 Major 7 d/yr ≥109°F today · 21 d/yr by 30 yrs out
- Wind 3/10 Moderate 6% chance of damaging wind over 30 yrs
- Air quality 2/10 Low 0 unhealthy d/yr today · 1 by 30 yrs out
Nearby sold comps map
Loading sold comps map…
Walkable amenities ~0.75 mi
Loading nearby amenities…
Taxation est. · year 1
- Rental income
- $10,436
- − Mortgage interest
- −$2,773
- − Property taxes
- −$604
- − Insurance
- −$248
- − Repairs & maintenance
- −$835
- − Management
- −$835
- − Depreciation
- −$1,440
- Taxable income
- $3,702
- Est. tax owed @ 24.0%
- −$889
- After-tax cash flow
- $3,390/yr
For passive investors: Depreciation is non-cash, so a rental often shows a tax loss while cash-flowing — sheltering income. Rental losses are passive: they offset passive income freely, and up to $25,000/yr can offset ordinary (W-2) income if you actively participate and your MAGI is under $100k (phasing out to $0 by $150k); unused losses carry forward. On sale, claimed depreciation is recaptured at up to 25%, and gains may owe capital-gains tax (a 1031 exchange can defer both). Figures are a year-1 estimate at your 24.0% rate — not tax advice; consult a CPA.
Schools (NCES district)
- District
- Campbell R-II
- NCES district ID
- 2907050
- Math proficiency
- 31% ▼ -11.00%
- Reading proficiency
- 33% ▼ -13.00%
- Median HH income
- $30,610
- Composite
- 26.01/100
- National rank
- #7316
- State rank
- #264 of 324 in MO
Livability — Campbell
- Score
- 63/100
- State rank
- #358
- US rank
- #15784
Category grades
Schools grade is shown separately in the Schools card above.
Census & demographics
- Census place
- Campbell, MO
- Population (ZIP)
- 3,099
Population outlook (Dunklin County) Hauer SSP2
- Today (2025)
- 28,599 people
- By 2030
- 27,230 · -4.8%
- By 2040
- 24,696 · -13.6%
- By 2050
- 22,402 · -21.7%
- By 2075
- 17,776 · -37.8%
- By 2100
- 13,890 · -51.4%
Race, ethnicity, and origin ACS 2023
- Neighborhood character
- Predominantly White (82%)
- Race & ethnicity
- White 82% Two or more races 17% Hispanic / Latino 2%
- Common ancestry
- Iranian 3% Slovak 2% Lithuanian 1%
- Foreign-born
- 0%
- Languages at home
- 99% English-only · Spanish 1%
Political lean MEDSL · Dunklin
- 2024 margin
- Solid R (+61.8) · D 18.8% · R 80.5%
- 2008→2024 swing
- -40.5pp toward R · 2008: -21.3pp · 2024: -61.8pp
- All cycles
- 2024: R+61.8 2020: R+57.0 2016: R+53.6 2012: R+30.2 2008: R+21.3
Not yet ingested
- Civics
- —
Market trends
- HPI YoY
- ▲ 0.40%
- Current HPI
- 112.5422
- Rent YoY
- —
- Metro
- —
- State GDP YoY
- ▲ 1.84%
- F500 in state
- 20
Industry mix (Fortune 500 HQ in MO)
| Industry | F500 HQs | Revenue |
|---|---|---|
| Healthcare | 1 | $163B |
|
||
| Insurance | 1 | $21B |
|
||
| Industrial Technology | 1 | $17B |
|
||
| Retail | 1 | $16B |
|
||
| Industrial Distribution | 1 | $10B |
|
||
| Utilities | 1 | $9B |
|
||
Price history
2 events — show timeline
- 2026-03-06 Listed $59,500 MARIS as Distributed by MLS Grid
- 1983-03-17 Sold (Public Records) — Public Records
Property tax history
+1.3%/yrLatest (2025): $604 · +1.0% YoY. Source: county tax records.
Cash-flow waterfall
monthlySold comps — $/sqft
last 12 mo · ≤1 miLoading sold comps…