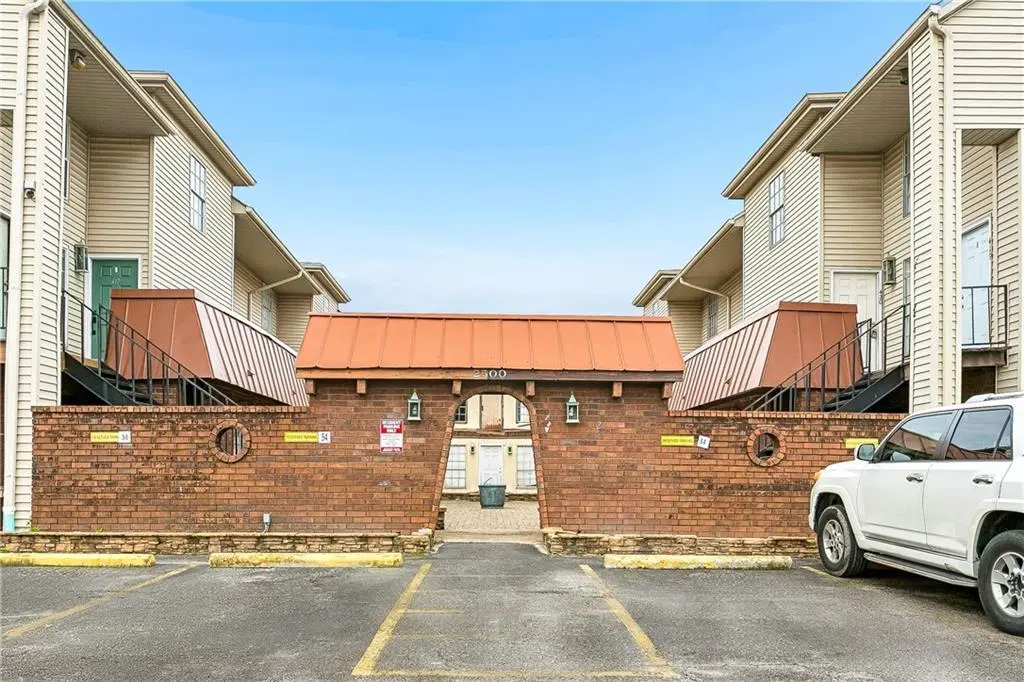
2500 Manson Ave #420 · Metairie, LA
Flood risk No data
- FEMA flood zone
- —
- Chance of flooding over 30 yrs
- —
- Est. flood insurance / yr
- —
Fire risk No data
- Est. fire insurance / yr
- —
Heat risk No data
- Hot days now (above threshold)
- —
- Hot days in 30 yrs
- —
Wind risk No data
- Chance of severe wind over 30 yrs
- —
Air-quality risk No data
- Unhealthy air days now
- —
- Unhealthy air days in 30 yrs
- —
Risk factors via First Street. Map © Google.
Why this score? — see what drove the D+ grade
The composite is a weighted blend of 9 inputs, each scored 0–100. Each bar is that input's sub-score; the figure is the points it added to the 100-point composite (weight × sub-score).
- Cash flow +15.3/30.0
- 1% rule +10.0/10.0
- ARV discount +7.5/15.0
- DSCR +4.7/10.0
- Livability +4.4/5.0
- Rent growth +2.5/5.0
- Schools +2.5/10.0
- Condition / age +2.5/5.0
- Appreciation +0.0/10.0
$80,000
🖨 Deal sheet 📄 Offer letter ✓ Due diligence
Listing remarks MLS
Well-maintained residences with an efficient layout, abundant natural light, and a practical flow for everyday comfort. Kitchens feature ample cabinetry and counter space; bedrooms provide generous closets. Enjoy on-site amenities and low-maintenance living with HOA-covered exterior upkeep. Prime Metairie location close by Veterans, Causeway, and I-10--minutes to shopping, dining, healthcare, and Lake Pontchartrain. Units 419 & 420 offered together for flexible living or investment or separately.
Key facts
- Ample cabinetry
- Generous closets
- On-site amenities
Tags
Property features AI
Finance
- Other: Pets allowed (cats and dogs OK; no pet restrictions listed)
- HOA & community: Association fee applies (includes electricity and gas); Common grounds/area
Exterior
- Parking: Two parking spaces
- Utilities: Well water; Sewer not available
- Home design: 2-story property; Very good condition; Has home warranty
- Construction: Brick veneer and vinyl siding; Shingle roof
- Exterior features: Covered wood porch/patio; City lot
Interior
- Bedrooms: Total of 4 rooms (includes bedrooms and living spaces)
- Bathrooms: 1 full bathroom; 1 half bathroom
- Heating & cooling: Central heating; Central air conditioning
- Interior features: Accessibility features; Wood-burning fireplace
Neighborhood map
What this means for you Summary
Snapshot
- This is a 2-bed/1.5-bath condo listed at $80k.
Deal economics
- At list price, monthly cash flow is $29 ($347/yr) — positive.
- The deal already cash-flows at list — no discount required.
- Meets the 1% rule at list price ($1k rent vs $80k).
- Cap rate 6.7% vs local median 3.6% in Metairie — top-decile yield for the area; either an underpriced asset or a hidden risk that comps aren't pricing in. Stress-test before assuming the spread holds.
Location & tenants
- Location reads 87/100 on livability (#1 in LA, #261 nationally) — a professional / high-income tenant draw. Strengths: commute A+, housing A+, health & safety A+.
- Jefferson Parish (suburban): math 24% / reading 34% proficiency, ranked #44 of 98 in LA (top 45%) — low school quality limits family demand, transient renter base, plan for 1-2y turnover; 70% free/reduced lunch — lower-income household profile, screen leases tightly.
- Market conditions: Rents soft (-0.0%/yr); 208 active listings in the ZIP; 40 comparable units currently listed for rent nearby; rentals lingering (median 44d on market — plan ~5-8 weeks vacancy on turnover, expect pricing pressure); 50% of comp listings sitting > 30 days — soft ceiling on asking rent; 518 units permitted in Jefferson Parish in 2024 (43 in 5+ unit buildings).
Forward outlook
- Local home prices are declining (-3.0%/yr); year-one equity from $553 of loan paydown is wiped out by about $2k of value loss. Plan a longer hold.
Negotiation context
- Only 14 days on market — expect competitive offers; lowballing is unlikely to land.
- 18 sale attempts since 21y ago with the ask held roughly flat each time — persistent listings suggest the price (not the market) is what's stuck; bring a comps-based counter.
Risks & watch-outs
- Watch-outs: HOA is 37% of rent.
Questions for the listing agent
- Built in 1978 — when were the roof, HVAC, electrical panel, plumbing, and water heater last replaced?
- What does the HOA fee cover, when was the last increase, and are there any pending special assessments or reserve-fund shortfalls?
- Any open or pending special assessments — roof, HVAC, plumbing, elevator, façade? What's the per-unit balance and payoff schedule, and is the seller paying it off at close or rolling it to the buyer?
- Is there a deadline driving the sale (1031 exchange, divorce, estate, relocation)? That informs how much negotiation room exists.
- Schools are B-rated — typically a magnet for longer-tenancy family renters. What's the average tenant stay here, and is there a school-zone premium baked into asking?
- The area grade is low — what's the realistic commute time and amenity access for the typical tenant pool here? Any planned neighborhood developments (good or bad) we should know about?
- What's the average days-on-market for RENTAL listings here right now (not sales)? A rising rental-DOM trend means longer vacancies and softer asking-rent achievability than the comps imply.
- What's the recent tenant-quality profile in this submarket — average credit score on applications, eviction rate, late-payment / NSF rate, and stable-employment percentage? A property-management company in the area should have these aggregated.
- How much new apartment / multifamily construction is in the pipeline within 1–3 miles? Heavy new supply (>2% of stock underway) typically softens rents 12–24 months out; light construction supports rent growth.
Investment metrics
- 1% rule
- 1.71% ✓
- Cap rate
- 6.73%
- Cash-on-cash
- 1.55%
- DSCR
- 1.07
- GRM
- 4.9
CMA / ARV
No comps found within radius.
Projected returns pro-forma
-3.0% appreciation · 0.0% rent growth · sell at horizon
- IRR
- -19.9%
- Equity multiple
- 0.34×
- Total profit
- $-14,810
- Equity at exit
- $11,928
- IRR
- -37.3%
- Equity multiple
- -0.10×
- Total profit
- $-24,713
- Equity at exit
- $6,917
Cash invested: $22,400 (down + closing). Projections, not guarantees.
Landlord ↔ Tenant lean methodology
- Overall (STATE)
- 90 Strongly Landlord-Friendly
- State Louisiana
- 90 Strongly Landlord-Friendly · R+12
- County
- — inherits STATE
- City
- — inherits STATE
ZIP-level market 70001
- Rents YoY
- -0.0%
- Active inventory
- 208
- Price-to-rent
- 4.9×
Monthly cashflow live
- Estimated rent
- $1,370 high interval (Pro) →
- Mortgage (P&I)
- −$420
- Tax from tax record
- −$90 /mo · $1,079/yr
- Insurance
- −$33
- HOA
- −$511
- Vacancy / Maint / Mgmt
- −$288
- Net cashflow
- $29
Break-even live
UW: 25.0% down · 7.5% · 30yr · 1.5% tax · 5.0% vac · 8.0% maint · 8.0% mgmt
Financing live
Cash to close
- Down payment
- $20,000
- Closing costs
- $2,400
- Reserves months
- —
- Total cash needed
- —
Loan-product check · same deal, 3 products live
Conventional
25% down · 7.5% · 30yr
- Down + closing
- —
- Monthly P&I
- —
- Monthly cashflow
- —
- DSCR
- —
- Eligible?
- —
Personal DTI + credit; lowest rate.
DSCR
20% down · 8.5% · 30yr
- Down + closing
- —
- Monthly P&I
- —
- Monthly cashflow
- —
- DSCR
- —
- Eligible?
- —
No personal income docs; deal must DSCR.
Hard money
10% down · 12.0% · 12mo
- Down + closing
- —
- Monthly P&I
- —
- Monthly cashflow
- —
- DSCR
- —
- Eligible?
- —
Short-term bridge; refi at stabilization.
Rent comps 40 comps
| Address | Beds | Baths | Sqft | Rent | $/sqft | DOM | Units | Dist |
|---|---|---|---|---|---|---|---|---|
| 4048 Durand St Apt 3 Metairie, LA | 2.0 | 1.5 | 1000 | $1,300 | $1.30 | 44d | 1 | 0.00mi |
| 2500 Richland Ave Unit D Metairie, LA | 2.0 | 1.5 | 980 | $1,375 | $1.40 | 4d | 1 | 0.03mi |
| 2500 Manson Ave Metairie, LA | 2.0 | 1.5 | 1000 | $1,350 | $1.35 | 23d | 1 | 0.06mi |
| 2509 Giuffrias Ave #516 Metairie, LA | 1.0 | 1.0 | 900 | $1,175 | $1.31 | 23d | 1 | 0.06mi |
| 2509 Giuffrias Ave #510 Metairie, LA | 1.0 | 1.0 | 900 | $1,175 | $1.31 | 44d | 1 | 0.06mi |
| 4056 Durand St Unit 2 Metairie, LA | 2.0 | 1.5 | 1000 | $1,300 | $1.30 | 44d | 1 | 0.08mi |
| 2401 Pasadena Ave Unit 9 Metairie, LA | 1.0 | 1.0 | 600 | $950 | $1.58 | 44d | 1 | 0.12mi |
| 2513 Pasadena Ave #303 Metairie, LA | 1.0 | 1.0 | 800 | $1,100 | $1.38 | 4d | 1 | 0.13mi |
| 2513 Pasadena Ave #203 Metairie, LA | 1.0 | 1.0 | 643 | $1,100 | $1.71 | 23d | 1 | 0.13mi |
| 2416 Pasadena Ave Unit 308-2 Metairie, LA | 2.0 | 1.0 | 775 | $1,195 | $1.54 | 4d | 1 | 0.15mi |
| 2220 Cleary Ave Metairie, LA | 1.0–2.0 | 1.0 | 806 | $1,429 | $1.77 | 1d | 6 | 0.18mi |
| 2224 Pasadena Ave Unit 208 Metairie, LA | 1.0 | 1.0 | 550 | $885 | $1.61 | 44d | 1 | 0.20mi |
| 4216 Eporia St Unit D Metairie, LA | 2.0 | 1.5 | 1000 | $1,500 | $1.50 | 23d | 1 | 0.21mi |
| 2413 Houma Blvd Metairie, LA | 1.0 | 1.0 | 925 | $1,750 | $1.89 | 44d | 1 | 0.24mi |
| 2417 Houma Blvd Metairie, LA | 2.0 | 1.0 | 1000 | $1,700 | $1.70 | 4d | 1 | 0.24mi |
| 2417 Houma Blvd Unit B Metairie, LA | 2.0 | 1.0 | 950 | $1,775 | $1.87 | 23d | 1 | 0.24mi |
| 2417 Houma Blvd Unit D Metairie, LA | 2.0 | 1.0 | 1000 | $1,800 | $1.80 | 23d | 1 | 0.24mi |
| 2129 Pasadena Ave Apt C Metairie, LA | 2.0 | 1.0 | 1085 | $1,250 | $1.15 | 44d | 1 | 0.24mi |
| 2509 Houma Blvd Unit 103 Metairie, LA | 2.0 | 2.0 | 900 | $1,400 | $1.56 | 44d | 1 | 0.24mi |
| 2509 Houma Blvd Unit 301 Metairie, LA | 2.0 | 2.0 | 1000 | $1,500 | $1.50 | 23d | 1 | 0.24mi |
| 2121 Cleary Ave Unit 5 Metairie, LA | 1.0 | 1.0 | 526 | $875 | $1.66 | 23d | 1 | 0.27mi |
| 2500 Houma Blvd #322 Metairie, LA | 1.0 | 1.0 | 625 | $1,550 | $2.48 | 44d | 1 | 0.29mi |
| 2500 Houma Blvd #320 Metairie, LA | 1.0 | 1.0 | 590 | $1,195 | $2.03 | 20d | 1 | 0.29mi |
| 2500 Houma Blvd #222 Metairie, LA | 1.0 | 1.0 | 590 | $1,450 | $2.46 | 44d | 1 | 0.29mi |
| 3113 Cleary Ave Metairie, LA | 2.0 | 1.0 | 946 | $1,148 | $1.21 | 44d | 1 | 0.37mi |
| 2713 Kingman St Unit D Metairie, LA | 2.0 | 1.0 | 940 | $1,250 | $1.33 | 23d | 1 | 0.38mi |
| 2713 Kingman St Unit C Metairie, LA | 2.0 | 1.0 | 940 | $1,250 | $1.33 | 44d | 1 | 0.38mi |
| 3017 Lake Villa Dr Unit 4 Metairie, LA | 2.0 | 1.0 | 655 | $1,050 | $1.60 | 44d | 1 | 0.38mi |
| 3100 Lake Villa Dr Metairie, LA | 1.0 | 1.0 | 1100 | $1,800 | $1.64 | 44d | 1 | 0.41mi |
| 3000 Independence St Metairie, LA | 2.0 | 1.5 | 1000 | $1,200 | $1.20 | 44d | 2 | 0.44mi |
| 3009 Houma Blvd Unit D Metairie, LA | 2.0 | 1.5 | 900 | $1,500 | $1.67 | 44d | 1 | 0.47mi |
| 3009 Houma Blvd Unit A Metairie, LA | 2.0 | 1.5 | 900 | $1,450 | $1.61 | 23d | 1 | 0.47mi |
| 3015 Jodie Pl Metairie, LA | 2.0 | 1.0 | 1000 | $1,275 | $1.27 | 23d | 1 | 0.54mi |
| 2330 Edenborn Ave #227 Metairie, LA | 1.0 | 1.0 | 550 | $975 | $1.77 | 44d | 1 | 0.67mi |
| 2330 Edenborn Ave #107 Metairie, LA | 1.0 | 1.0 | 550 | $1,125 | $2.05 | 44d | 1 | 0.67mi |
| 2330 Edenborn Ave #205 Metairie, LA | 1.0 | 1.0 | 550 | $1,100 | $2.00 | 23d | 1 | 0.67mi |
| 2330 Edenborn Ave #321 Metairie, LA | 1.0 | 1.0 | 544 | $1,100 | $2.02 | 4d | 1 | 0.67mi |
| 4752 W Napoleon Ave #6 Metairie, LA | 1.0 | 1.0 | 950 | $1,100 | $1.16 | 4d | 1 | 0.75mi |
| 2301 Edenborn Ave #1007 Metairie, LA | 2.0 | 1.0 | 864 | $1,200 | $1.39 | 44d | 1 | 0.76mi |
| 2301 Edenborn Ave #507 Metairie, LA | 2.0 | 1.0 | 830 | $1,450 | $1.75 | 44d | 1 | 0.76mi |
HOA detail condo
- Monthly dues
- $511 · $6,132/yr
- Assessments
- None detected in remarks — confirm with the listing agent.
Listing history 10 events
-
2026-06-18days on market $80,000 Active 14 DOM
-
2026-06-17days on market $80,000 Active 13 DOM
-
2026-06-16days on market $80,000 Active 12 DOM
-
2026-06-15days on market $80,000 Active 11 DOM
-
2026-06-13days on market $80,000 Active 9 DOM
-
2026-06-10days on market $80,000 Active 6 DOM
-
2026-06-09days on market $80,000 Active 5 DOM
-
2026-06-08days on market $80,000 Active 4 DOM
-
2026-06-07remarks 502-char remark
-
2026-06-07$80,000 Active 3 DOM
ⓘ Source: listings_history table (triggers on properties + properties_extension) + one-shot
backfill from property_details.listing_events for pre-trigger history.
Tax reassessment forecast LA · Resets to sale price
- Current annual tax
- $1,079 · $90/mo
- Projected year-2 tax
- $1,079 · $90/mo
- Expected delta
- $0/yr ($0/mo · 0.0%)
ⓘ Screening estimate from a state-policy table — verify with the county assessor before closing.
Nearby sold comps map
Loading sold comps map…
Walkable amenities ~0.75 mi
Loading nearby amenities…
Taxation est. · year 1
- Rental income
- $16,446
- − Mortgage interest
- −$4,481
- − Property taxes
- −$1,079
- − Insurance
- −$400
- − Repairs & maintenance
- −$1,316
- − Management
- −$1,316
- − HOA
- −$6,132
- − Depreciation
- −$2,327
- Taxable loss
- −$605
- Est. tax savings @ 24.0%
- +$145
- After-tax cash flow
- $492/yr
For passive investors: Depreciation is non-cash, so a rental often shows a tax loss while cash-flowing — sheltering income. Rental losses are passive: they offset passive income freely, and up to $25,000/yr can offset ordinary (W-2) income if you actively participate and your MAGI is under $100k (phasing out to $0 by $150k); unused losses carry forward. On sale, claimed depreciation is recaptured at up to 25%, and gains may owe capital-gains tax (a 1031 exchange can defer both). Figures are a year-1 estimate at your 24.0% rate — not tax advice; consult a CPA.
Schools (NCES district)
- District
- Jefferson Parish
- NCES district ID
- 2200840
- Math proficiency
- 24% ▼ -36.00%
- Reading proficiency
- 34% ▼ -30.00%
- Median HH income
- $48,421
- Composite
- 25.19/100
- National rank
- #7511
- State rank
- #44 of 98 in LA
Livability — Metairie
- Score
- 87/100
- State rank
- #1
- US rank
- #261
Category grades
Schools grade is shown separately in the Schools card above.
Census & demographics
- Census place
- Metairie, LA
- County
- Jefferson Parish · 426,999 people
- City population
- 137,978
- Metro
- New Orleans-Metairie, LA
- Population (ZIP)
- 38,950
- Household income
- $67,923
- Rent vs Own
- Severe rent burden
- 1988.0
Population outlook (Jefferson County) Hauer SSP2
- Today (2025)
- 451,696 people
- By 2030
- 455,451 · +0.8%
- By 2040
- 458,308 · +1.5%
- By 2050
- 461,031 · +2.1%
- By 2075
- 476,351 · +5.5%
- By 2100
- 499,377 · +10.6%
Race, ethnicity, and origin ACS 2023
- Neighborhood character
- Diverse neighborhood (Simpson 0.57)
- Race & ethnicity
- White 62% Hispanic / Latino 17% Black 15% Two or more races 11% Asian 2%
- Hispanic origin (detail)
- Mexican 1% Cuban 2%
- Common ancestry
- Lithuanian 13% Italian 1% Hispanic 1%
- Foreign-born
- 12% · Canada, China, Philippines
- Languages at home
- 84% English-only · Spanish 12% Arabic 1% Other Indo-European 1%
Political lean MEDSL · Jefferson
- 2024 margin
- R (+12.9) · D 42.5% · R 55.5% · Other 2.1%
- 2008→2024 swing
- +13.6pp toward D · 2008: -26.6pp · 2024: -12.9pp
- All cycles
- 2024: R+12.9 2020: R+11.1 2016: R+14.8 2012: R+18.4 2008: R+26.6
Not yet ingested
- Civics
- —
Market trends
- HPI YoY
- ▼ -296.45%
- Current HPI
- 151.4615
- Rent YoY
- ▬ -0.04%
- Metro
- New Orleans-Metairie, LA
- State GDP YoY
- ▲ 3.29%
- F500 in state
- 10
Industry mix (Fortune 500 HQ in LA)
| Industry | F500 HQs | Revenue |
|---|---|---|
| Telecommunications | 2 | $23B |
|
||
| Utilities | 1 | $12B |
|
||
| Wholesale / Distribution | 1 | $5B |
|
||
| Advertising | 1 | $2B |
|
||
Price history
+142.4% since first listed34 events — show timeline
- 2026-06-04 Listed $80,000 AcadianaMLS
- 2026-06-04 Listed $80,000 GSREIN
- 2026-04-23 Rental Removed $1,500 RAAMLS
- 2026-03-18 Listed for Rent $1,450 RAAMLS
- 2026-03-18 Rental Removed $1,500 GSREIN
- 2025-08-24 Listed for Rent $1,500 GSREIN
- 2025-06-26 Rental Removed $1,500 GSREIN
- 2024-12-31 Price Changed $1,500 GSREIN
- 2024-12-17 Listed for Rent $1,600 GSREIN
- 2024-10-01 Sold (MLS) $90,000 GSREIN
- 2024-09-06 Contingent — GSREIN
- 2024-09-01 Listed $105,000 AcadianaMLS
- 2024-09-01 Listed $105,000 GSREIN
- 2024-01-06 Rental Removed $1,300 GSREIN
- 2023-11-01 Listed for Rent $1,300 GSREIN
- 2023-07-17 Listed $112,000 AcadianaMLS
- 2020-10-26 Sold (Public Records) $55,000 Public Records
- 2020-10-15 Sold (MLS) $55,000 GSREIN
- 2020-09-16 Pending — GSREIN
- 2020-08-18 Listed $60,000 AcadianaMLS
- 2020-08-18 Listed $60,000 GSREIN
- 2018-10-26 Listed $65,000 AcadianaMLS
- 2014-04-15 Sold (MLS) $15,500 GSREIN
- 2013-09-23 Sold (Public Records) $60,100 Public Records
- 2013-08-19 Listed $15,900 AcadianaMLS
- 2013-08-19 Listed $15,900 GSREIN
- 2008-04-29 Listed $119,900 AcadianaMLS
- 2008-04-29 Listed $119,900 GSREIN
- 2008-04-29 Sold (MLS) $119,900 GSREIN
- 2006-02-24 Sold (Public Records) $75,100 Public Records
- 2005-11-01 Sold (MLS) $75,100 GSREIN
- 2005-08-02 Listed $75,000 AcadianaMLS
- 2005-08-02 Listed $75,000 GSREIN
- 2001-10-01 Sold (Public Records) $33,000 Public Records
Property tax history
+13.5%/yrLatest (2025): $1,079 · +52.1% YoY. Source: county tax records.
Cash-flow waterfall
monthlySold comps — $/sqft
last 12 mo · ≤1 miLoading sold comps…