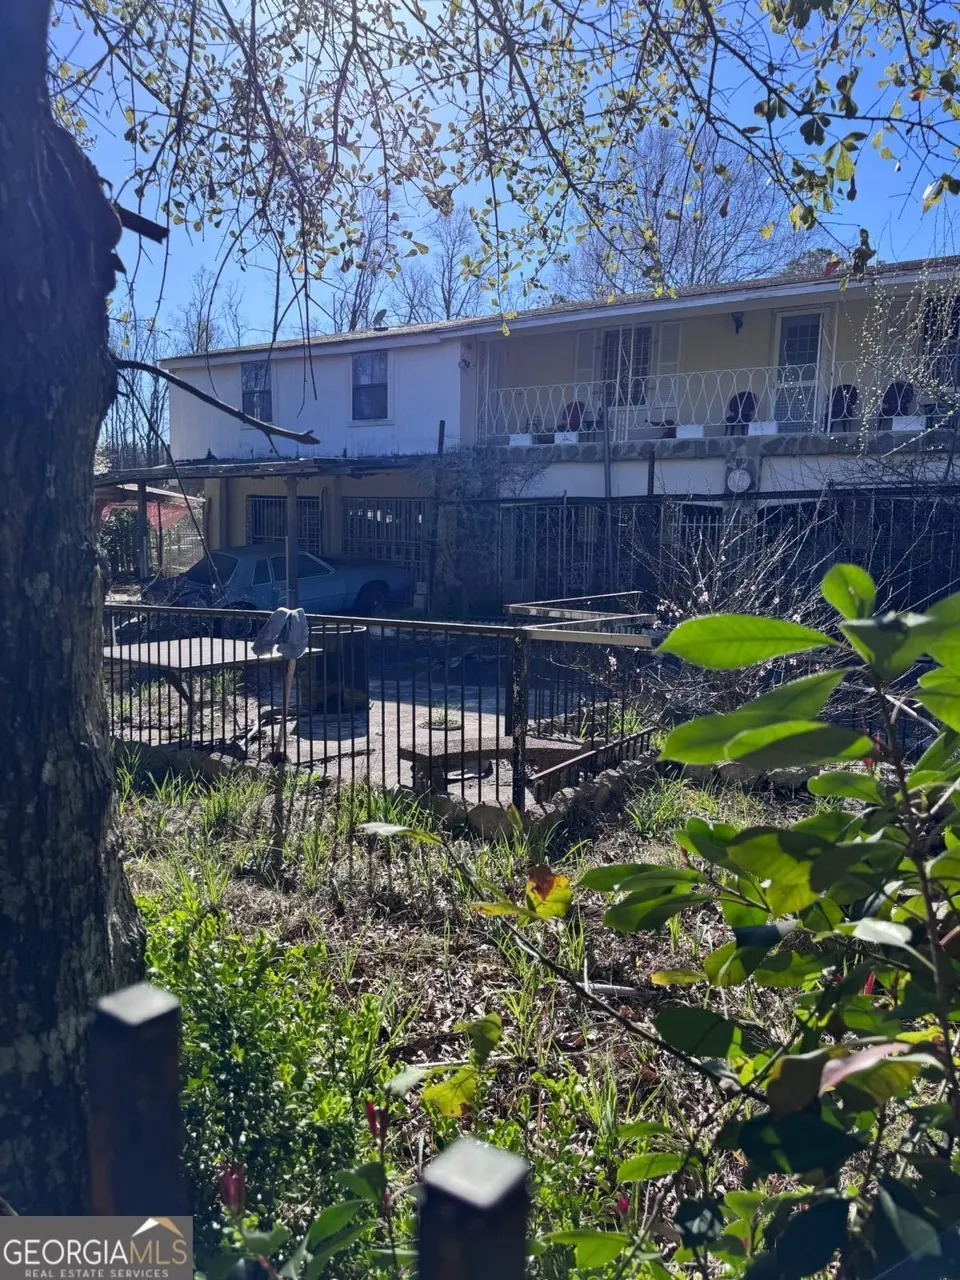
611 S Bead St · Alma, GA
Flood risk 1/10 · Minimal
- FEMA flood zone
- X (unshaded)
- Chance of flooding over 30 yrs
- 0.0%
- Est. flood insurance / yr
- $507 – $1,088
Fire risk 6/10 · Moderate
- Est. fire insurance / yr
- $963 – $1,789
Heat risk 8/10 · Major
- Hot days now (above 107°F)
- 7 days/yr
- Hot days in 30 yrs
- 19 days/yr
Wind risk 8/10 · Major
- Chance of severe wind over 30 yrs
- 98.0%
Air-quality risk 4/10 · Minor
- Unhealthy air days now
- 4 days/yr
- Unhealthy air days in 30 yrs
- 4 days/yr
Risk factors via First Street. Map © Google.
Why this score? — see what drove the A- grade
The composite is a weighted blend of 9 inputs, each scored 0–100. Each bar is that input's sub-score; the figure is the points it added to the 100-point composite (weight × sub-score).
- Cash flow +30.0/30.0
- ARV discount +15.0/15.0
- DSCR +10.0/10.0
- 1% rule +9.7/10.0
- Appreciation +5.2/10.0
- Schools +3.5/10.0
- Livability +2.7/5.0
- Rent growth +2.5/5.0
- Condition / age +2.5/5.0
$90,000
🖨 Deal sheet (PDF) 📄 Offer letter ✓ Due diligence
Listing remarks
Located within city limits, this 3bd/3bth house has a split level floor plan with over 2800 sqft. This unique property features a large bonus room, extensive master suite, balconies and an in-ground pool. It may be considered as an Investment opportunity for a multi unit rental property. The possibilities are endless! This home is sold AS IS with most of the furnishings!
Key facts
- In-ground pool
- Large bonus room
- 0.35 acre lot
Tags
Property features AI
Finance
- Financial info: Selling as-is; Listing accepts Cash and Conventional offers
- HOA & community: No HOA
Exterior
- Parking: Garage (1 parking space)
- Utilities: Public water; Public sewer; Cable available; Electricity available; Sewer connected; Water available
- Home design: Single-family residence; Residential property; Multi/split story; Structure listed as other; Fixer condition
- Construction: Built in 1972; Block and vinyl siding construction; Slab foundation; Composition roof
- Exterior features: Fenced yard; Corner lot; In-ground pool; Garage(s) and shed(s) on the property
Interior
- Kitchen: Dishwasher; Refrigerator
- Bedrooms: 3 bedrooms
- Flooring: Carpet; Tile; Other
- Bathrooms: 3 full bathrooms (one full bathroom on the lower level)
- Heating & cooling: Central heating; Central air conditioning; Has heating and cooling
- Interior features: Other interior features; Multi/split levels; Partial basement; Family room
- Laundry & utility: Laundry located in basement
Neighborhood map
What this means for you Summary
Snapshot
- This is a 3-bed/2.0-bath single-family listed at $90k.
Deal economics
- At list price, monthly cash flow is $369 ($4k/yr) — positive.
- The deal already cash-flows at list — no discount required.
- Meets the 1% rule at list price ($1k rent vs $90k).
- Recommended offer: $87k (3.0% below list) — sets the bar for market timing.
Location & tenants
- Location reads 54/100 on livability (#530 in GA) — a working-class tenant base; expect higher turnover. Strengths: cost of living A+, housing A; Watch: health & safety C-, crime F, amenities F.
- Bacon County (rural): math 48% / reading 36% proficiency, ranked #43 of 174 in GA (top 25%) — families likely to look elsewhere, expect single-tenant / working-renter base with shorter leases.
- Zoned schools: Bacon County Primary School (571 students, 90% FRL); Bacon County Middle School (math 37% / reading 36%, grade F, #167 of 470 statewide, top 38%, 465 students, 78% FRL); Bacon County High School (math 32% / reading 8%, grade F, #238 of 424 statewide, top 57%, 641 students, 58% FRL) — zoned schools average 75% FRL vs 58% district-wide (17 pts higher); higher-poverty schools than district average — tighter screening recommended.
- Zoned-school proficiency averages 28% at this address vs 42% district-wide (-14 pts) — the specific schools serving this property underperform the Bacon County average; the district grade overstates school quality for this exact location.
- Market conditions: 38 active listings in the ZIP.
Forward outlook
- In year one you build about $1k of equity ($622 loan paydown + $400 appreciation (0.4% local appreciation)).
- Bacon County population projected at +5% by 2050 — modest demand growth; plan on rents tracking national, not racing it.
- At projected returns (0.4% appreciation + 3.0% rent growth), your $25k cash investment doubles in ~5 years — after that, you're playing with house money.
Negotiation context
- It's been on market 53 days — a 3% lower offer ($87k) is reasonable based on typical stale-listing flexibility.
Risks & watch-outs
- Climate carrying-cost: severe wind risk, 98% chance of damaging wind over 30y; major wildfire risk; extreme-heat days projected 7→19/yr by 2055 (HVAC capex compounding) — expect insurance premiums to compound above CPI over the hold.
Questions for the listing agent
- It's been on market 53 days. Have you received any prior offers? Is the seller open to a 3% concession, seller financing, or rate buy-down credit?
- Built in 1972 — when were the roof, HVAC, electrical panel, plumbing, and water heater last replaced?
- Is there a deadline driving the sale (1031 exchange, divorce, estate, relocation)? That informs how much negotiation room exists.
- Schools are F-rated, which usually means shorter tenancies and higher turnover. Who's the typical renter profile here, and what's been the actual vacancy rate?
- Crime grade is F in this area — have there been break-ins, vandalism, or insurance claims at this property in the last 3 years? What carrier currently insures it and at what premium?
- What's the average days-on-market for RENTAL listings here right now (not sales)? A rising rental-DOM trend means longer vacancies and softer asking-rent achievability than the comps imply.
- What's the recent tenant-quality profile in this submarket — average credit score on applications, eviction rate, late-payment / NSF rate, and stable-employment percentage? A property-management company in the area should have these aggregated.
- How much new for-sale + rental construction is in the pipeline within 1–3 miles? Heavy new supply typically softens prices + rents 12–24 months out; constrained supply supports both.
Investment metrics
- 1% rule
- 1.47% ✓
- Cap rate
- 11.21%
- Cash-on-cash
- 17.56%
- DSCR
- 1.78
- GRM
- 5.7
CMA / ARV
- ARV (median comp)
- $178,725
- List price
- $90,000
- Delta
- -49.64%
- Verdict
- UNDERPRICED
- Comps
- 11 within 2.0 mi
Projected returns pro-forma
0.44% appreciation · 3.0% rent growth · sell at horizon
- IRR
- 18.3%
- Equity multiple
- 1.91×
- Total profit
- $22,808
- Equity at exit
- $28,152
- IRR
- 22.1%
- Equity multiple
- 3.55×
- Total profit
- $64,318
- Equity at exit
- $35,496
Cash invested: $25,200 (down + closing). Projections, not guarantees.
Landlord ↔ Tenant lean methodology
- Overall (STATE)
- 90 Strongly Landlord-Friendly
- State Georgia
- 90 Strongly Landlord-Friendly · R+3
- County
- — inherits STATE
- City
- — inherits STATE
ZIP-level market 31510
- Home prices YoY
- 0.2%
- Active inventory
- 38
- Price-to-rent
- 5.7×
Monthly cashflow live
- Estimated rent
- $1,324 medium interval (Pro) →
- Mortgage (P&I)
- −$472
- Tax from tax record
- −$167 /mo · $2,010/yr
- Insurance
- −$38
- HOA
- −$0
- Vacancy / Maint / Mgmt
- −$278
- Net cashflow
- $369
Break-even live
Sensitivity live
| Price | -10% $420 | -5% $394 | +0% $369 | +5% $343 | +10% $318 |
|---|---|---|---|---|---|
| Rent | -10% $264 | -5% $317 | +0% $369 | +5% $421 | +10% $473 |
| Rate | -1.0pp $414 | -0.5pp $392 | base $369 | +0.5pp $345 | +1.0pp $322 |
UW: 25.0% down · 7.5% · 30yr · 1.5% tax · 5.0% vac · 8.0% maint · 8.0% mgmt
Financing live
Cash to close
- Down payment
- $22,500
- Closing costs
- $2,700
- Reserves months
- —
- Total cash needed
- —
Loan-product check · same deal, 3 products live
Conventional
25% down · 7.5% · 30yr
- Down + closing
- —
- Monthly P&I
- —
- Monthly cashflow
- —
- DSCR
- —
- Eligible?
- —
Personal DTI + credit; lowest rate.
DSCR
20% down · 8.5% · 30yr
- Down + closing
- —
- Monthly P&I
- —
- Monthly cashflow
- —
- DSCR
- —
- Eligible?
- —
No personal income docs; deal must DSCR.
Hard money
10% down · 12.0% · 12mo
- Down + closing
- —
- Monthly P&I
- —
- Monthly cashflow
- —
- DSCR
- —
- Eligible?
- —
Short-term bridge; refi at stabilization.
Listing history 18 events
-
2026-06-21days on market $90,000 Active 53 DOM
-
2026-06-21days on market $90,000 Active 52 DOM
-
2026-06-18days on market $90,000 Active 50 DOM
-
2026-06-17days on market $90,000 Active 49 DOM
-
2026-06-16days on market $90,000 Active 48 DOM
-
2026-06-15days on market $90,000 Active 47 DOM
-
2026-06-13days on market $90,000 Active 45 DOM
-
2026-06-12days on market $90,000 Active 44 DOM
-
2026-06-09days on market $90,000 Active 41 DOM
-
2026-06-08days on market $90,000 Active 40 DOM
-
2026-06-07days on market $90,000 Active 39 DOM
-
2026-06-05days on market $90,000 Active 37 DOM
-
2026-06-04days on market $90,000 Active 35 DOM
-
2026-06-02days on market $90,000 Active 34 DOM
-
2026-06-01days on market $90,000 Active 33 DOM
-
2026-05-31days on market $90,000 Active 32 DOM
-
2026-05-31days on market $90,000 Active 31 DOM
-
2025-03-27$90,000 New 373-char remark
ⓘ Source: listings_history table (triggers on properties + properties_extension) + one-shot
backfill from property_details.listing_events for pre-trigger history.
Tax reassessment forecast GA · Resets to sale price
- Current annual tax
- $2,010 · $167/mo
- Projected year-2 tax
- $2,010 · $167/mo
- Expected delta
- $0/yr ($0/mo · -0.0%)
ⓘ Screening estimate from a state-policy table — verify with the county assessor before closing.
Climate risk First Street
- Flood 1/10 Low FEMA zone X (unshaded) · 0% chance over 30 yrs
- Wildfire 6/10 Major
- Heat 8/10 Severe 7 d/yr ≥107°F today · 19 d/yr by 30 yrs out
- Wind 8/10 Severe 98% chance of damaging wind over 30 yrs
- Air quality 4/10 Moderate 4 unhealthy d/yr today · 4 by 30 yrs out
Nearby sold comps map
Loading sold comps map…
Walkable amenities ~0.75 mi
Loading nearby amenities…
Taxation est. · year 1
- Rental income
- $15,885
- − Mortgage interest
- −$5,041
- − Property taxes
- −$2,010
- − Insurance
- −$450
- − Repairs & maintenance
- −$1,271
- − Management
- −$1,271
- − Depreciation
- −$2,618
- Taxable income
- $3,224
- Est. tax owed @ 24.0%
- −$774
- After-tax cash flow
- $3,652/yr
For passive investors: Depreciation is non-cash, so a rental often shows a tax loss while cash-flowing — sheltering income. Rental losses are passive: they offset passive income freely, and up to $25,000/yr can offset ordinary (W-2) income if you actively participate and your MAGI is under $100k (phasing out to $0 by $150k); unused losses carry forward. On sale, claimed depreciation is recaptured at up to 25%, and gains may owe capital-gains tax (a 1031 exchange can defer both). Figures are a year-1 estimate at your 24.0% rate — not tax advice; consult a CPA.
Schools (NCES district)
- District
- Bacon County
- NCES district ID
- 1300150
- Math proficiency
- 48% ▬ 0.00%
- Reading proficiency
- 36% ▼ -5.00%
- Median HH income
- $35,087
- Composite
- 34.79/100
- National rank
- #5112
- State rank
- #43 of 174 in GA
Livability — Alma
- Score
- 54/100
- State rank
- #530
- US rank
- #23747
Category grades
Schools grade is shown separately in the Schools card above.
Census & demographics
- Census place
- Alma, GA
- Population (ZIP)
- 9,592
Population outlook (Bacon County) Hauer SSP2
- Today (2025)
- 11,676 people
- By 2030
- 11,831 · +1.3%
- By 2040
- 12,066 · +3.3%
- By 2050
- 12,250 · +4.9%
- By 2075
- 12,308 · +5.4%
- By 2100
- 11,278 · -3.4%
Race, ethnicity, and origin ACS 2023
- Neighborhood character
- Predominantly White (69%)
- Race & ethnicity
- White 69% Black 17% Hispanic / Latino 10% Two or more races 7%
- Hispanic origin (detail)
- Mexican 9%
- Common ancestry
- Slovak 4% Italian 1%
- Foreign-born
- 4% · Canada
- Languages at home
- 91% English-only · Spanish 7% Other Indo-European 1%
Political lean MEDSL · Bacon
- 2024 margin
- Solid R (+73.2) · D 13.3% · R 86.5%
- 2008→2024 swing
- -15.5pp toward R · 2008: -57.7pp · 2024: -73.2pp
- All cycles
- 2024: R+73.2 2020: R+72.7 2016: R+68.5 2012: R+58.6 2008: R+57.7
Not yet ingested
- Civics
- —
Market trends
- HPI YoY
- ▲ 0.44%
- Current HPI
- 236.7103
- Rent YoY
- —
- Metro
- —
- State GDP YoY
- ▲ 2.66%
- F500 in state
- 28
Industry mix (Fortune 500 HQ in GA)
| Industry | F500 HQs | Revenue |
|---|---|---|
| Paper / Packaging | 2 | $29B |
|
||
| Retail | 1 | $160B |
|
||
| Transportation / Logistics | 1 | $91B |
|
||
| Airlines | 1 | $62B |
|
||
| Consumer Goods | 1 | $47B |
|
||
| Utilities | 1 | $25B |
|
||
Price history
1 event — show timeline
- 2025-03-27 Listed $90,000 GAMLS
Property tax history
+4.8%/yrLatest (2025): $2,010 · -1.1% YoY. Source: county tax records.
Cash-flow waterfall
monthlySold comps — $/sqft
last 12 mo · ≤1 miLoading sold comps…