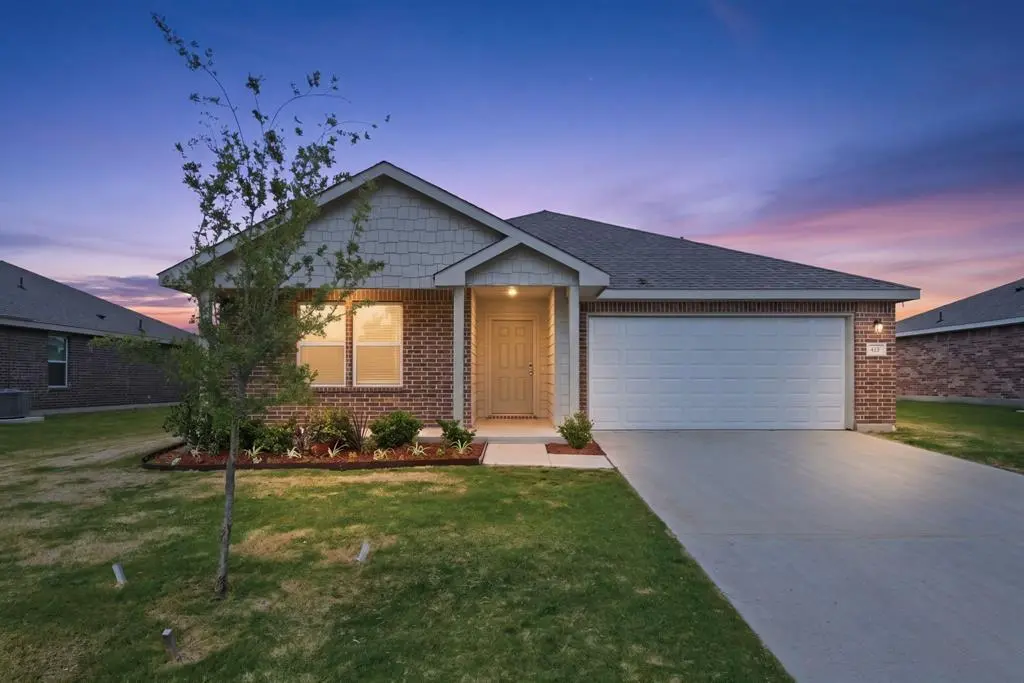
521 Jameson St · Springtown, TX
Flood risk 1/10 · Minimal
- FEMA flood zone
- X (unshaded)
- Chance of flooding over 30 yrs
- 0.0%
- Est. flood insurance / yr
- $507 – $1,088
Fire risk 7/10 · Major
- Est. fire insurance / yr
- $1,222 – $2,270
Heat risk 7/10 · Major
- Hot days now (above 109°F)
- 7 days/yr
- Hot days in 30 yrs
- 21 days/yr
Wind risk 6/10 · Moderate
- Chance of severe wind over 30 yrs
- 27.0%
Air-quality risk 3/10 · Minor
- Unhealthy air days now
- 2 days/yr
- Unhealthy air days in 30 yrs
- 3 days/yr
Risk factors via First Street. Map © Google.
Why this score? — see what drove the D- grade
The composite is a weighted blend of 9 inputs, each scored 0–100. Each bar is that input's sub-score; the figure is the points it added to the 100-point composite (weight × sub-score).
- Cash flow +10.7/30.0
- ARV discount +7.5/15.0
- Livability +3.4/5.0
- Schools +3.3/10.0
- 1% rule +3.1/10.0
- DSCR +3.1/10.0
- Rent growth +2.5/5.0
- Condition / age +2.5/5.0
- Appreciation +0.0/10.0
$285,000
🖨 Deal sheet (PDF) 📄 Offer letter ✓ Due diligence
Listing remarks
Welcome to a charming home nestled inside a small family friendly neighborhood in Springtown with sidewalks throughout. Conveniently located approximately 3 min to town and amenities. Step inside to this open concept layout floor plan that is bright and inviting. Perfect for entertaining or family gatherings. Four generous size bedrooms with two baths and two car garage. Oversized primary closet with ample storage throughout the home. Granite countertops, stainless steel appliances and the refrigerator, washer and dryer will convey with the sale of the home. No HOA this home is MOVE IN READY! Located about 35 minutes from Lockheed and the metroplex.
Key facts
- Granite countertops
- Move in ready
- No hoa
Tags
Property features AI
Finance
- Other: Property type: Single Family Residence; Lot less than 0.5 acre (approx. 0.19 acre)
- Financial info: Accepts Cash, Conventional, FHA, VA Loan, and 1031 Exchange; No second mortgage
- HOA & community: No homeowners association
Exterior
- Parking: Attached 2-car garage; 2 covered assigned parking spaces
- Utilities: City sewer; Co-op electric; All-weather road; Not in a municipal utility district
- Home design: Single family residence; Residential property; One story; Preowned (built 2023); Subdivision: Boardwalk Estates; GPS-friendly location
- Construction: Built in 2023; Brick, siding, and wood exterior; Composition roof; Slab foundation
- Exterior features: Covered patio/porch
Interior
- Kitchen: Dishwasher; Electric range; Microwave; Refrigerator; Granite counters; Kitchen island
- Bedrooms: Primary bedroom (level 1) — approx. 14 x 15; Bedroom (level 1) — approx. 11 x 13; Bedroom (level 1) — approx. 13 x 11; Bedroom (level 1) — approx. 14 x 11
- Flooring: Carpet
- Bathrooms: 2 full bathrooms
- Heating & cooling: Electric heating; Electric cooling
- Interior features: Open floorplan; Kitchen island; Granite counters; High-speed internet available; One living area; One dining area; Room count: 5; Levels: One
- Laundry & utility: Full-size washer/dryer area; Electric dryer hookup; Washer; Dryer
Neighborhood map
What this means for you Summary
Snapshot
- This is a 4-bed/2.0-bath other listed at $285k.
Deal economics
- At list price, monthly cash flow is $-136 ($-2k/yr) — negative.
- To cash-flow at today's rent, offer at most $261k (8.4% below list).
- To meet the 1% rule (rent ≥ 1% of price), the offer needs to be $229k (19.5% below list).
- Recommended offer: $229k (19.5% below list) — sets the bar for 1% rule.
- Cap rate 5.7% vs local median 3.3% in Springtown — top-decile yield for the area; either an underpriced asset or a hidden risk that comps aren't pricing in. Stress-test before assuming the spread holds.
Location & tenants
- Location reads 68/100 on livability (#461 in TX) — a middle-class / working-renter tenant base. Strengths: cost of living A+, housing A+, crime B+; Watch: health & safety D+, amenities F, commute F.
- Springtown ISD (town): math 36% / reading 40% proficiency, ranked #435 of 826 in TX (top 53%) — families likely to look elsewhere, expect single-tenant / working-renter base with shorter leases.
- Zoned schools: Springtown El (math 37% / reading 42%, grade F, #1,545 of 4,322 statewide, top 38%, 674 students, 60% FRL); Springtown Middle (math 33% / reading 45%, grade F, #690 of 1,662 statewide, top 42%, 628 students, 50% FRL); Springtown H S (math 38% / reading 47%, grade F, #721 of 1,632 statewide, top 45%, 1,182 students, 40% FRL) — zoned schools at 50% FRL track the district average.
- Market conditions: 531 active listings in the ZIP; 6 comparable units currently listed for rent nearby; rentals at typical pace (median 22d on market — plan ~3-4 weeks tenant-placement turnaround); solid renter incomes; 437 units permitted in Parker County in 2024 (0 in 5+ unit buildings).
Forward outlook
- Local home prices are declining (-3.0%/yr); year-one equity from $2k of loan paydown is wiped out by about $9k of value loss. Plan a longer hold.
- Parker County population projected at +32% by 2050 — long-run rental-demand tailwind backs the buy-and-hold thesis.
Negotiation context
- It's been on market 64 days — a 6% lower offer ($268k) is reasonable based on typical stale-listing flexibility.
Risks & watch-outs
- Climate carrying-cost: major wind risk, 27% chance of damaging wind over 30y; major wildfire risk; extreme-heat days projected 7→21/yr by 2055 (HVAC capex compounding) — expect insurance premiums to compound above CPI over the hold.
Questions for the listing agent
- What do current leases actually rent for vs. the listed asking? Can we see a recent rent roll and the last 12 months of T-12 income?
- It's been on market 64 days. Have you received any prior offers? Is the seller open to a 19% concession, seller financing, or rate buy-down credit?
- Why hasn't it sold? Are there any deal-killer items the seller is aware of (foundation, flood, title, zoning, code violations)?
- Is there a deadline driving the sale (1031 exchange, divorce, estate, relocation)? That informs how much negotiation room exists.
- Schools are D-rated, which usually means shorter tenancies and higher turnover. Who's the typical renter profile here, and what's been the actual vacancy rate?
- The area grade is low — what's the realistic commute time and amenity access for the typical tenant pool here? Any planned neighborhood developments (good or bad) we should know about?
- What's the average days-on-market for RENTAL listings here right now (not sales)? A rising rental-DOM trend means longer vacancies and softer asking-rent achievability than the comps imply.
- What's the recent tenant-quality profile in this submarket — average credit score on applications, eviction rate, late-payment / NSF rate, and stable-employment percentage? A property-management company in the area should have these aggregated.
- How much new for-sale + rental construction is in the pipeline within 1–3 miles? Heavy new supply typically softens prices + rents 12–24 months out; constrained supply supports both.
Investment metrics
- 1% rule
- 0.81% ✗
- Cap rate
- 5.72%
- Cash-on-cash
- -2.04%
- DSCR
- 0.91
- GRM
- 10.3
CMA / ARV
No comps found within radius.
Projected returns pro-forma
-3.0% appreciation · 3.0% rent growth · sell at horizon
- IRR
- -19.7%
- Equity multiple
- 0.31×
- Total profit
- $-54,810
- Equity at exit
- $42,494
- IRR
- -12.5%
- Equity multiple
- 0.26×
- Total profit
- $-58,777
- Equity at exit
- $24,642
Cash invested: $79,800 (down + closing). Projections, not guarantees.
Landlord ↔ Tenant lean methodology
- Overall (STATE)
- 87 Strongly Landlord-Friendly
- State Texas
- 87 Strongly Landlord-Friendly · R+5
- County
- — inherits STATE
- City
- — inherits STATE
ZIP-level market 76082
- Home prices YoY
- -21.5%
- Active inventory
- 531
- Price-to-rent
- 10.3×
Monthly cashflow live
- Estimated rent
- $2,295 high interval (Pro) →
- Mortgage (P&I)
- −$1,495
- Tax from tax record
- −$335 /mo · $4,025/yr
- Insurance
- −$119
- HOA
- −$0
- Lot rent
- −$0
- Vacancy / Maint / Mgmt
- −$482
- Net cashflow
- $-136
Break-even live
Sensitivity live
| Price | -10% $26 | -5% $-55 | +0% $-136 | +5% $-216 | +10% $-297 |
|---|---|---|---|---|---|
| Rent | -10% $-317 | -5% $-226 | +0% $-136 | +5% $-45 | +10% $45 |
| Rate | -1.0pp $8 | -0.5pp $-63 | base $-136 | +0.5pp $-210 | +1.0pp $-285 |
UW: 25.0% down · 7.5% · 30yr · 1.5% tax · 5.0% vac · 8.0% maint · 8.0% mgmt
Financing live
Cash to close
- Down payment
- $71,250
- Closing costs
- $8,550
- Reserves months
- —
- Total cash needed
- —
Loan-product check · same deal, 3 products live
Conventional
25% down · 7.5% · 30yr
- Down + closing
- —
- Monthly P&I
- —
- Monthly cashflow
- —
- DSCR
- —
- Eligible?
- —
Personal DTI + credit; lowest rate.
DSCR
20% down · 8.5% · 30yr
- Down + closing
- —
- Monthly P&I
- —
- Monthly cashflow
- —
- DSCR
- —
- Eligible?
- —
No personal income docs; deal must DSCR.
Hard money
10% down · 12.0% · 12mo
- Down + closing
- —
- Monthly P&I
- —
- Monthly cashflow
- —
- DSCR
- —
- Eligible?
- —
Short-term bridge; refi at stabilization.
Rent comps 6 comps
| Address | Beds | Baths | Sqft | Rent | $/sqft | DOM | Units | Dist |
|---|---|---|---|---|---|---|---|---|
| 413 Jameson Springtown, TX | 3.0 | 2.0 | 1416 | $2,125 | $1.50 | 21d | 1 | 0.11mi |
| 217 N Spring Branch Trl Springtown, TX | 3.0 | 2.0 | 1300 | $2,100 | $1.62 | 15d | 1 | 0.66mi |
| 217 N Spring Branch Trl Springtown, TX | 3.0 | 2.0 | 1300 | $2,050 | $1.58 | 6d | 1 | 0.66mi |
| 821 E Highway 199 Springtown, TX | 3.0 | 2.0 | 2205 | $2,600 | $1.18 | 46d | 1 | 0.83mi |
| 912 Avagail Ave Springtown, TX | 3.0 | 2.0 | 1665 | $2,195 | $1.32 | 19d | 1 | 0.87mi |
| 215 North Avenue A Unit A Springtown, TX | 4.0 | 1.0 | 2276 | $1,925 | $0.85 | 46d | 1 | 1.42mi |
Listing history 18 events
-
2026-06-22days on market $285,000 Active 64 DOM
-
2026-06-21days on market $285,000 Active 63 DOM
-
2026-06-18days on market $285,000 Active 60 DOM
-
2026-06-17pricedays on market $285,000 Active 59 DOM
-
2026-06-16days on market $289,000 Active 58 DOM
-
2026-06-15days on market $289,000 Active 57 DOM
-
2026-06-13days on market $289,000 Active 55 DOM
-
2026-06-13days on market $289,000 Active 54 DOM
-
2026-06-09days on market $289,000 Active 51 DOM
-
2026-06-08days on market $289,000 Active 50 DOM
-
2026-06-07days on market $289,000 Active 49 DOM
-
2026-06-04days on market $289,000 Active 46 DOM
-
2026-06-03days on market $289,000 Active 45 DOM
-
2026-06-02days on market $289,000 Active 44 DOM
-
2026-06-01days on market $289,000 Active 43 DOM
-
2026-05-31days on market $289,000 Active 42 DOM
-
2026-05-18price $289,000 657-char remark
-
2026-04-19$295,000 Active 657-char remark
ⓘ Source: listings_history table (triggers on properties + properties_extension) + one-shot
backfill from property_details.listing_events for pre-trigger history.
Tax reassessment forecast TX · Resets to sale price
- Current annual tax
- $4,025 · $335/mo
- Projected year-2 tax
- $5,216 · $435/mo
- Expected delta
- +$1,190/yr (+$99/mo · 29.6%)
ⓘ Screening estimate from a state-policy table — verify with the county assessor before closing.
Climate risk First Street
- Flood 1/10 Low FEMA zone X (unshaded) · 0% chance over 30 yrs
- Wildfire 7/10 Severe
- Heat 7/10 Severe 7 d/yr ≥109°F today · 21 d/yr by 30 yrs out
- Wind 6/10 Major 27% chance of damaging wind over 30 yrs
- Air quality 3/10 Moderate 2 unhealthy d/yr today · 3 by 30 yrs out
Nearby sold comps map
Loading sold comps map…
Walkable amenities ~0.75 mi
Loading nearby amenities…
Taxation est. · year 1
- Rental income
- $27,538
- − Mortgage interest
- −$15,964
- − Property taxes
- −$4,025
- − Insurance
- −$1,425
- − Repairs & maintenance
- −$2,203
- − Management
- −$2,203
- − Depreciation
- −$8,291
- Taxable loss
- −$6,573
- Est. tax savings @ 24.0%
- +$1,578
- After-tax cash flow
- $-52/yr
For passive investors: Depreciation is non-cash, so a rental often shows a tax loss while cash-flowing — sheltering income. Rental losses are passive: they offset passive income freely, and up to $25,000/yr can offset ordinary (W-2) income if you actively participate and your MAGI is under $100k (phasing out to $0 by $150k); unused losses carry forward. On sale, claimed depreciation is recaptured at up to 25%, and gains may owe capital-gains tax (a 1031 exchange can defer both). Figures are a year-1 estimate at your 24.0% rate — not tax advice; consult a CPA.
Schools (NCES district)
- District
- Springtown ISD
- NCES district ID
- 4841280
- Math proficiency
- 36% ▼ -14.00%
- Reading proficiency
- 40% ▼ -2.00%
- Median HH income
- $56,136
- Composite
- 33.41/100
- National rank
- #5474
- State rank
- #435 of 826 in TX
Livability — Springtown
- Score
- 68/100
- State rank
- #461
- US rank
- #9298
Category grades
Schools grade is shown separately in the Schools card above.
Census & demographics
- County
- Parker County · 144,797 people
- City population
- 24,880
- Metro
- Dallas-Fort Worth-Arlington, TX
- Population (ZIP)
- 24,880
- Household income
- $92,485
- Rent vs Own
- Severe rent burden
- 333.0
Population outlook (Parker County) Hauer SSP2
- Today (2025)
- 147,426 people
- By 2030
- 157,863 · +7.1%
- By 2040
- 177,519 · +20.4%
- By 2050
- 194,786 · +32.1%
- By 2075
- 238,799 · +62.0%
- By 2100
- 264,126 · +79.2%
Race, ethnicity, and origin ACS 2023
- Neighborhood character
- Predominantly White (80%)
- Race & ethnicity
- White 80% Hispanic / Latino 13% Two or more races 11%
- Hispanic origin (detail)
- Mexican 12%
- Common ancestry
- Slovak 3% Lithuanian 2% Italian 2%
- Foreign-born
- 4% · Canada
- Languages at home
- 93% English-only · Spanish 6%
Political lean MEDSL · Parker
- 2024 margin
- Solid R (+66.4) · D 16.4% · R 82.8%
- 2008→2024 swing
- -11.2pp toward R · 2008: -55.2pp · 2024: -66.4pp
- All cycles
- 2024: R+66.4 2020: R+64.4 2016: R+67.5 2012: R+65.8 2008: R+55.2
Not yet ingested
- Civics
- —
Market trends
- HPI YoY
- ▼ -71.65%
- Current HPI
- 262.1991
- Rent YoY
- —
- Metro
- Dallas-Fort Worth-Arlington, TX
- State GDP YoY
- ▲ 3.95%
- F500 in state
- 110
Industry mix (Fortune 500 HQ in TX)
| Industry | F500 HQs | Revenue |
|---|---|---|
| Energy | 16 | $1,198B |
|
||
| Technology | 5 | $198B |
|
||
| Engineering / Construction | 4 | $72B |
|
||
| Energy Services | 3 | $60B |
|
||
| Utilities | 3 | $41B |
|
||
| Healthcare | 2 | $330B |
|
||
Price history
-3.4% since first listed3 events — show timeline
- 2026-06-17 Price Changed $285,000 NTREIS
- 2026-05-18 Price Changed $289,000 NTREIS
- 2026-04-19 Listed $295,000 NTREIS
Property tax history
+139.4%/yrLatest (2025): $4,025 · +1.0% YoY. Source: county tax records.
Cash-flow waterfall
monthlySold comps — $/sqft
last 12 mo · ≤1 miLoading sold comps…