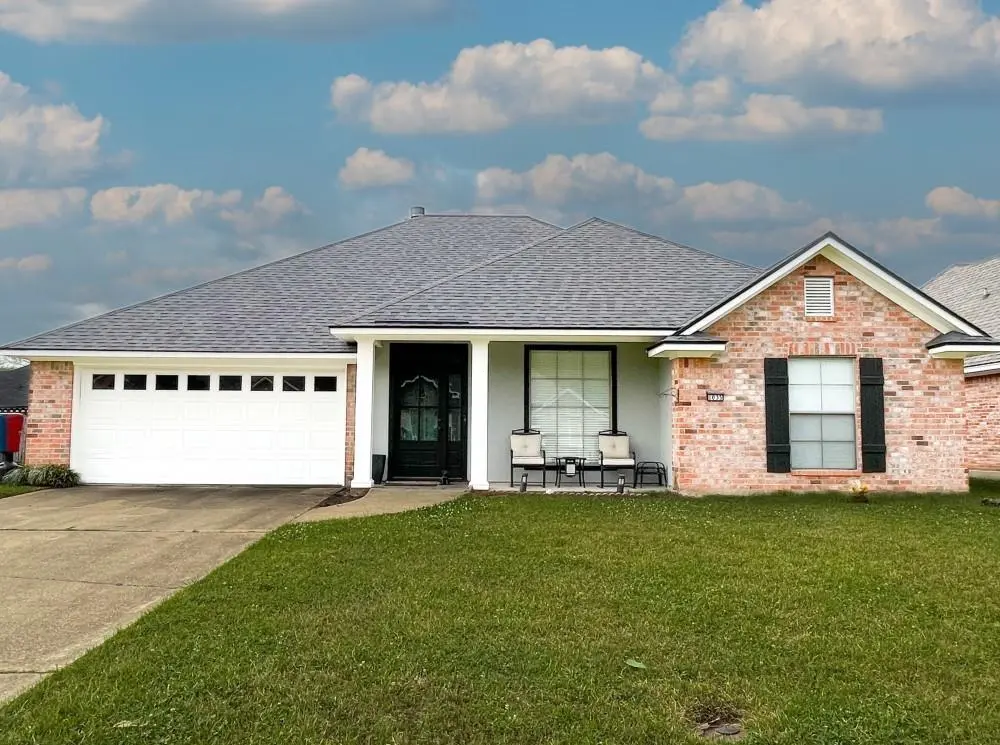
1035 Cressmont St · Bossier City, LA
Flood risk 1/10 · Minimal
- FEMA flood zone
- X (unshaded)
- Chance of flooding over 30 yrs
- 0.0%
- Est. flood insurance / yr
- $507 – $1,088
Fire risk 1/10 · Minimal
- Est. fire insurance / yr
- $1,269 – $2,357
Heat risk 7/10 · Major
- Hot days now (above 110°F)
- 7 days/yr
- Hot days in 30 yrs
- 23 days/yr
Wind risk 6/10 · Moderate
- Chance of severe wind over 30 yrs
- 58.0%
Air-quality risk 2/10 · Minimal
- Unhealthy air days now
- 1 days/yr
- Unhealthy air days in 30 yrs
- 1 days/yr
Risk factors via First Street. Map © Google.
Why this score? — see what drove the D+ grade
The composite is a weighted blend of 9 inputs, each scored 0–100. Each bar is that input's sub-score; the figure is the points it added to the 100-point composite (weight × sub-score).
- ARV discount +14.8/15.0
- Cash flow +13.3/30.0
- Rent growth +4.1/5.0
- DSCR +4.0/10.0
- Schools +3.8/10.0
- Livability +3.6/5.0
- 1% rule +2.8/10.0
- Condition / age +2.5/5.0
- Appreciation +0.0/10.0
$269,000
🖨 Deal sheet (PDF) 📄 Offer letter ✓ Due diligence
Listing remarks MLS
Welcome to your beautiful 4-bedroom, 2-bathroom home privately nestled in Stockwell Place. This home offers a fresh coat of paint inside and out, a spacious backyard perfect for entertaining and relaxing. Inside has an appealing open-concept floor plan that enhances family bonding and guest entertainment. The kitchen has plenty of cabinet space, an island and a water softener unit attached to the home! The remote master suite is a true retreat, offering a large bedroom, a private en-suite bathroom with his & her closets, a walk-in shower plus a garden tub great for soaking. The additional three bedrooms are perfect for family, guests, or a home office setup. The spacious utility room leads into the two-car garage with additional storage area.
Key facts
- Spacious backyard
- Remote master suite
- Water softener unit
Tags
Neighborhood map
What this means for you Summary
Snapshot
- This is a 4-bed/2.0-bath single-family listed at $269k.
Deal economics
- At list price, monthly cash flow is $-2 ($-25/yr) — negative.
- To cash-flow at today's rent, offer at most $269k (0.1% below list).
- To meet the 1% rule (rent ≥ 1% of price), the offer needs to be $210k (22.1% below list).
- Recommended offer: $210k (22.1% below list) — sets the bar for 1% rule.
- Cap rate 6.3% vs local median 4.7% in Bossier City — top-decile yield for the area; either an underpriced asset or a hidden risk that comps aren't pricing in. Stress-test before assuming the spread holds.
Location & tenants
- Location reads 71/100 on livability (#47 in LA) — a middle-class / working-renter tenant base. Strengths: commute A+, cost of living A+, housing A+; Watch: employment D+, crime F, amenities F.
- Bossier Parish (urban): math 40% / reading 47% proficiency, ranked #17 of 98 in LA (top 17%) — families likely to look elsewhere, expect single-tenant / working-renter base with shorter leases.
- Market conditions: Rents rising fast (+6.6%/yr); 421 active listings in the ZIP; 6 comparable units currently listed for rent nearby; rentals at typical pace (median 22d on market — plan ~3-4 weeks tenant-placement turnaround); 716 units permitted in Bossier Parish in 2024 (0 in 5+ unit buildings).
- This rent runs 39% of the median local income ($65k/yr) — at the standard rent-burdened threshold; future hikes will face affordability resistance.
Forward outlook
- Local home prices are declining (-3.0%/yr); year-one equity from $2k of loan paydown is wiped out by about $8k of value loss. Plan a longer hold.
- Bossier County population projected at +28% by 2050 — long-run rental-demand tailwind backs the buy-and-hold thesis.
Negotiation context
- It's been on market 65 days — a 6% lower offer ($253k) is reasonable based on typical stale-listing flexibility.
- Current owner paid $215k; 25% above their basis — modest negotiation headroom, anchor on the comps not their cost.
Risks & watch-outs
- Climate carrying-cost: major wind risk, 58% chance of damaging wind over 30y; extreme-heat days projected 7→23/yr by 2055 (HVAC capex compounding) — expect insurance premiums to compound above CPI over the hold.
Questions for the listing agent
- What do current leases actually rent for vs. the listed asking? Can we see a recent rent roll and the last 12 months of T-12 income?
- It's been on market 65 days. Have you received any prior offers? Is the seller open to a 22% concession, seller financing, or rate buy-down credit?
- Why hasn't it sold? Are there any deal-killer items the seller is aware of (foundation, flood, title, zoning, code violations)?
- Is there a deadline driving the sale (1031 exchange, divorce, estate, relocation)? That informs how much negotiation room exists.
- Schools are B-rated — typically a magnet for longer-tenancy family renters. What's the average tenant stay here, and is there a school-zone premium baked into asking?
- Crime grade is F in this area — have there been break-ins, vandalism, or insurance claims at this property in the last 3 years? What carrier currently insures it and at what premium?
- The area grade is low — what's the realistic commute time and amenity access for the typical tenant pool here? Any planned neighborhood developments (good or bad) we should know about?
- What's the average days-on-market for RENTAL listings here right now (not sales)? A rising rental-DOM trend means longer vacancies and softer asking-rent achievability than the comps imply.
- What's the recent tenant-quality profile in this submarket — average credit score on applications, eviction rate, late-payment / NSF rate, and stable-employment percentage? A property-management company in the area should have these aggregated.
- How much new for-sale + rental construction is in the pipeline within 1–3 miles? Heavy new supply typically softens prices + rents 12–24 months out; constrained supply supports both.
Investment metrics
- 1% rule
- 0.78% ✗
- Cap rate
- 6.28%
- Cash-on-cash
- -0.03%
- DSCR
- 1.00
- GRM
- 10.7
CMA / ARV
- ARV (median comp)
- $321,245
- List price
- $269,000
- Delta
- -16.26%
- Verdict
- UNDERPRICED
- Comps
- 20 within 1.0 mi
Show comp detail 12 sales within ~0.75 mi
| Address | Dist | Beds/Ba | Sqft | Sold | Price | $/sf | Match |
|---|---|---|---|---|---|---|---|
| 1045 Cressmont St | 0.03mi | 4/2.0 | 2,053 (+5%) | 23mo | $295,000 | $144 | 70 |
| 2508 Cole Cir | 0.22mi | 3/2.0 (-1) | 1,741 (-11%) | 5mo | $266,900 | $153 | 63 |
| 6019 Whitney Dr | 0.17mi | 4/2.0 | 1,809 (-7%) | 23mo | $250,000 | $138 | 61 |
| 8113 Dogwood Trl | 0.67mi | 3/2.0 (-1) | 1,900 (-2%) | 1mo | $259,900 | $137 | 58 |
| 2529 Brookhaven Dr | 0.24mi | 3/2.0 (-1) | 1,732 (-11%) | 16mo | $269,900 | $156 | 52 |
| 3320 Trailview Cir | 0.56mi | 4/2.0 | 1,846 (-5%) | 18mo | $259,900 | $141 | 50 |
| 2412 Stockwell Rd | 0.54mi | 4/3.0 | 2,140 (+10%) | 9mo | $249,898 | $117 | 47 |
| 7903 Cedar Creek Cir | 0.64mi | 3/2.0 (-1) | 2,064 (+6%) | 12mo | $269,900 | $131 | 46 |
| 2409 Stockwell Rd | 0.55mi | 3/2.0 (-1) | 1,667 (-14%) | 1mo | $165,000 | $99 | 44 |
| 2507 Abbey Ct | 0.51mi | 3/3.0 (-1) | 2,059 (+6%) | 23mo | $397,000 | $193 | 38 |
| 2305 Brookhaven Dr | 0.66mi | 3/2.0 (-1) | 1,735 (-11%) | 12mo | $260,000 | $150 | 37 |
| 2400 Brookhaven Dr | 0.60mi | 3/2.0 (-1) | 2,210 (+13%) | 10mo | $294,000 | $133 | 36 |
Match score weights: distance 35% · size 25% · config 20% · recency 20%. Top-matched comps best support the ARV.
Projected returns pro-forma
-3.0% appreciation · 6.56% rent growth · sell at horizon
- IRR
- -12.9%
- Equity multiple
- 0.52×
- Total profit
- $-36,035
- Equity at exit
- $40,109
- IRR
- 0.4%
- Equity multiple
- 1.03×
- Total profit
- $2,419
- Equity at exit
- $23,258
Cash invested: $75,320 (down + closing). Projections, not guarantees.
Landlord ↔ Tenant lean methodology
- Overall (STATE)
- 90 Strongly Landlord-Friendly
- State Louisiana
- 90 Strongly Landlord-Friendly · R+12
- County
- — inherits STATE
- City
- — inherits STATE
ZIP-level market 71111
- Home prices YoY
- -34.8%
- Rents YoY
- 6.6%
- Active inventory
- 421
- Price-to-rent
- 10.7×
Monthly cashflow live
- Estimated rent
- $2,096 high interval (Pro) →
- Mortgage (P&I)
- −$1,411
- Tax from tax record
- −$135 /mo · $1,624/yr
- Insurance
- −$112
- HOA
- −$0
- Vacancy / Maint / Mgmt
- −$440
- Net cashflow
- $-2
Break-even live
Sensitivity live
| Price | -10% $150 | -5% $74 | +0% $-2 | +5% $-78 | +10% $-154 |
|---|---|---|---|---|---|
| Rent | -10% $-168 | -5% $-85 | +0% $-2 | +5% $81 | +10% $164 |
| Rate | -1.0pp $133 | -0.5pp $66 | base $-2 | +0.5pp $-72 | +1.0pp $-143 |
UW: 25.0% down · 7.5% · 30yr · 1.5% tax · 5.0% vac · 8.0% maint · 8.0% mgmt
Financing live
Cash to close
- Down payment
- $67,250
- Closing costs
- $8,070
- Reserves months
- —
- Total cash needed
- —
Loan-product check · same deal, 3 products live
Conventional
25% down · 7.5% · 30yr
- Down + closing
- —
- Monthly P&I
- —
- Monthly cashflow
- —
- DSCR
- —
- Eligible?
- —
Personal DTI + credit; lowest rate.
DSCR
20% down · 8.5% · 30yr
- Down + closing
- —
- Monthly P&I
- —
- Monthly cashflow
- —
- DSCR
- —
- Eligible?
- —
No personal income docs; deal must DSCR.
Hard money
10% down · 12.0% · 12mo
- Down + closing
- —
- Monthly P&I
- —
- Monthly cashflow
- —
- DSCR
- —
- Eligible?
- —
Short-term bridge; refi at stabilization.
Rent comps 6 comps
| Address | Beds | Baths | Sqft | Rent | $/sqft | DOM | Units | Dist |
|---|---|---|---|---|---|---|---|---|
| 6021 Whitney Dr Bossier City, LA | 4.0 | 2.0 | 1780 | $2,100 | $1.18 | 44d | 1 | 0.18mi |
| 2523 Brookhaven Dr Bossier City, LA | 3.0 | 2.0 | 1800 | $1,950 | $1.08 | 22d | 1 | 0.28mi |
| 6011 Jason St Bossier City, LA | 3.0 | 2.0 | 1887 | $2,000 | $1.06 | 14d | 1 | 0.30mi |
| 8052 Fernwood Cir Haughton, LA | 3.0 | 2.0 | 2005 | $1,850 | $0.92 | 14d | 1 | 0.54mi |
| 8509 Woodhill Ln Haughton, LA | 3.0 | 2.0 | 1451 | $1,650 | $1.14 | 44d | 1 | 1.05mi |
| 2201 Hickory Ridge Dr Bossier City, LA | 4.0 | 2.0 | 1900 | $1,950 | $1.03 | 22d | 1 | 1.11mi |
Listing history 13 events
-
2026-06-09status $269,000 Pending 65 DOM
-
2026-06-08days on market $269,000 Active 65 DOM
-
2026-06-07days on market $269,000 Active 64 DOM
-
2026-06-02days on market $269,000 Active 59 DOM
-
2026-06-01days on market $269,000 Active 58 DOM
-
2026-05-31days on market $269,000 Active 57 DOM
-
2026-05-30days on market $269,000 Active 56 DOM
-
2026-05-07price $269,000 756-char remark
Show marketing remark (756 chars)
Welcome to your beautiful 4-bedroom, 2-bathroom home privately nestled in Stockwell Place. This home offers a fresh coat of paint inside and out, a spacious backyard perfect for entertaining and relaxing. Inside has an appealing open-concept floor plan that enhances family bonding and guest entertainment. The kitchen has plenty of cabinet space, an island and a water softener unit attached to the home! The remote master suite is a true retreat, offering a large bedroom, a private en-suite bathroom with his & her closets, a walk-in shower plus a garden tub great for soaking. The additional three bedrooms are perfect for family, guests, or a home office setup. The spacious utility room leads into the two-car garage with additional storage area.
-
2026-04-15price $273,000 756-char remark
Show marketing remark (756 chars)
Welcome to your beautiful 4-bedroom, 2-bathroom home privately nestled in Stockwell Place. This home offers a fresh coat of paint inside and out, a spacious backyard perfect for entertaining and relaxing. Inside has an appealing open-concept floor plan that enhances family bonding and guest entertainment. The kitchen has plenty of cabinet space, an island and a water softener unit attached to the home! The remote master suite is a true retreat, offering a large bedroom, a private en-suite bathroom with his & her closets, a walk-in shower plus a garden tub great for soaking. The additional three bedrooms are perfect for family, guests, or a home office setup. The spacious utility room leads into the two-car garage with additional storage area.
-
2026-04-01$278,000 Active 756-char remark
Show marketing remark (756 chars)
Welcome to your beautiful 4-bedroom, 2-bathroom home privately nestled in Stockwell Place. This home offers a fresh coat of paint inside and out, a spacious backyard perfect for entertaining and relaxing. Inside has an appealing open-concept floor plan that enhances family bonding and guest entertainment. The kitchen has plenty of cabinet space, an island and a water softener unit attached to the home! The remote master suite is a true retreat, offering a large bedroom, a private en-suite bathroom with his & her closets, a walk-in shower plus a garden tub great for soaking. The additional three bedrooms are perfect for family, guests, or a home office setup. The spacious utility room leads into the two-car garage with additional storage area.
-
2015-10-09soldstatus $215,100
-
2007-06-26soldstatus $214,987
-
2004-05-06soldstatus $857,800
ⓘ Source: listings_history table (triggers on properties + properties_extension) + one-shot
backfill from property_details.listing_events for pre-trigger history.
Tax reassessment forecast LA · Resets to sale price
- Current annual tax
- $1,624 · $135/mo
- Projected year-2 tax
- $1,624 · $135/mo
- Expected delta
- $0/yr ($0/mo · 0.0%)
ⓘ Screening estimate from a state-policy table — verify with the county assessor before closing.
Climate risk First Street
- Flood 1/10 Low FEMA zone X (unshaded) · 0% chance over 30 yrs
- Wildfire 1/10 Low
- Heat 7/10 Severe 7 d/yr ≥110°F today · 23 d/yr by 30 yrs out
- Wind 6/10 Major 58% chance of damaging wind over 30 yrs
- Air quality 2/10 Low 1 unhealthy d/yr today · 1 by 30 yrs out
Nearby sold comps map
Loading sold comps map…
Walkable amenities ~0.75 mi
Loading nearby amenities…
Taxation est. · year 1
- Rental income
- $25,155
- − Mortgage interest
- −$15,068
- − Property taxes
- −$1,624
- − Insurance
- −$1,345
- − Repairs & maintenance
- −$2,012
- − Management
- −$2,012
- − Depreciation
- −$7,825
- Taxable loss
- −$4,732
- Est. tax savings @ 24.0%
- +$1,136
- After-tax cash flow
- $1,111/yr
For passive investors: Depreciation is non-cash, so a rental often shows a tax loss while cash-flowing — sheltering income. Rental losses are passive: they offset passive income freely, and up to $25,000/yr can offset ordinary (W-2) income if you actively participate and your MAGI is under $100k (phasing out to $0 by $150k); unused losses carry forward. On sale, claimed depreciation is recaptured at up to 25%, and gains may owe capital-gains tax (a 1031 exchange can defer both). Figures are a year-1 estimate at your 24.0% rate — not tax advice; consult a CPA.
Schools (NCES district)
- District
- Bossier Parish
- NCES district ID
- 2200270
- Math proficiency
- 40% ▼ -32.00%
- Reading proficiency
- 47% ▼ -28.00%
- Median HH income
- $51,326
- Composite
- 37.5/100
- National rank
- #4402
- State rank
- #17 of 98 in LA
Livability — Bossier City
- Score
- 71/100
- State rank
- #47
- US rank
- #7044
Category grades
Schools grade is shown separately in the Schools card above.
Census & demographics
- Census place
- Bossier City, LA
- County
- Bossier Parish · 98,704 people
- City population
- 91,925
- Metro
- Shreveport-Bossier City, LA
- Population (ZIP)
- 43,925
- Household income
- $65,292
- Rent vs Own
- Severe rent burden
- 1942.0
Population outlook (Bossier County) Hauer SSP2
- Today (2025)
- 143,247 people
- By 2030
- 151,802 · +6.0%
- By 2040
- 168,194 · +17.4%
- By 2050
- 183,533 · +28.1%
- By 2075
- 217,009 · +51.5%
- By 2100
- 230,091 · +60.6%
Race, ethnicity, and origin ACS 2023
- Neighborhood character
- Diverse neighborhood (Simpson 0.60)
- Race & ethnicity
- White 56% Black 29% Hispanic / Latino 9% Two or more races 8% Asian 3%
- Hispanic origin (detail)
- Mexican 5%
- Common ancestry
- Lithuanian 2% Iranian 1% Slovak 1%
- Foreign-born
- 5% · Canada, Vietnam
- Languages at home
- 90% English-only · Spanish 7% Vietnamese 1% French/Haitian/Cajun 1%
Political lean MEDSL · Bossier
- 2024 margin
- Solid R (+43.3) · D 27.7% · R 71.0% · Other 1.3%
- 2008→2024 swing
- +0.3pp no change · 2008: -43.7pp · 2024: -43.3pp
- All cycles
- 2024: R+43.3 2020: R+41.0 2016: R+45.8 2012: R+45.4 2008: R+43.7
Not yet ingested
- Civics
- —
Market trends
- HPI YoY
- ▼ -79.78%
- Current HPI
- 149.4336
- Rent YoY
- ▲ 6.56%
- Metro
- Shreveport-Bossier City, LA
- State GDP YoY
- ▲ 3.29%
- F500 in state
- 10
Industry mix (Fortune 500 HQ in LA)
| Industry | F500 HQs | Revenue |
|---|---|---|
| Telecommunications | 2 | $23B |
|
||
| Utilities | 1 | $12B |
|
||
| Wholesale / Distribution | 1 | $5B |
|
||
| Advertising | 1 | $2B |
|
||
Price history
-68.6% since first listed6 events — show timeline
- 2026-05-07 Price Changed $269,000 NTREIS
- 2026-04-15 Price Changed $273,000 NTREIS
- 2026-04-01 Listed $278,000 NTREIS
- 2015-10-09 Sold (Public Records) $215,100 Public Records
- 2007-06-26 Sold (Public Records) $214,987 Public Records
- 2004-05-06 Sold (Public Records) $857,800 Public Records
Property tax history
-3.8%/yrLatest (2025): $1,624 · -1.3% YoY. Source: county tax records.
Cash-flow waterfall
monthlySold comps — $/sqft
last 12 mo · ≤1 miLoading sold comps…