 Multi-family
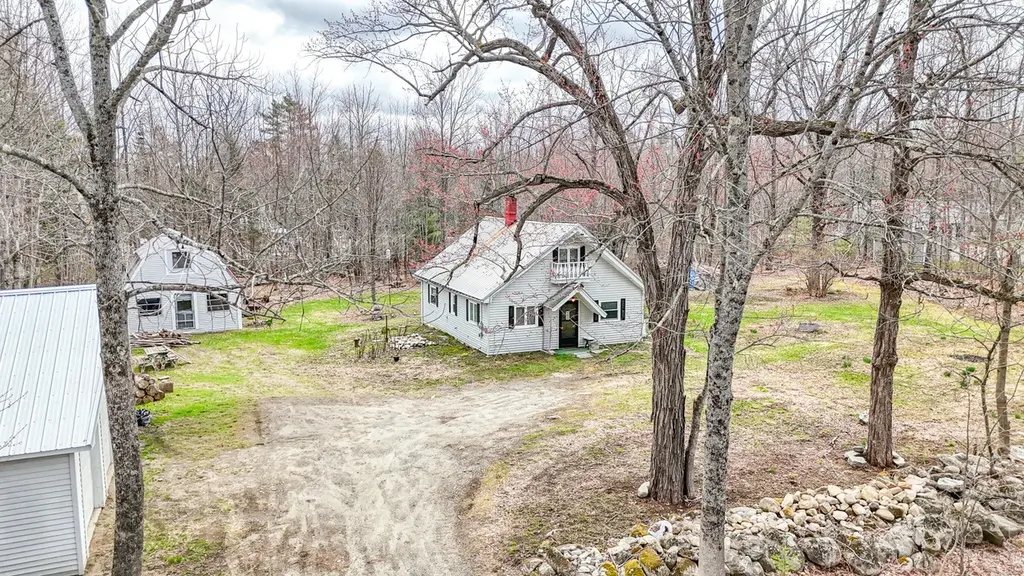
751 West Rd · Augusta, ME
Flood risk No data
- FEMA flood zone
- —
- Chance of flooding over 30 yrs
- —
- Est. flood insurance / yr
- —
Fire risk No data
- Est. fire insurance / yr
- —
Heat risk No data
- Hot days now (above threshold)
- —
- Hot days in 30 yrs
- —
Wind risk No data
- Chance of severe wind over 30 yrs
- —
Air-quality risk No data
- Unhealthy air days now
- —
- Unhealthy air days in 30 yrs
- —
Risk factors via First Street. Map © Google.
Why this score? — see what drove the B- grade
The composite is a weighted blend of 9 inputs, each scored 0–100. Each bar is that input's sub-score; the figure is the points it added to the 100-point composite (weight × sub-score).
- Cash flow +21.4/30.0
- Appreciation +10.0/10.0
- ARV discount +7.5/15.0
- Schools +7.5/10.0
- DSCR +6.8/10.0
- 1% rule +4.9/10.0
- Livability +4.0/5.0
- Rent growth +2.5/5.0
- Condition / age +2.5/5.0
$280,000
🖨 Deal sheet 📄 Offer letter ✓ Due diligence
Multi-family units
County records classify this as Multi-Family (2-4 Unit). Listing-text estimate: 1 unit. estimate disagrees with records
Key facts
- 1.5 acre lot
- 2 garage spots
- Built 1981
Property features AI
Exterior
- Parking: Detached 2-car garage; Additional on-site gravel parking for 5–10 vehicles; Carport
- Utilities: Electric service with circuit breakers; Private well water; Private sewer (holding tank); Electric water heater
- Home design: Single family residence; Built in 1981; Rural zoning
- Construction: Wood frame with vinyl siding; Metal roof; Built in 1981
- Exterior features: Near a golf course; Near town; Paved road access
Interior
- Bedrooms: Bedroom 1 on the first floor; Bedroom 2 on the first floor
- Flooring: Laminate flooring
- Bathrooms: One full bathroom
- Heating & cooling: Direct vent heater; Wood stove
- Interior features: Unfurnished; Three total rooms; One fireplace
Neighborhood map
What this means for you Summary
Snapshot
- This is a 2-bed/1.0-bath multifamily listed at $280k.
Deal economics
- At list price, monthly cash flow is $416 ($5k/yr) — positive.
- The deal already cash-flows at list — no discount required.
- To meet the 1% rule (rent ≥ 1% of price), the offer needs to be $278k (0.8% below list).
- Recommended offer: $272k (3.0% below list) — sets the bar for market timing.
- Cap rate 8.1% vs local median 2.6% in Augusta — top-decile yield for the area; either an underpriced asset or a hidden risk that comps aren't pricing in. Stress-test before assuming the spread holds.
Location & tenants
- Location reads 81/100 on livability (#15 in ME, #1,476 nationally) — a professional / high-income tenant draw. Strengths: commute A+, cost of living A+, health & safety A+; Watch: schools D+, crime D-, employment F.
- RSU 18 (rural): math 88% / reading 89% proficiency, ranked #36 of 112 in ME (top 32%) — strong family-tenant draw, lease renewals of 3-5y typical.
- Market conditions: 43 active listings in the ZIP; 460 units permitted in Kennebec County in 2024 (0 in 5+ unit buildings).
Forward outlook
- In year one you build about $30k of equity ($2k loan paydown + $28k appreciation (10.0% local appreciation)).
- Kennebec County population projected at -17% by 2050 — secular population decline; favor cash flow + early exit over multi-decade hold.
- At projected returns (10.0% appreciation + 3.0% rent growth), your $78k cash investment doubles in ~3 years — after that, you're playing with house money.
- By year 2, paydown + projected appreciation supports a ~$48k cash-out refi (75% LTV) — recoverable capital for the next deal without selling this one.
Negotiation context
- It's been on market 50 days — a 3% lower offer ($272k) is reasonable based on typical stale-listing flexibility.
- 3 sale attempts with the ask held roughly flat each time — persistent listings suggest the price (not the market) is what's stuck; bring a comps-based counter.
Questions for the listing agent
- It's been on market 50 days. Have you received any prior offers? Is the seller open to a 3% concession, seller financing, or rate buy-down credit?
- Is there a deadline driving the sale (1031 exchange, divorce, estate, relocation)? That informs how much negotiation room exists.
- Schools are D-rated, which usually means shorter tenancies and higher turnover. Who's the typical renter profile here, and what's been the actual vacancy rate?
- Crime grade is D in this area — have there been break-ins, vandalism, or insurance claims at this property in the last 3 years? What carrier currently insures it and at what premium?
- What's the average days-on-market for RENTAL listings here right now (not sales)? A rising rental-DOM trend means longer vacancies and softer asking-rent achievability than the comps imply.
- What's the recent tenant-quality profile in this submarket — average credit score on applications, eviction rate, late-payment / NSF rate, and stable-employment percentage? A property-management company in the area should have these aggregated.
- How much new apartment / multifamily construction is in the pipeline within 1–3 miles? Heavy new supply (>2% of stock underway) typically softens rents 12–24 months out; light construction supports rent growth.
Investment metrics
- 1% rule
- 0.99% ✗
- Cap rate
- 8.07%
- Cash-on-cash
- 6.36%
- DSCR
- 1.28
- GRM
- 8.4
CMA / ARV
No comps found within radius.
Projected returns pro-forma
10.0% appreciation · 3.0% rent growth · sell at horizon
- IRR
- 28.9%
- Equity multiple
- 3.28×
- Total profit
- $178,920
- Equity at exit
- $252,246
- IRR
- 25.1%
- Equity multiple
- 7.45×
- Total profit
- $505,961
- Equity at exit
- $543,978
Cash invested: $78,400 (down + closing). Projections, not guarantees.
Landlord ↔ Tenant lean methodology
- Overall (STATE)
- 41 Moderately Tenant-Leaning
- State Maine
- 41 Moderately Tenant-Leaning · D+2
- County
- — inherits STATE
- City
- — inherits STATE
ZIP-level market 04917
- Home prices YoY
- 23.1%
- Active inventory
- 43
- Price-to-rent
- 16.8×
Monthly cashflow live
- Estimated rent
- $2,779 medium interval (Pro) →
- Mortgage (P&I)
- −$1,468
- Tax from tax record
- −$195 /mo · $2,336/yr
- Insurance
- −$117
- HOA
- −$0
- Vacancy / Maint / Mgmt
- −$584
- Net cashflow
- $416
Break-even live
2-unit breakdown (identical units grouped — click to expand)
| Units | Beds | Baths | Est. rent |
|---|---|---|---|
| 2× units | 2 | 1 | $2,778 |
| #1 | 2 | 1 | $1,389 |
| #2 | 2 | 1 | $1,389 |
| Total (2 units) | $2,779 | ||
UW: 25.0% down · 7.5% · 30yr · 1.5% tax · 5.0% vac · 8.0% maint · 8.0% mgmt
Financing live
Cash to close
- Down payment
- $70,000
- Closing costs
- $8,400
- Reserves months
- —
- Total cash needed
- —
Loan-product check · same deal, 3 products live
Conventional
25% down · 7.5% · 30yr
- Down + closing
- —
- Monthly P&I
- —
- Monthly cashflow
- —
- DSCR
- —
- Eligible?
- —
Personal DTI + credit; lowest rate.
DSCR
20% down · 8.5% · 30yr
- Down + closing
- —
- Monthly P&I
- —
- Monthly cashflow
- —
- DSCR
- —
- Eligible?
- —
No personal income docs; deal must DSCR.
Hard money
10% down · 12.0% · 12mo
- Down + closing
- —
- Monthly P&I
- —
- Monthly cashflow
- —
- DSCR
- —
- Eligible?
- —
Short-term bridge; refi at stabilization.
Listing history 21 events
-
2026-06-19days on market $280,000 Active 50 DOM
-
2026-06-18days on market $280,000 Active 49 DOM
-
2026-06-17days on market $280,000 Active 48 DOM
-
2026-06-16days on market $280,000 Active 47 DOM
-
2026-06-15days on market $280,000 Active 46 DOM
-
2026-06-14days on market $280,000 Active 44 DOM
-
2026-06-12days on market $280,000 Active 43 DOM
-
2026-06-09days on market $280,000 Active 40 DOM
-
2026-06-08days on market $280,000 Active 39 DOM
-
2026-06-07days on market $280,000 Active 38 DOM
-
2026-06-05days on market $280,000 Active 35 DOM
-
2026-06-03days on market $280,000 Active 34 DOM
-
2026-06-02days on market $280,000 Active 33 DOM
-
2026-06-01days on market $280,000 Active 32 DOM
-
2026-05-31days on market $280,000 Active 31 DOM
-
2026-05-30days on market $280,000 Active 30 DOM
-
2026-05-15status Active
-
2026-05-14historical Active Under Contract
-
2026-05-13status Active
-
2026-05-03historical Active Under Contract
-
2026-04-30$280,000 Active
ⓘ Source: listings_history table (triggers on properties + properties_extension) + one-shot
backfill from property_details.listing_events for pre-trigger history.
Tax reassessment forecast ME · Partial reset (capped growth)
- Current annual tax
- $2,336 · $195/mo
- Projected year-2 tax
- $3,072 · $256/mo
- Expected delta
- +$736/yr (+$61/mo · 31.5%)
ⓘ Screening estimate from a state-policy table — verify with the county assessor before closing.
Nearby sold comps map
Loading sold comps map…
Walkable amenities ~0.75 mi
Loading nearby amenities…
Taxation est. · year 1
- Rental income
- $33,348
- − Mortgage interest
- −$15,684
- − Property taxes
- −$2,336
- − Insurance
- −$1,400
- − Repairs & maintenance
- −$2,668
- − Management
- −$2,668
- − Depreciation
- −$8,145
- Taxable income
- $447
- Est. tax owed @ 24.0%
- −$107
- After-tax cash flow
- $4,882/yr
For passive investors: Depreciation is non-cash, so a rental often shows a tax loss while cash-flowing — sheltering income. Rental losses are passive: they offset passive income freely, and up to $25,000/yr can offset ordinary (W-2) income if you actively participate and your MAGI is under $100k (phasing out to $0 by $150k); unused losses carry forward. On sale, claimed depreciation is recaptured at up to 25%, and gains may owe capital-gains tax (a 1031 exchange can defer both). Figures are a year-1 estimate at your 24.0% rate — not tax advice; consult a CPA.
Schools (NCES district)
- District
- RSU 18
- NCES district ID
- 2314779
- Math proficiency
- 88% ▲ 53.00%
- Reading proficiency
- 89% ▲ 32.00%
- Median HH income
- $55,125
- Composite
- 75.2/100
- National rank
- #139
- State rank
- #36 of 112 in ME
Livability — Augusta
- Score
- 81/100
- State rank
- #15
- US rank
- #1476
Category grades
Schools grade is shown separately in the Schools card above.
Census & demographics
- City population
- 26,690
- Population (ZIP)
- 3,298
Population outlook (Kennebec County) Hauer SSP2
- Today (2025)
- 115,421 people
- By 2030
- 111,852 · -3.1%
- By 2040
- 103,757 · -10.1%
- By 2050
- 95,710 · -17.1%
- By 2075
- 78,172 · -32.3%
- By 2100
- 59,500 · -48.4%
Race, ethnicity, and origin ACS 2023
- Neighborhood character
- Predominantly White (92%)
- Race & ethnicity
- White 92% Two or more races 7% Hispanic / Latino 2%
- Common ancestry
- Lithuanian 16% Slovak 3% Romanian 2%
- Foreign-born
- 2% · Canada
- Languages at home
- 93% English-only · French/Haitian/Cajun 6% Other Indo-European 1%
Political lean MEDSL · Kennebec
- 2024 margin
- Toss-up / Even · D 47.5% · R 50.2% · Other 2.4%
- 2008→2024 swing
- -17.5pp toward R · 2008: 14.8pp · 2024: -2.8pp
- All cycles
- 2024: R+2.8 2020: D+0.2 2016: R+3.7 2012: D+13.5 2008: D+14.8
Not yet ingested
- Civics
- —
Market trends
- HPI YoY
- ▲ 61.97%
- Current HPI
- 330.4118
- Rent YoY
- —
- Metro
- —
- State GDP YoY
- —
- F500 in state
- 0
Price history
5 events — show timeline
- 2026-05-15 Relisted — MREIS
- 2026-05-14 Contingent — MREIS
- 2026-05-13 Relisted — MREIS
- 2026-05-03 Contingent — MREIS
- 2026-04-30 Listed $280,000 MREIS
Property tax history
+3.6%/yrLatest (2025): $2,336 · +11.6% YoY. Source: county tax records.
Cash-flow waterfall
monthlySold comps — $/sqft
last 12 mo · ≤1 miLoading sold comps…