 Multi-family
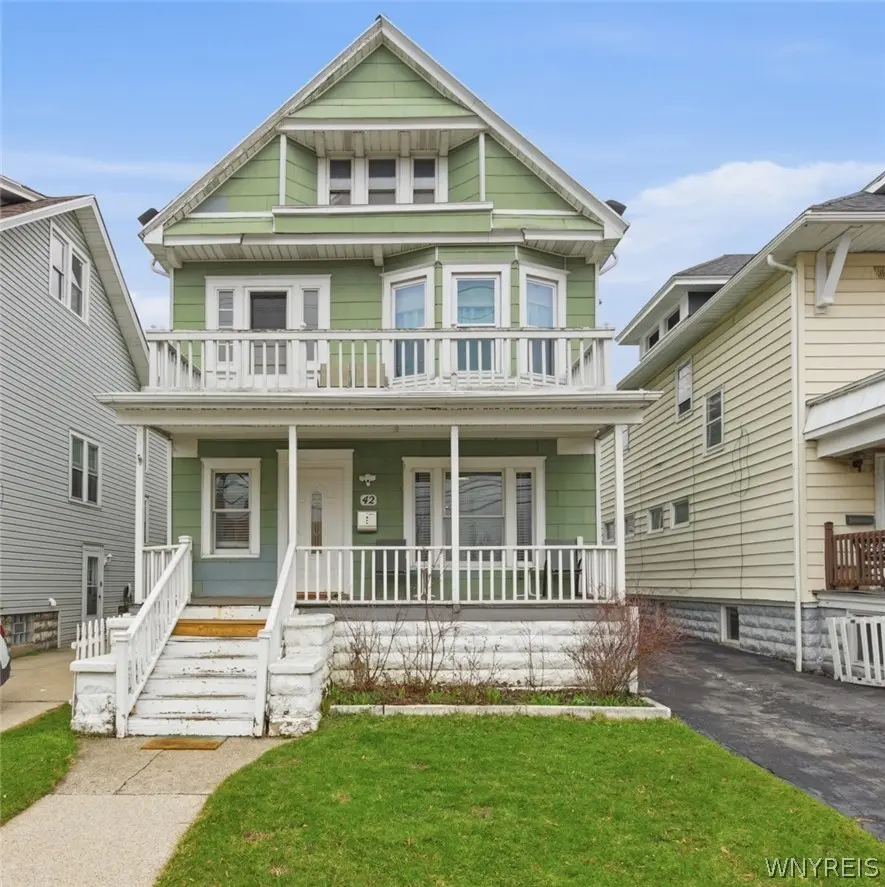
42 Mineral Spring Rd · Buffalo, NY
Flood risk 6/10 · Moderate
- FEMA flood zone
- X (unshaded)
- Chance of flooding over 30 yrs
- 0.7%
- Est. flood insurance / yr
- $473 – $860
Fire risk 1/10 · Minimal
- Est. fire insurance / yr
- $691 – $1,283
Heat risk 3/10 · Minor
- Hot days now (above 92°F)
- 7 days/yr
- Hot days in 30 yrs
- 15 days/yr
Wind risk 1/10 · Minimal
- Chance of severe wind over 30 yrs
- —
Air-quality risk 3/10 · Minor
- Unhealthy air days now
- 2 days/yr
- Unhealthy air days in 30 yrs
- 3 days/yr
Risk factors via First Street. Map © Google.
Why this score? — see what drove the B grade
The composite is a weighted blend of 9 inputs, each scored 0–100. Each bar is that input's sub-score; the figure is the points it added to the 100-point composite (weight × sub-score).
- Cash flow +30.0/30.0
- 1% rule +10.0/10.0
- DSCR +10.0/10.0
- Appreciation +10.0/10.0
- Rent growth +5.0/5.0
- Livability +3.9/5.0
- Schools +3.3/10.0
- Condition / age +2.5/5.0
- ARV discount +0.0/15.0
$279,900
🖨 Deal sheet (PDF) 📄 Offer letter ✓ Due diligence
Multi-family units
County records classify this as Multi-Family (2-4 Unit). Listing-text estimate: 1 unit. estimate disagrees with records
Listing remarks MLS
Fantastic rental available for immediate occupancy! Large 3 bedroom with many updates and nice finishes throughout. Enjoy the updated kitchen and full size dining room along with the generous bedroom sizes in this great lower unit!
Key facts
- New front entry door
- New carpeting
- Fresh neutral paint
Tags
Neighborhood map
What this means for you Summary
Snapshot
- This is a 6-bed/2.0-bath multifamily listed at $280k.
Deal economics
- At list price, monthly cash flow is $2k ($28k/yr) — positive.
- The deal already cash-flows at list — no discount required.
- Meets the 1% rule at list price ($5k rent vs $280k).
- Cap rate 16.4% vs local median 8.1% in Buffalo — top-decile yield for the area; either an underpriced asset or a hidden risk that comps aren't pricing in. Stress-test before assuming the spread holds.
Location & tenants
- Location reads 77/100 on livability (#195 in NY, #3,011 nationally) — a middle-class / working-renter tenant base. Strengths: commute A+, housing A+, health & safety A+; Watch: crime F, employment D-.
- Buffalo City School District (urban): math 41% / reading 40% proficiency, ranked #535 of 590 in NY (top 91%) — families likely to look elsewhere, expect single-tenant / working-renter base with shorter leases; 75% free/reduced lunch — lower-income household profile, screen leases tightly.
- Zoned schools: International School (math 8% / reading 17%, grade F, #2,048 of 2,108 statewide, top 97%, 981 students, 92% FRL); Hutchinson Central Technical High School (math 96% / reading 32%, grade B-, #807 of 1,100 statewide, top 73%, 1,175 students, 78% FRL).
- Market conditions: Rents rising fast (+12.7%/yr); 94 active listings in the ZIP; 1,244 units permitted in Erie County in 2024 (563 in 5+ unit buildings).
- At $5,427/mo this rent would consume 120% of the median local household income ($54k/yr) (locally 959% of renters already pay >50% of income on rent) — very limited rent-growth headroom before tenants either downsize or default.
Forward outlook
- In year one you build about $30k of equity ($2k loan paydown + $28k appreciation (10.0% local appreciation)).
- At projected returns (10.0% appreciation + 8.0% rent growth), your $78k cash investment doubles in ~2 years — after that, you're playing with house money.
- By year 2, paydown + projected appreciation supports a ~$48k cash-out refi (75% LTV) — recoverable capital for the next deal without selling this one.
Negotiation context
- Only 10 days on market — expect competitive offers; lowballing is unlikely to land.
- 3 sale attempts since 17y ago with the ask held roughly flat each time — persistent listings suggest the price (not the market) is what's stuck; bring a comps-based counter.
- Current owner paid $79k; list at $280k implies a 254% gain — meaningful room to come down on a strong offer.
Risks & watch-outs
- Watch-outs: built in 1900 — expect roof / HVAC / electrical / plumbing capex.
- Climate carrying-cost: major flood risk — expect insurance premiums to compound above CPI over the hold.
Questions for the listing agent
- Built in 1900 — when were the roof, HVAC, electrical panel, plumbing, and water heater last replaced?
- Is there a deadline driving the sale (1031 exchange, divorce, estate, relocation)? That informs how much negotiation room exists.
- Crime grade is F in this area — have there been break-ins, vandalism, or insurance claims at this property in the last 3 years? What carrier currently insures it and at what premium?
- What's the average days-on-market for RENTAL listings here right now (not sales)? A rising rental-DOM trend means longer vacancies and softer asking-rent achievability than the comps imply.
- What's the recent tenant-quality profile in this submarket — average credit score on applications, eviction rate, late-payment / NSF rate, and stable-employment percentage? A property-management company in the area should have these aggregated.
- How much new apartment / multifamily construction is in the pipeline within 1–3 miles? Heavy new supply (>2% of stock underway) typically softens rents 12–24 months out; light construction supports rent growth.
Investment metrics
- 1% rule
- 1.94% ✓
- Cap rate
- 16.38%
- Cash-on-cash
- 36.03%
- DSCR
- 2.60
- GRM
- 4.3
CMA / ARV
- ARV (on-the-fly)
- $218,688
- Comps found
- 12
Show comp detail 12 sales within ~0.75 mi
| Address | Dist | Beds/Ba | Sqft | Sold | Price | $/sf | Match |
|---|---|---|---|---|---|---|---|
| 42 Mineral Spring Rd | 0.00mi | 6/2.0 | 2,278 (0%) | 0mo | $300,000 | $132 | 100 |
| 219 Stevenson St | 0.13mi | 6/2.0 | 2,332 (+2%) | 6mo | $190,000 | $81 | 85 |
| 110 Armin Pl | 0.20mi | 5/2.0 (-1) | 2,366 (+4%) | 1mo | $235,000 | $99 | 78 |
| 26 Kamper Ave | 0.27mi | 6/2.0 | 2,394 (+5%) | 3mo | $179,000 | $75 | 76 |
| 75 Juniata Pl | 0.33mi | 6/2.0 | 2,544 (+12%) | 2mo | $245,000 | $96 | 63 |
| 218 Stevenson St | 0.15mi | 5/2.0 (-1) | 2,552 (+12%) | 7mo | $145,000 | $57 | 62 |
| 96 Stevenson St | 0.37mi | 6/2.0 | 2,496 (+10%) | 6mo | $272,096 | $109 | 62 |
| 18 Sage Ave | 0.29mi | 6/2.0 | 2,578 (+13%) | 4mo | $164,500 | $64 | 61 |
| 35 Kimmel Ave | 0.71mi | 6/2.0 | 2,218 (-3%) | 2mo | $225,000 | $101 | 61 |
| 389 Cumberland Ave | 0.58mi | 5/2.0 (-1) | 2,328 (+2%) | 5mo | $280,000 | $120 | 60 |
| 71 Buffum St | 0.53mi | 5/2.0 (-1) | 2,136 (-6%) | 6mo | $160,000 | $75 | 55 |
| 39 Kimmel Ave | 0.70mi | 6/2.0 | 2,016 (-12%) | 4mo | $152,000 | $75 | 45 |
Match score weights: distance 35% · size 25% · config 20% · recency 20%. Top-matched comps best support the ARV.
Projected returns pro-forma
10.0% appreciation · 8.0% rent growth · sell at horizon
- IRR
- 55.3%
- Equity multiple
- 5.22×
- Total profit
- $331,067
- Equity at exit
- $252,156
- IRR
- 51.0%
- Equity multiple
- 12.84×
- Total profit
- $928,301
- Equity at exit
- $543,784
Cash invested: $78,372 (down + closing). Projections, not guarantees.
Landlord ↔ Tenant lean methodology
- Overall (STATE)
- 15 Strongly Tenant-Friendly
- State New York
- 15 Strongly Tenant-Friendly · D+10
- County
- — inherits STATE
- City
- — inherits STATE
ZIP-level market 14210
- Home prices YoY
- 13.8%
- Rents YoY
- 12.7%
- Active inventory
- 94
- Price-to-rent
- 17.2×
Monthly cashflow live
- Estimated rent
- $5,427 medium interval (Pro) →
- Mortgage (P&I)
- −$1,468
- Tax est. 1.5%
- −$350 /mo · $4,198/yr
- Insurance
- −$117
- HOA
- −$0
- Lot rent
- −$0
- Vacancy / Maint / Mgmt
- −$1,140
- Net cashflow
- $2,353
Break-even live
Sensitivity live
| Price | -10% $2,546 | -5% $2,450 | +0% $2,353 | +5% $2,256 | +10% $2,160 |
|---|---|---|---|---|---|
| Rent | -10% $1,924 | -5% $2,139 | +0% $2,353 | +5% $2,567 | +10% $2,782 |
| Rate | -1.0pp $2,494 | -0.5pp $2,424 | base $2,353 | +0.5pp $2,280 | +1.0pp $2,207 |
4-unit breakdown (identical units grouped — click to expand)
| Units | Beds | Baths | Est. rent |
|---|---|---|---|
| 4× units | 3 | 1 | $5,428 |
| #1 | 3 | 1 | $1,357 |
| #2 | 3 | 1 | $1,357 |
| #3 | 3 | 1 | $1,357 |
| #4 | 3 | 1 | $1,357 |
| Total (4 units) | $5,427 | ||
UW: 25.0% down · 7.5% · 30yr · 1.5% tax · 5.0% vac · 8.0% maint · 8.0% mgmt
Financing live
Cash to close
- Down payment
- $69,975
- Closing costs
- $8,397
- Reserves months
- —
- Total cash needed
- —
Loan-product check · same deal, 3 products live
Conventional
25% down · 7.5% · 30yr
- Down + closing
- —
- Monthly P&I
- —
- Monthly cashflow
- —
- DSCR
- —
- Eligible?
- —
Personal DTI + credit; lowest rate.
DSCR
20% down · 8.5% · 30yr
- Down + closing
- —
- Monthly P&I
- —
- Monthly cashflow
- —
- DSCR
- —
- Eligible?
- —
No personal income docs; deal must DSCR.
Hard money
10% down · 12.0% · 12mo
- Down + closing
- —
- Monthly P&I
- —
- Monthly cashflow
- —
- DSCR
- —
- Eligible?
- —
Short-term bridge; refi at stabilization.
Listing history 10 events
-
2026-04-07status Pending
-
2026-03-29$279,900 Active
-
2018-09-20soldstatus $79,000
-
2018-09-14soldstatus $80,000 Closed Sale or Rented
-
2018-07-12status Under Contract- Do Not Show
-
2018-07-09$79,999 Active
-
2010-02-01soldstatus $550 231-char remark
Show marketing remark (231 chars)
Fantastic rental available for immediate occupancy! Large 3 bedroom with many updates and nice finishes throughout. Enjoy the updated kitchen and full size dining room along with the generous bedroom sizes in this great lower unit!
-
2010-01-15historical 231-char remark
Show marketing remark (231 chars)
Fantastic rental available for immediate occupancy! Large 3 bedroom with many updates and nice finishes throughout. Enjoy the updated kitchen and full size dining room along with the generous bedroom sizes in this great lower unit!
-
2009-12-17$550 231-char remark
Show marketing remark (231 chars)
Fantastic rental available for immediate occupancy! Large 3 bedroom with many updates and nice finishes throughout. Enjoy the updated kitchen and full size dining room along with the generous bedroom sizes in this great lower unit!
-
2007-12-05soldstatus $45,000
ⓘ Source: listings_history table (triggers on properties + properties_extension) + one-shot
backfill from property_details.listing_events for pre-trigger history.
Climate risk First Street
- Flood 6/10 Major FEMA zone X (unshaded) · 70% chance over 30 yrs
- Wildfire 1/10 Low
- Heat 3/10 Moderate 7 d/yr ≥92°F today · 15 d/yr by 30 yrs out
- Wind 1/10 Low
- Air quality 3/10 Moderate 2 unhealthy d/yr today · 3 by 30 yrs out
Nearby sold comps map
Loading sold comps map…
Walkable amenities ~0.75 mi
Loading nearby amenities…
Taxation est. · year 1
- Rental income
- $65,124
- − Mortgage interest
- −$15,679
- − Property taxes
- −$4,198
- − Insurance
- −$1,400
- − Repairs & maintenance
- −$5,210
- − Management
- −$5,210
- − Depreciation
- −$8,143
- Taxable income
- $25,285
- Est. tax owed @ 24.0%
- −$6,068
- After-tax cash flow
- $22,168/yr
For passive investors: Depreciation is non-cash, so a rental often shows a tax loss while cash-flowing — sheltering income. Rental losses are passive: they offset passive income freely, and up to $25,000/yr can offset ordinary (W-2) income if you actively participate and your MAGI is under $100k (phasing out to $0 by $150k); unused losses carry forward. On sale, claimed depreciation is recaptured at up to 25%, and gains may owe capital-gains tax (a 1031 exchange can defer both). Figures are a year-1 estimate at your 24.0% rate — not tax advice; consult a CPA.
Schools (NCES district)
- District
- Buffalo City School District
- NCES district ID
- 3605850
- Math proficiency
- 41% ▲ 11.00%
- Reading proficiency
- 40% ▲ 7.00%
- Median HH income
- $31,665
- Composite
- 33.17/100
- National rank
- #5544
- State rank
- #535 of 590 in NY
Livability — Buffalo
- Score
- 77/100
- State rank
- #195
- US rank
- #3011
Category grades
Schools grade is shown separately in the Schools card above.
Census & demographics
- Census place
- Buffalo, NY
- County
- Erie County · 714,559 people
- City population
- 440,021
- Metro
- Buffalo-Cheektowaga, NY
- Population (ZIP)
- 15,563
- Household income
- $54,197
- Rent vs Own
- Severe rent burden
- 959.0
Population outlook (Erie County) Hauer SSP2
- Today (2025)
- 933,037 people
- By 2030
- 935,181 · +0.2%
- By 2040
- 928,531 · -0.5%
- By 2050
- 905,725 · -2.9%
- By 2075
- 834,037 · -10.6%
- By 2100
- 708,033 · -24.1%
Race, ethnicity, and origin ACS 2023
- Neighborhood character
- Predominantly White (79%)
- Race & ethnicity
- White 79% Two or more races 8% Black 8% Hispanic / Latino 7% Asian 1%
- Hispanic origin (detail)
- Puerto Rican 6%
- Common ancestry
- Romanian 21% Lithuanian 2% Serbian 1%
- Foreign-born
- 2% · Canada, China
- Languages at home
- 95% English-only · Spanish 2% Arabic 1% Other Indo-European 1%
Political lean MEDSL · Erie
- 2024 margin
- Lean D (+9.7) · D 54.8% · R 45.2%
- 2008→2024 swing
- -7.9pp toward R · 2008: 17.5pp · 2024: 9.7pp
- All cycles
- 2024: D+9.7 2020: D+14.7 2016: D+4.8 2012: D+15.6 2008: D+17.5
Not yet ingested
- Civics
- —
Market trends
- HPI YoY
- ▲ 52.34%
- Current HPI
- 431.7951
- Rent YoY
- ▲ 12.67%
- Metro
- Buffalo-Cheektowaga, NY
- State GDP YoY
- ▲ 2.60%
- F500 in state
- 92
Industry mix (Fortune 500 HQ in NY)
| Industry | F500 HQs | Revenue |
|---|---|---|
| Financial Services | 10 | $950B |
|
||
| Consumer Goods | 9 | $162B |
|
||
| Insurance | 4 | $225B |
|
||
| Telecommunications | 2 | $144B |
|
||
| Pharmaceuticals | 2 | $112B |
|
||
| Media / Entertainment | 2 | $69B |
|
||
Price history
+522.0% since first listed10 events — show timeline
- 2026-04-07 Pending — WNYREIS
- 2026-03-29 Listed $279,900 WNYREIS
- 2018-09-20 Sold (Public Records) $79,000 Public Records
- 2018-09-14 Sold (MLS) $80,000 WNYREIS
- 2018-07-12 Pending — WNYREIS
- 2018-07-09 Listed $79,999 WNYREIS
- 2010-02-01 Sold (MLS) $550 WNYREIS
- 2010-01-15 Listing Removed — WNYREIS
- 2009-12-17 Listed $550 WNYREIS
- 2007-12-05 Sold (Public Records) $45,000 Public Records
Property tax history
+6.0%/yrLatest (2025): $465 · +0.0% YoY. Source: county tax records.
Cash-flow waterfall
monthlySold comps — $/sqft
last 12 mo · ≤1 miLoading sold comps…