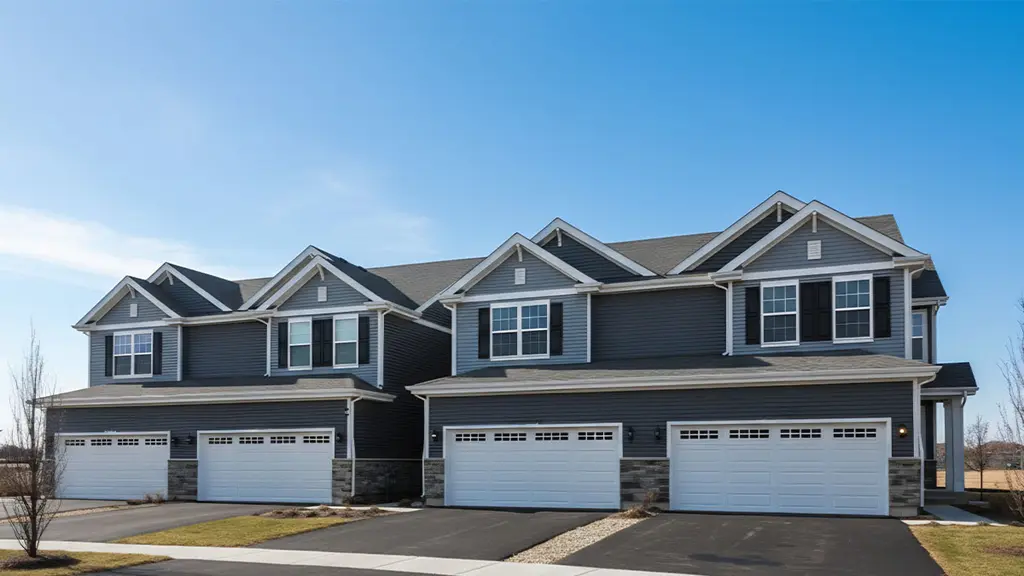
1703 Baler Ave · Aurora, IL
Flood risk No data
- FEMA flood zone
- —
- Chance of flooding over 30 yrs
- —
- Est. flood insurance / yr
- —
Fire risk No data
- Est. fire insurance / yr
- —
Heat risk No data
- Hot days now (above threshold)
- —
- Hot days in 30 yrs
- —
Wind risk No data
- Chance of severe wind over 30 yrs
- —
Air-quality risk No data
- Unhealthy air days now
- —
- Unhealthy air days in 30 yrs
- —
Risk factors via First Street. Map © Google.
Why this score? — see what drove the D- grade
The composite is a weighted blend of 9 inputs, each scored 0–100. Each bar is that input's sub-score; the figure is the points it added to the 100-point composite (weight × sub-score).
- Appreciation +10.0/10.0
- Cash flow +6.7/30.0
- ARV discount +6.0/15.0
- Livability +3.8/5.0
- Schools +3.1/10.0
- 1% rule +2.5/10.0
- Rent growth +2.5/5.0
- Condition / age +2.5/5.0
- DSCR +1.0/10.0
$379,990
🖨 Deal sheet (PDF) 📄 Offer letter ✓ Due diligence
Listing remarks
Discover yourself at 1703 Baler Ave, a beautiful new townhome in our Wheatland Crossing community in Aurora, Illinois. This home will be ready for late summer move in! This home includes a two car garage and a fully maintained home site. This Ashton plan offers 1,794 square feet of living space with 3 bedrooms, a loft, and 2.5 baths. As you enter the home, you will be greeted by the open concept design, including dining and living areas and an expansive kitchen overlooking it all. The kitchen features designer cabinetry, a spacious island with quartz countertops, a pantry, and stainless-steel appliances. Luxury vinyl floors are included in all of the first level and has 9' ceilings th
Key facts
- Spacious island
- Quartz countertops
- Open concept design
Tags
Neighborhood map
What this means for you Summary
Snapshot
- This is a 3-bed/2.5-bath townhouse listed at $380k.
Deal economics
- At list price, monthly cash flow is $-601 ($-7k/yr) — negative.
- To cash-flow at today's rent, offer at most $293k (22.9% below list).
- To meet the 1% rule (rent ≥ 1% of price), the offer needs to be $285k (25.0% below list).
- Recommended offer: $285k (25.0% below list) — sets the bar for 1% rule.
- Cap rate 4.4% vs local median 3.5% in Aurora — meaningfully above typical; check what's discounted (condition, days-on-market, listing class) to confirm the premium yield is real.
Location & tenants
- Location reads 75/100 on livability (#232 in IL, #4,272 nationally) — a middle-class / working-renter tenant base. Strengths: commute A+, housing A+, employment A-; Watch: amenities F, health & safety F.
- CUSD 308 (suburban): math 29% / reading 34% proficiency, ranked #179 of 620 in IL (top 29%) — families likely to look elsewhere, expect single-tenant / working-renter base with shorter leases; only 20% free/reduced lunch — higher-income household profile.
- Zoned schools: The Wheatlands Elementary School (math 39% / reading 46%, grade F, #329 of 2,056 statewide, top 16%, 550 students, 0% FRL); Bednarcik Junior High School (math 39% / reading 38%, grade F, #154 of 665 statewide, top 24%, 571 students, 0% FRL); Oswego East High School (math 35% / reading 40%, grade F, #104 of 693 statewide, top 15%, 2,836 students, 0% FRL) — zoned schools average 0% FRL vs 20% district-wide (20 pts lower); this property's tenant base skews higher-income than the district average.
- Market conditions: 122 active listings in the ZIP; 28 comparable units currently listed for rent nearby; rentals at typical pace (median 24d on market — plan ~3-4 weeks tenant-placement turnaround); high-income renter base; 706 units permitted in Kendall County in 2024 (263 in 5+ unit buildings).
Forward outlook
- In year one you build about $41k of equity ($3k loan paydown + $38k appreciation (10.0% local appreciation)).
- Kendall County population projected at +20% by 2050 — long-run rental-demand tailwind backs the buy-and-hold thesis.
- By year 2, paydown + projected appreciation supports a ~$65k cash-out refi (75% LTV) — recoverable capital for the next deal without selling this one.
Negotiation context
- It's been on market 42 days — a 3% lower offer ($369k) is reasonable based on typical stale-listing flexibility.
Questions for the listing agent
- What do current leases actually rent for vs. the listed asking? Can we see a recent rent roll and the last 12 months of T-12 income?
- It's been on market 42 days. Have you received any prior offers? Is the seller open to a 25% concession, seller financing, or rate buy-down credit?
- What does the HOA fee cover, when was the last increase, and are there any pending special assessments or reserve-fund shortfalls?
- Is there a deadline driving the sale (1031 exchange, divorce, estate, relocation)? That informs how much negotiation room exists.
- Schools are F-rated, which usually means shorter tenancies and higher turnover. Who's the typical renter profile here, and what's been the actual vacancy rate?
- The area grade is low — what's the realistic commute time and amenity access for the typical tenant pool here? Any planned neighborhood developments (good or bad) we should know about?
- What's the average days-on-market for RENTAL listings here right now (not sales)? A rising rental-DOM trend means longer vacancies and softer asking-rent achievability than the comps imply.
- What's the recent tenant-quality profile in this submarket — average credit score on applications, eviction rate, late-payment / NSF rate, and stable-employment percentage? A property-management company in the area should have these aggregated.
- How much new for-sale + rental construction is in the pipeline within 1–3 miles? Heavy new supply typically softens prices + rents 12–24 months out; constrained supply supports both.
Investment metrics
- 1% rule
- 0.75% ✗
- Cap rate
- 4.39%
- Cash-on-cash
- -6.78%
- DSCR
- 0.70
- GRM
- 11.1
CMA / ARV
- ARV (on-the-fly)
- $367,770
- Comps found
- 12
Show comp detail 12 sales within ~0.75 mi
| Address | Dist | Beds/Ba | Sqft | Sold | Price | $/sf | Match |
|---|---|---|---|---|---|---|---|
| 1715 Baler Ave | 0.00mi | 3/2.5 | 1,794 (0%) | 2mo | $411,990 | $230 | 99 |
| 1733 Baler Ave | 0.00mi | 3/2.5 | 1,794 (0%) | 2mo | $409,990 | $229 | 98 |
| 1733 Stable Ln | 0.09mi | 3/2.5 | 1,794 (0%) | 1mo | $389,990 | $217 | 95 |
| 1737 Stable Ln | 0.09mi | 3/2.5 | 1,794 (0%) | 2mo | $417,990 | $233 | 95 |
| 1745 Baler Ave | 0.07mi | 3/2.5 | 1,794 (0%) | 3mo | $366,640 | $204 | 94 |
| 1705 Pontarelli Ct | 0.33mi | 3/2.5 | 1,723 (-4%) | 1mo | $333,000 | $193 | 78 |
| 2084 Canyon Creek Ct | 0.41mi | 3/2.5 | 1,889 (+5%) | 0mo | $430,000 | $228 | 72 |
| 1975 Misty Ridge Ct Unit 1-1 | 0.49mi | 3/1.5 | 1,797 (+0%) | 1mo | $346,000 | $193 | 72 |
| 552 Lincoln Station Dr | 0.59mi | 3/2.0 | 1,597 (-11%) | 0mo | $328,000 | $205 | 52 |
| 558 Lincoln Station Dr #558 | 0.60mi | 3/2.5 | 1,545 (-14%) | 1mo | $310,000 | $201 | 48 |
| 1959 Misty Ridge Ct #1959 | 0.47mi | 2/2.0 (-1) | 1,572 (-12%) | 3mo | $310,000 | $197 | 48 |
| 1633 Fredericksburg Ln #1633 | 0.49mi | 2/2.0 (-1) | 1,572 (-12%) | 3mo | $284,000 | $181 | 47 |
Match score weights: distance 35% · size 25% · config 20% · recency 20%. Top-matched comps best support the ARV.
Projected returns pro-forma
10.0% appreciation · 3.0% rent growth · sell at horizon
- IRR
- 19.5%
- Equity multiple
- 2.59×
- Total profit
- $168,844
- Equity at exit
- $342,325
- IRR
- 17.9%
- Equity multiple
- 5.96×
- Total profit
- $527,695
- Equity at exit
- $738,237
Cash invested: $106,397 (down + closing). Projections, not guarantees.
Landlord ↔ Tenant lean methodology
- Overall (STATE)
- 43 Moderately Tenant-Leaning
- State Illinois
- 43 Moderately Tenant-Leaning · D+7
- County
- — inherits STATE
- City
- — inherits STATE
ZIP-level market 60503
- Home prices YoY
- 4.6%
- Active inventory
- 122
- Price-to-rent
- 11.1×
Monthly cashflow live
- Estimated rent
- $2,852 high interval (Pro) →
- Mortgage (P&I)
- −$1,993
- Tax est. 1.5%
- −$475 /mo · $5,700/yr
- Insurance
- −$158
- HOA
- −$228
- Vacancy / Maint / Mgmt
- −$599
- Net cashflow
- $-601
Break-even live
Sensitivity live
| Price | -10% $-339 | -5% $-470 | +0% $-601 | +5% $-733 | +10% $-864 |
|---|---|---|---|---|---|
| Rent | -10% $-826 | -5% $-714 | +0% $-601 | +5% $-489 | +10% $-376 |
| Rate | -1.0pp $-410 | -0.5pp $-505 | base $-601 | +0.5pp $-700 | +1.0pp $-800 |
UW: 25.0% down · 7.5% · 30yr · 1.5% tax · 5.0% vac · 8.0% maint · 8.0% mgmt
Financing live
Cash to close
- Down payment
- $94,998
- Closing costs
- $11,400
- Reserves months
- —
- Total cash needed
- —
Loan-product check · same deal, 3 products live
Conventional
25% down · 7.5% · 30yr
- Down + closing
- —
- Monthly P&I
- —
- Monthly cashflow
- —
- DSCR
- —
- Eligible?
- —
Personal DTI + credit; lowest rate.
DSCR
20% down · 8.5% · 30yr
- Down + closing
- —
- Monthly P&I
- —
- Monthly cashflow
- —
- DSCR
- —
- Eligible?
- —
No personal income docs; deal must DSCR.
Hard money
10% down · 12.0% · 12mo
- Down + closing
- —
- Monthly P&I
- —
- Monthly cashflow
- —
- DSCR
- —
- Eligible?
- —
Short-term bridge; refi at stabilization.
Rent comps 28 comps
| Address | Beds | Baths | Sqft | Rent | $/sqft | DOM | Units | Dist |
|---|---|---|---|---|---|---|---|---|
| 1998 Conway Ln Aurora, IL | 4.0 | 2.5 | 2304 | $3,200 | $1.39 | 46d | 1 | 0.15mi |
| 1847 Clubhouse Dr Aurora, IL | 1.0–3.0 | 1.0–2.0 | 1238 | $2,781 | $2.25 | 1d | 23 | 0.19mi |
| 2048 Canyon Creek Ct Aurora, IL | 4.0 | 2.5 | 1794 | $3,400 | $1.90 | 24d | 1 | 0.29mi |
| 1801 Turtle Creek Dr Aurora, IL | 3.0 | 2.5 | 1794 | $3,300 | $1.84 | 20d | 1 | 0.33mi |
| 2333 Summerlin Dr #2333 Aurora, IL | 2.0 | 2.0 | 1572 | $2,500 | $1.59 | 46d | 1 | 0.62mi |
| 2337 Summerlin Dr Aurora, IL | 3.0 | 1.5 | 1700 | $2,500 | $1.47 | 46d | 1 | 0.62mi |
| 616 Lincoln Station Dr Oswego, IL | 2.0 | 2.5 | 1318 | $2,250 | $1.71 | 26d | 1 | 0.66mi |
| 669 Lincoln Station Dr #669 Oswego, IL | 3.0 | 2.5 | 1315 | $2,250 | $1.71 | 23d | 1 | 0.68mi |
| 640 Lincoln Station Dr Oswego, IL | 2.0 | 2.5 | 1318 | $2,100 | $1.59 | 46d | 1 | 0.69mi |
| 644 Lincoln Station Dr #644 Oswego, IL | 3.0 | 2.5 | 1318 | $2,250 | $1.71 | 46d | 1 | 0.69mi |
| 652 Lincoln Station Dr Oswego, IL | 3.0 | 2.5 | 1500 | $1,999 | $1.33 | 19d | 1 | 0.71mi |
| 652 Lincoln Station Dr Oswego, IL | 3.0 | 2.5 | 1500 | $1,999 | $1.33 | 6d | 1 | 0.71mi |
| 690 Lincoln Station Dr Oswego, IL | 3.0 | 2.5 | 1318 | $2,100 | $1.59 | 4d | 1 | 0.75mi |
| 2205 Daybreak Dr #2205 Aurora, IL | 2.0 | 2.5 | 1700 | $2,500 | $1.47 | 7d | 1 | 0.97mi |
| 2226 Daybreak Dr #2226 Aurora, IL | 3.0 | 2.5 | 1627 | $2,500 | $1.54 | 46d | 1 | 0.99mi |
| 2036 Antietam Ct Aurora, IL | 4.0 | 2.5 | 2345 | $3,450 | $1.47 | 5d | 1 | 1.21mi |
| 2516 Hillsboro Blvd Aurora, IL | 2.0 | 2.5 | 1482 | $2,300 | $1.55 | 19d | 1 | 1.26mi |
| 2460 Georgetown Cir Aurora, IL | 2.0 | 2.5 | 1532 | $2,400 | $1.57 | 4d | 1 | 1.27mi |
| 1419 Farrington Ln Aurora, IL | 3.0 | 1.5 | 1476 | $2,959 | $2.00 | 5d | 1 | 1.28mi |
| 2531 Congress Ave #2531 Aurora, IL | 3.0 | 2.5 | 1532 | $2,500 | $1.63 | 46d | 1 | 1.34mi |
| 1464 Farrington Ln Aurora, IL | 4.0 | 2.5 | 1836 | $3,300 | $1.80 | 1d | 1 | 1.35mi |
| 2550 Providence Ave Aurora, IL | 2.0 | 2.5 | 1550 | $2,300 | $1.48 | 46d | 1 | 1.37mi |
| 2575 Hillsboro Blvd Aurora, IL | 3.0 | 2.5 | 1530 | $2,500 | $1.63 | 46d | 1 | 1.37mi |
| 2598 Hillsboro Blvd Aurora, IL | 3.0 | 2.5 | 1482 | $2,395 | $1.62 | 23d | 1 | 1.39mi |
| 347 Devoe Dr Oswego, IL | 3.0 | 2.5 | 1520 | $2,595 | $1.71 | 15d | 1 | 1.39mi |
| 337 Devoe Dr #337 Oswego, IL | 3.0 | 2.5 | 1500 | $2,600 | $1.73 | 26d | 1 | 1.39mi |
| 2270 Georgetown Cir Unit 2270 Aurora, IL | 3.0 | 2.5 | 1533 | $2,800 | $1.83 | 46d | 1 | 1.42mi |
| 2420 Harbor Ct Aurora, IL | 3.0 | 2.0 | 1705 | $3,150 | $1.85 | 26d | 1 | 1.48mi |
HOA detail
- Monthly dues
- $228 · $2,736/yr
Listing history 2 events
-
2026-03-23status Pending
-
2026-02-09$379,990 Active
ⓘ Source: listings_history table (triggers on properties + properties_extension) + one-shot
backfill from property_details.listing_events for pre-trigger history.
Nearby sold comps map
Loading sold comps map…
Walkable amenities ~0.75 mi
Loading nearby amenities…
Taxation est. · year 1
- Rental income
- $34,220
- − Mortgage interest
- −$21,285
- − Property taxes
- −$5,700
- − Insurance
- −$1,900
- − Repairs & maintenance
- −$2,738
- − Management
- −$2,738
- − HOA
- −$2,736
- − Depreciation
- −$11,054
- Taxable loss
- −$13,931
- Est. tax savings @ 24.0%
- +$3,343
- After-tax cash flow
- $-3,871/yr
For passive investors: Depreciation is non-cash, so a rental often shows a tax loss while cash-flowing — sheltering income. Rental losses are passive: they offset passive income freely, and up to $25,000/yr can offset ordinary (W-2) income if you actively participate and your MAGI is under $100k (phasing out to $0 by $150k); unused losses carry forward. On sale, claimed depreciation is recaptured at up to 25%, and gains may owe capital-gains tax (a 1031 exchange can defer both). Figures are a year-1 estimate at your 24.0% rate — not tax advice; consult a CPA.
Schools (NCES district)
- District
- CUSD 308
- NCES district ID
- 1730270
- Math proficiency
- 29% ▼ -10.00%
- Reading proficiency
- 34% ▼ -9.00%
- Median HH income
- $89,945
- Composite
- 31.25/100
- National rank
- #6028
- State rank
- #179 of 620 in IL
Livability — Aurora
- Score
- 75/100
- State rank
- #232
- US rank
- #4272
Category grades
Schools grade is shown separately in the Schools card above.
Census & demographics
- Census place
- Aurora, IL
- County
- Will County · 412,448 people
- City population
- 186,692
- Metro
- Chicago-Naperville-Elgin, IL-IN-WI
- Population (ZIP)
- 16,789
- Household income
- $136,726
- Rent vs Own
- Severe rent burden
- 19.0
Population outlook (Kendall County) Hauer SSP2
- Today (2025)
- 138,283 people
- By 2030
- 144,935 · +4.8%
- By 2040
- 156,944 · +13.5%
- By 2050
- 165,424 · +19.6%
- By 2075
- 174,715 · +26.3%
- By 2100
- 168,523 · +21.9%
Race, ethnicity, and origin ACS 2023
- Neighborhood character
- Diverse neighborhood (Simpson 0.69)
- Race & ethnicity
- White 49% Asian 19% Black 14% Hispanic / Latino 14% Two or more races 7%
- Hispanic origin (detail)
- Mexican 11% Puerto Rican 1%
- Common ancestry
- Romanian 10% Scandinavian 3% Italian 1%
- Foreign-born
- 22% · Canada, China, Vietnam
- Languages at home
- 68% English-only · Other Indo-European 11% Spanish 8% Other Asian/Pacific 4%
Political lean MEDSL · Kendall
- 2024 margin
- Toss-up / Even · D 50.0% · R 48.5% · Other 1.6%
- 2008→2024 swing
- -5.7pp toward R · 2008: 7.2pp · 2024: 1.5pp
- All cycles
- 2024: D+1.5 2020: D+5.7 2016: R+1.5 2012: R+4.1 2008: D+7.2
Not yet ingested
- Civics
- —
Market trends
- HPI YoY
- ▲ 10.31%
- Current HPI
- 232.382
- Rent YoY
- —
- Metro
- Chicago-Naperville-Elgin, IL-IN-WI
- State GDP YoY
- ▲ 1.59%
- F500 in state
- 60
Industry mix (Fortune 500 HQ in IL)
| Industry | F500 HQs | Revenue |
|---|---|---|
| Insurance | 4 | $201B |
|
||
| Consumer Goods | 4 | $87B |
|
||
| Industrial Machinery | 3 | $64B |
|
||
| Healthcare | 2 | $55B |
|
||
| Retail / Pharmacy | 1 | $148B |
|
||
| Agriculture / Food | 1 | $86B |
|
||
Price history
2 events — show timeline
- 2026-03-23 Pending — MRED as Distributed by MLS Grid
- 2026-02-09 Listed $379,990 MRED as Distributed by MLS Grid
Cash-flow waterfall
monthlySold comps — $/sqft
last 12 mo · ≤1 miLoading sold comps…