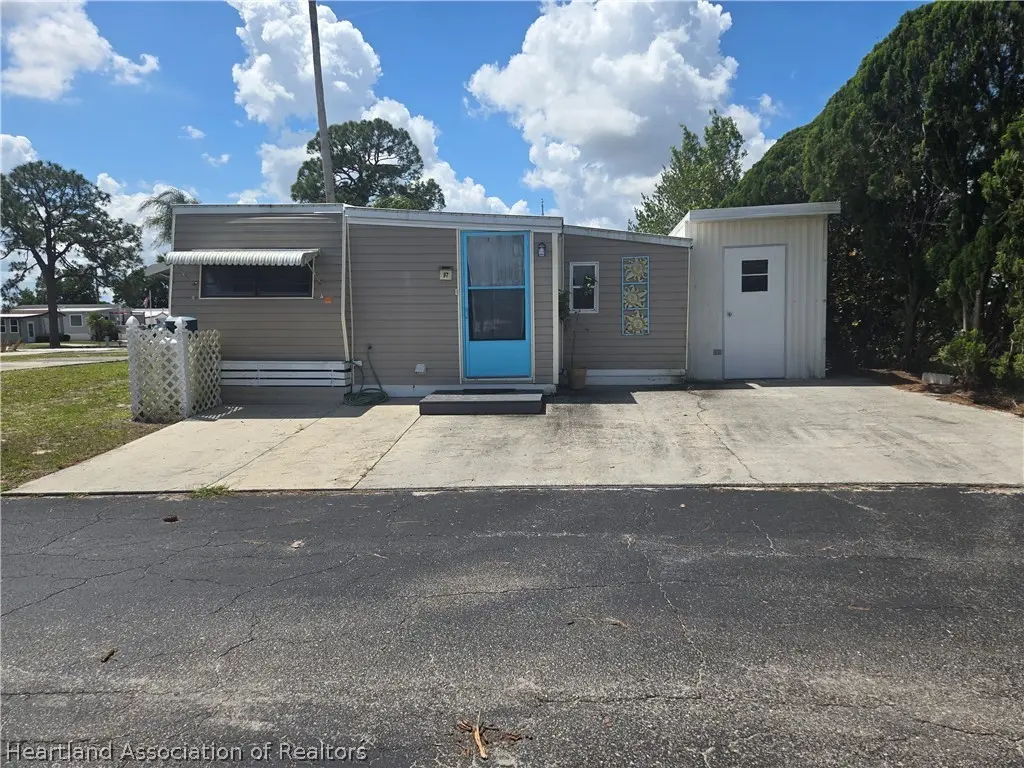
97 Circle Rdg · Lake Placid, FL
Flood risk 8/10 · Major
- FEMA flood zone
- X (unshaded)
- Chance of flooding over 30 yrs
- 0.99%
- Est. flood insurance / yr
- $507 – $1,088
Fire risk 5/10 · Moderate
- Est. fire insurance / yr
- $947 – $1,759
Heat risk 8/10 · Major
- Hot days now (above 108°F)
- 7 days/yr
- Hot days in 30 yrs
- 25 days/yr
Wind risk 10/10 · Severe
- Chance of severe wind over 30 yrs
- 99.0%
Air-quality risk 2/10 · Minimal
- Unhealthy air days now
- 1 days/yr
- Unhealthy air days in 30 yrs
- 2 days/yr
Risk factors via First Street. Map © Google.
Why this score? — see what drove the D grade
The composite is a weighted blend of 9 inputs, each scored 0–100. Each bar is that input's sub-score; the figure is the points it added to the 100-point composite (weight × sub-score).
- Cash flow +15.0/30.0
- ARV discount +7.5/15.0
- 1% rule +5.0/10.0
- DSCR +5.0/10.0
- Schools +3.6/10.0
- Livability +3.4/5.0
- Rent growth +2.7/5.0
- Condition / age +2.5/5.0
- Appreciation +0.0/10.0
$10,000
🖨 Deal sheet (PDF) 📄 Offer letter ✓ Due diligence
Listing remarks
Affordable to purchase, cute little winter escape in all age community with inground pool, shuffleboard, pickleball, organized activities in the clubhouse, card games you name it they have it all. Has lots of potential at a great price. Location is key, close to lots of activities to enjoy, numerous fresh water lakes for great fishing and water sports, and only an hour and a half to either coast. 2 hours to Disney World and less that 1/2 hour to Sebring International Race Track. Bring you pets, limited to 2.
Key facts
- 2 parking spots
- Community pool
- Built 1989
Property features AI
Finance
- Financial info: Monthly land lease: $809
- HOA & community: Community clubhouse; Community pool; Land is leased (land lease payment applies)
Exterior
- Parking: 2 parking spaces
- Utilities: Public water; Public sewer
- Home design: Manufactured in park (mobile home); Single-wide; One level; Zoned MH/RL
- Construction: Frame construction; Other-style roof
- Exterior features: Enclosed patio; Front porch; Community pool access; Shed(s); Workshop; Paved road access
Interior
- Kitchen: Oven; Range; Refrigerator
- Bedrooms: Total of 5 rooms (includes living spaces and bedrooms)
- Flooring: Laminate; Simulated wood; Vinyl
- Bathrooms: 1 full bathroom
- Heating & cooling: Central heating (electric); Central air conditioning (electric)
- Interior features: High-speed internet; Window blinds
- Laundry & utility: Washer; Dryer
Neighborhood map
What this means for you Summary
Snapshot
- This is a 1-bed/1.0-bath manufactured listed at $10k.
Deal economics
- At list price, monthly cash flow is $838 ($10k/yr) — positive.
- The deal already cash-flows at list — no discount required.
- Meets the 1% rule at list price ($1k rent vs $10k).
- Recommended offer: $10k (3.0% below list) — sets the bar for market timing.
- Cap rate 114.9% vs local median 3.8% in Lake Placid — top-decile yield for the area; either an underpriced asset or a hidden risk that comps aren't pricing in. Stress-test before assuming the spread holds.
Location & tenants
- Location reads 68/100 on livability (#525 in FL) — a middle-class / working-renter tenant base. Strengths: crime A+, cost of living A+, health & safety A+; Watch: amenities F, commute F, employment F.
- Highlands (other): math 45% / reading 43% proficiency, ranked #54 of 73 in FL (top 74%) — families likely to look elsewhere, expect single-tenant / working-renter base with shorter leases; 68% free/reduced lunch — lower-income household profile, screen leases tightly.
- Zoned schools: Lake Country Elementary School (math 57% / reading 54%, grade C, #855 of 2,144 statewide, top 41%, 685 students, 73% FRL); Lake Placid Middle School (math 42% / reading 33%, grade F, #395 of 571 statewide, top 70%, 621 students, 75% FRL); Lake Placid High School (math 36% / reading 35%, grade F, #367 of 667 statewide, top 57%, 868 students, 66% FRL) — zoned schools at 71% FRL track the district average.
- Market conditions: Rents flat; 1495 active listings in the ZIP; 980 units permitted in Highlands County in 2024 (80 in 5+ unit buildings).
Forward outlook
- Local home prices are declining (-3.0%/yr); year-one equity from $69 of loan paydown is wiped out by about $300 of value loss. Plan a longer hold.
- At projected returns (-3.0% appreciation + 0.8% rent growth), your $3k cash investment doubles in ~1 year — after that, you're playing with house money.
Negotiation context
- It's been on market 47 days — a 3% lower offer ($10k) is reasonable based on typical stale-listing flexibility.
Risks & watch-outs
- Watch-outs: flood insurance adds $66/mo.
- Climate carrying-cost: severe flood risk; severe wind risk, 99% chance of damaging wind over 30y; moderate wildfire risk; extreme-heat days projected 7→25/yr by 2055 (HVAC capex compounding) — expect insurance premiums to compound above CPI over the hold.
Questions for the listing agent
- It's been on market 47 days. Have you received any prior offers? Is the seller open to a 3% concession, seller financing, or rate buy-down credit?
- What's the actual annual flood-insurance premium (NFIP or private), and is the property in a SFHA with mandatory coverage?
- Is there a deadline driving the sale (1031 exchange, divorce, estate, relocation)? That informs how much negotiation room exists.
- Schools are D-rated, which usually means shorter tenancies and higher turnover. Who's the typical renter profile here, and what's been the actual vacancy rate?
- The area grade is low — what's the realistic commute time and amenity access for the typical tenant pool here? Any planned neighborhood developments (good or bad) we should know about?
- What's the average days-on-market for RENTAL listings here right now (not sales)? A rising rental-DOM trend means longer vacancies and softer asking-rent achievability than the comps imply.
- What's the recent tenant-quality profile in this submarket — average credit score on applications, eviction rate, late-payment / NSF rate, and stable-employment percentage? A property-management company in the area should have these aggregated.
- How much new for-sale + rental construction is in the pipeline within 1–3 miles? Heavy new supply typically softens prices + rents 12–24 months out; constrained supply supports both.
Investment metrics
- 1% rule
- 12.33% ✓
- Cap rate
- 114.88%
- Cash-on-cash
- 387.82%
- DSCR
- 18.26
- GRM
- 0.7
CMA / ARV
- ARV (on-the-fly)
- $2,880
- Comps found
- 1
Show comp detail 1 sale within ~0.75 mi
| Address | Dist | Beds/Ba | Sqft | Sold | Price | $/sf | Match |
|---|---|---|---|---|---|---|---|
| 89 Circle Rdg | 0.03mi | 1/1.0 | 624 (+8%) | 16mo | $3,000 | $5 | 71 |
Match score weights: distance 35% · size 25% · config 20% · recency 20%. Top-matched comps best support the ARV.
Projected returns pro-forma
-3.0% appreciation · 0.82% rent growth · sell at horizon
- IRR
- —
- Equity multiple
- 18.57×
- Total profit
- $49,193
- Equity at exit
- $1,491
- IRR
- —
- Equity multiple
- 37.23×
- Total profit
- $101,444
- Equity at exit
- $865
Cash invested: $2,800 (down + closing). Projections, not guarantees.
Landlord ↔ Tenant lean methodology
- Overall (STATE)
- 87 Strongly Landlord-Friendly
- State Florida
- 87 Strongly Landlord-Friendly · R+3
- County
- — inherits STATE
- City
- — inherits STATE
ZIP-level market 33852
- Rents YoY
- 0.8%
- Active inventory
- 1495
- Price-to-rent
- 0.7×
Monthly cashflow live
- Estimated rent
- $1,233 medium interval (Pro) →
- Mortgage (P&I)
- −$52
- Tax est. 1.5%
- −$12 /mo · $150/yr
- Insurance
- −$4
- Flood insurance flood zone
- −$66 /mo · $798/yr
- HOA
- −$0
- Vacancy / Maint / Mgmt
- −$259
- Net cashflow
- $838
Break-even live
Sensitivity live
| Price | -10% $845 | -5% $842 | +0% $838 | +5% $835 | +10% $832 |
|---|---|---|---|---|---|
| Rent | -10% $741 | -5% $790 | +0% $838 | +5% $887 | +10% $936 |
| Rate | -1.0pp $843 | -0.5pp $841 | base $838 | +0.5pp $836 | +1.0pp $833 |
UW: 25.0% down · 7.5% · 30yr · 1.5% tax · 5.0% vac · 8.0% maint · 8.0% mgmt
Financing live
Cash to close
- Down payment
- $2,500
- Closing costs
- $300
- Reserves months
- —
- Total cash needed
- —
Loan-product check · same deal, 3 products live
Conventional
25% down · 7.5% · 30yr
- Down + closing
- —
- Monthly P&I
- —
- Monthly cashflow
- —
- DSCR
- —
- Eligible?
- —
Personal DTI + credit; lowest rate.
DSCR
20% down · 8.5% · 30yr
- Down + closing
- —
- Monthly P&I
- —
- Monthly cashflow
- —
- DSCR
- —
- Eligible?
- —
No personal income docs; deal must DSCR.
Hard money
10% down · 12.0% · 12mo
- Down + closing
- —
- Monthly P&I
- —
- Monthly cashflow
- —
- DSCR
- —
- Eligible?
- —
Short-term bridge; refi at stabilization.
Listing history 16 events
-
2026-06-21days on market $10,000 Active 47 DOM
-
2026-06-19days on market $10,000 Active 45 DOM
-
2026-06-18days on market $10,000 Active 44 DOM
-
2026-06-17days on market $10,000 Active 43 DOM
-
2026-06-16days on market $10,000 Active 42 DOM
-
2026-06-15days on market $10,000 Active 41 DOM
-
2026-06-14days on market $10,000 Active 39 DOM
-
2026-06-10days on market $10,000 Active 36 DOM
-
2026-06-09days on market $10,000 Active 35 DOM
-
2026-06-08days on market $10,000 Active 34 DOM
-
2026-06-07days on market $10,000 Active 33 DOM
-
2026-06-02days on market $10,000 Active 28 DOM
-
2026-06-01days on market $10,000 Active 27 DOM
-
2026-05-31days on market $10,000 Active 26 DOM
-
2026-05-30days on market $10,000 Active 25 DOM
-
2026-05-03$10,000 Active
ⓘ Source: listings_history table (triggers on properties + properties_extension) + one-shot
backfill from property_details.listing_events for pre-trigger history.
Climate risk First Street
- Flood 8/10 Severe FEMA zone X (unshaded) · 99% chance over 30 yrs
- Wildfire 5/10 Major
- Heat 8/10 Severe 7 d/yr ≥108°F today · 25 d/yr by 30 yrs out
- Wind 10/10 Extreme 99% chance of damaging wind over 30 yrs
- Air quality 2/10 Low 1 unhealthy d/yr today · 2 by 30 yrs out
Nearby sold comps map
Loading sold comps map…
Walkable amenities ~0.75 mi
Loading nearby amenities…
Taxation est. · year 1
- Rental income
- $14,795
- − Mortgage interest
- −$560
- − Property taxes
- −$150
- − Insurance
- −$848
- − Repairs & maintenance
- −$1,184
- − Management
- −$1,184
- − Depreciation
- −$291
- Taxable income
- $10,579
- Est. tax owed @ 24.0%
- −$2,539
- After-tax cash flow
- $7,522/yr
For passive investors: Depreciation is non-cash, so a rental often shows a tax loss while cash-flowing — sheltering income. Rental losses are passive: they offset passive income freely, and up to $25,000/yr can offset ordinary (W-2) income if you actively participate and your MAGI is under $100k (phasing out to $0 by $150k); unused losses carry forward. On sale, claimed depreciation is recaptured at up to 25%, and gains may owe capital-gains tax (a 1031 exchange can defer both). Figures are a year-1 estimate at your 24.0% rate — not tax advice; consult a CPA.
Schools (NCES district)
- District
- Highlands
- NCES district ID
- 1200840
- Math proficiency
- 45% ▼ -7.00%
- Reading proficiency
- 43% ▼ -3.00%
- Median HH income
- $35,276
- Composite
- 36.42/100
- National rank
- #4672
- State rank
- #54 of 73 in FL
Livability — Lake Placid
- Score
- 68/100
- State rank
- #525
- US rank
- #9813
Category grades
Schools grade is shown separately in the Schools card above.
Census & demographics
- County
- Highlands County · 98,898 people
- City population
- 22,600
- Metro
- Sebring-Avon Park, FL
- Population (ZIP)
- 22,600
- Household income
- $54,284
- Rent vs Own
- Severe rent burden
- 439.0
Population outlook (Highlands County) Hauer SSP2
- Today (2025)
- 99,674 people
- By 2030
- 99,615 · -0.1%
- By 2040
- 99,342 · -0.3%
- By 2050
- 98,242 · -1.4%
- By 2075
- 93,291 · -6.4%
- By 2100
- 79,894 · -19.8%
Race, ethnicity, and origin ACS 2023
- Neighborhood character
- Predominantly White (68%)
- Race & ethnicity
- White 68% Hispanic / Latino 22% Two or more races 11% Black 6% Asian 1%
- Hispanic origin (detail)
- Mexican 11% Puerto Rican 3% Cuban 3%
- Common ancestry
- Lithuanian 2% Slovak 2% Iranian 1%
- Foreign-born
- 14% · Canada, Dominican Republic
- Languages at home
- 79% English-only · Spanish 19% Tagalog/Filipino 1%
Political lean MEDSL · Highlands
- 2024 margin
- Solid R (+40.8) · D 29.3% · R 70.1%
- 2008→2024 swing
- -22.7pp toward R · 2008: -18.1pp · 2024: -40.8pp
- All cycles
- 2024: R+40.8 2020: R+34.4 2016: R+32.0 2012: R+23.0 2008: R+18.1
Not yet ingested
- Civics
- —
Market trends
- HPI YoY
- ▼ -203.31%
- Current HPI
- 224.8693
- Rent YoY
- ▲ 0.82%
- Metro
- Sebring-Avon Park, FL
- State GDP YoY
- ▲ 3.28%
- F500 in state
- 36
Industry mix (Fortune 500 HQ in FL)
| Industry | F500 HQs | Revenue |
|---|---|---|
| Industrial Technology | 2 | $29B |
|
||
| Insurance | 2 | $17B |
|
||
| Retail | 1 | $60B |
|
||
| Technology Distribution | 1 | $58B |
|
||
| Homebuilding | 1 | $35B |
|
||
| Technology Manufacturing | 1 | $35B |
|
||
Price history
1 event — show timeline
- 2026-05-03 Listed $10,000 HAOR as distributed by MLS GRID
Cash-flow waterfall
monthlySold comps — $/sqft
last 12 mo · ≤1 miLoading sold comps…