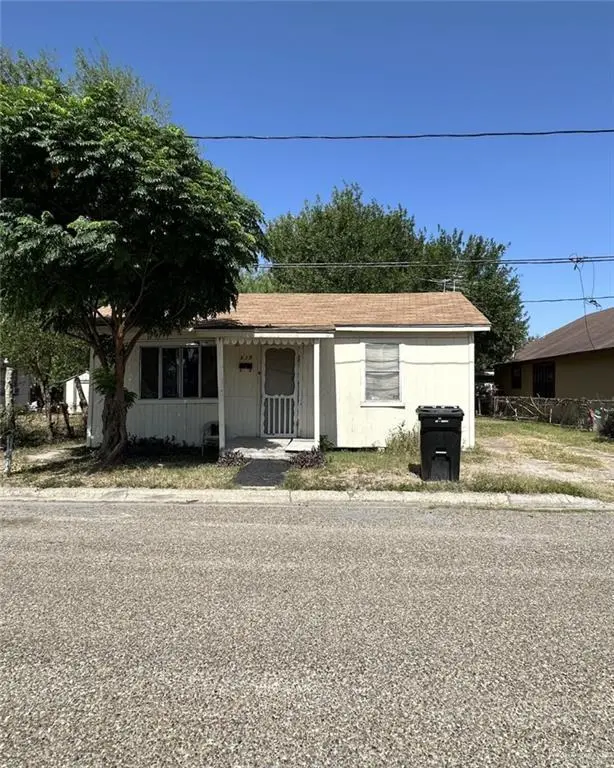
117 S Cantu St S · Weslaco, TX
Flood risk 6/10 · Moderate
- FEMA flood zone
- X
- Chance of flooding over 30 yrs
- 0.7%
- Est. flood insurance / yr
- $507 – $1,088
Fire risk 1/10 · Minimal
- Est. fire insurance / yr
- $1,222 – $2,270
Heat risk 9/10 · Severe
- Hot days now (above 111°F)
- 7 days/yr
- Hot days in 30 yrs
- 23 days/yr
Wind risk 8/10 · Major
- Chance of severe wind over 30 yrs
- 99.0%
Air-quality risk 1/10 · Minimal
- Unhealthy air days now
- 0 days/yr
- Unhealthy air days in 30 yrs
- 0 days/yr
Risk factors via First Street. Map © Google.
Why this score? — see what drove the B- grade
The composite is a weighted blend of 9 inputs, each scored 0–100. Each bar is that input's sub-score; the figure is the points it added to the 100-point composite (weight × sub-score).
- Cash flow +21.8/30.0
- ARV discount +15.0/15.0
- 1% rule +7.0/10.0
- DSCR +7.0/10.0
- Appreciation +4.7/10.0
- Livability +3.6/5.0
- Rent growth +2.5/5.0
- Condition / age +2.5/5.0
- Schools +2.2/10.0
$60,000
🖨 Deal sheet 📄 Offer letter ✓ Due diligence
Listing remarks
Investment opportunity with excellent potential. Property is situated on two lots, offering added value and flexibility for future development, expansion, or additional improvements. Ideal for investors or buyers seeking income-producing potential with additional land space. Buyer to verify all information, zoning, and lot dimensions.
Key facts
- Two lots
- 4,504 sq ft lot
- Built 1973
Tags
Property features AI
Finance
- Other: Lot size approximately 0.1034 acres (about 4,504 sq ft); Building area approximately 728 square feet
- HOA & community: No homeowners association; Community features: other
Exterior
- Parking: No carport; No covered or garage parking
- Utilities: City sewer
- Home design: Single-story property; Living area sourced from HidalgoCAD
- Construction: Built on pillar/post/pier foundation; Other construction materials; Other roof
- Exterior features: Other exterior features; Paved road access
Interior
- Kitchen: Electric water heater; Other appliances
- Flooring: Other flooring
- Bathrooms: 1 full bathroom
- Interior features: Countertops: other; Window coverings: other
Neighborhood map
What this means for you Summary
Snapshot
- This is a 2-bed/1.0-bath single-family listed at $60k.
Deal economics
- At list price, monthly cash flow is $94 ($1k/yr) — positive.
- The deal already cash-flows at list — no discount required.
- Meets the 1% rule at list price ($719 rent vs $60k).
- Recommended offer: $59k (1.5% below list) — sets the bar for market timing.
- Cap rate 8.2% vs local median 4.1% in Weslaco — top-decile yield for the area; either an underpriced asset or a hidden risk that comps aren't pricing in. Stress-test before assuming the spread holds.
Location & tenants
- Location reads 72/100 on livability (#277 in TX) — a middle-class / working-renter tenant base. Strengths: cost of living A+, housing A+, health & safety A+; Watch: employment D+, crime F, amenities F.
- Weslaco ISD (suburban): math 23% / reading 31% proficiency, ranked #705 of 826 in TX (top 85%) — low school quality limits family demand, transient renter base, plan for 1-2y turnover.
- Zoned schools: Airport El (math 27% / reading 22%, grade F, #3,052 of 4,322 statewide, top 74%, 792 students, 86% FRL); Weslaco East H S (math 24% / reading 26%, grade F, #1,250 of 1,632 statewide, top 77%, 2,004 students, 86% FRL) — zoned schools average 86% FRL vs 59% district-wide (27 pts higher); higher-poverty schools than district average — tighter screening recommended.
- Market conditions: 708 active listings in the ZIP; 11 comparable units currently listed for rent nearby; rentals lingering (median 44d on market — plan ~5-8 weeks vacancy on turnover, expect pricing pressure); 100% of comp listings sitting > 30 days — soft ceiling on asking rent; 7,378 units permitted in Hidalgo County in 2024 (641 in 5+ unit buildings).
Forward outlook
- In year one you build about $64 of equity ($415 loan paydown + $-351 appreciation (-0.6% local appreciation)).
- Hidalgo County population projected at +28% by 2050 — long-run rental-demand tailwind backs the buy-and-hold thesis.
- At projected returns (-0.6% appreciation + 3.0% rent growth), your $17k cash investment doubles in ~9 years — after that, you're playing with house money.
Negotiation context
- It's been on market 18 days — a 2% lower offer ($59k) is reasonable based on typical stale-listing flexibility.
Risks & watch-outs
- Watch-outs: property tax is 2.7% of price.
- Climate carrying-cost: major flood risk; severe wind risk, 99% chance of damaging wind over 30y; extreme-heat days projected 7→23/yr by 2055 (HVAC capex compounding) — expect insurance premiums to compound above CPI over the hold.
Questions for the listing agent
- Built in 1973 — when were the roof, HVAC, electrical panel, plumbing, and water heater last replaced?
- Property tax is high relative to price — has the assessment been appealed recently, and will the sale trigger a re-assessment?
- Is there a deadline driving the sale (1031 exchange, divorce, estate, relocation)? That informs how much negotiation room exists.
- Crime grade is F in this area — have there been break-ins, vandalism, or insurance claims at this property in the last 3 years? What carrier currently insures it and at what premium?
- What's the average days-on-market for RENTAL listings here right now (not sales)? A rising rental-DOM trend means longer vacancies and softer asking-rent achievability than the comps imply.
- What's the recent tenant-quality profile in this submarket — average credit score on applications, eviction rate, late-payment / NSF rate, and stable-employment percentage? A property-management company in the area should have these aggregated.
- How much new for-sale + rental construction is in the pipeline within 1–3 miles? Heavy new supply typically softens prices + rents 12–24 months out; constrained supply supports both.
Investment metrics
- 1% rule
- 1.20% ✓
- Cap rate
- 8.17%
- Cash-on-cash
- 6.70%
- DSCR
- 1.30
- GRM
- 7.0
CMA / ARV
- ARV (on-the-fly)
- $98,280
- Comps found
- 8
Show comp detail 8 sales within ~0.75 mi
| Address | Dist | Beds/Ba | Sqft | Sold | Price | $/sf | Match |
|---|---|---|---|---|---|---|---|
| 116 N Kansas Ave | 0.23mi | 2/1.0 | 720 (-1%) | 12mo | $75,000 | $104 | 78 |
| 216 S Guerra Ave | 0.30mi | 2/1.0 | 792 (+9%) | 1mo | $73,500 | $93 | 70 |
| 209 N Kansas St | 0.28mi | 3/1.0 (+1) | 732 (+0%) | 20mo | $95,000 | $130 | 64 |
| 607 Elma St | 0.44mi | 2/1.0 | 672 (-8%) | 12mo | $116,900 | $174 | 57 |
| 302 E Esplanada St | 0.45mi | 2/1.0 | 770 (+6%) | 20mo | $110,000 | $143 | 53 |
| 413 N Cedro St | 0.50mi | 2/1.0 | 704 (-3%) | 22mo | $95,000 | $135 | 53 |
| 211 W Llano Grande St | 0.37mi | 2/2.0 | 828 (+14%) | 14mo | $149,000 | $180 | 44 |
| 404 E Esplanada St | 0.42mi | 2/1.0 | 640 (-12%) | 21mo | $45,000 | $70 | 42 |
Match score weights: distance 35% · size 25% · config 20% · recency 20%. Top-matched comps best support the ARV.
Projected returns pro-forma
-0.58% appreciation · 3.0% rent growth · sell at horizon
- IRR
- 3.4%
- Equity multiple
- 1.16×
- Total profit
- $2,638
- Equity at exit
- $15,690
- IRR
- 9.5%
- Equity multiple
- 1.97×
- Total profit
- $16,263
- Equity at exit
- $17,528
Cash invested: $16,800 (down + closing). Projections, not guarantees.
Landlord ↔ Tenant lean methodology
- Overall (STATE)
- 87 Strongly Landlord-Friendly
- State Texas
- 87 Strongly Landlord-Friendly · R+5
- County
- — inherits STATE
- City
- — inherits STATE
ZIP-level market 78596
- Home prices YoY
- -0.2%
- Active inventory
- 708
- Price-to-rent
- 7.0×
Monthly cashflow live
- Estimated rent
- $719 high interval (Pro) →
- Mortgage (P&I)
- −$315
- Tax from tax record
- −$135 /mo · $1,615/yr
- Insurance
- −$25
- HOA
- −$0
- Vacancy / Maint / Mgmt
- −$151
- Net cashflow
- $94
Break-even live
UW: 25.0% down · 7.5% · 30yr · 1.5% tax · 5.0% vac · 8.0% maint · 8.0% mgmt
Financing live
Cash to close
- Down payment
- $15,000
- Closing costs
- $1,800
- Reserves months
- —
- Total cash needed
- —
Loan-product check · same deal, 3 products live
Conventional
25% down · 7.5% · 30yr
- Down + closing
- —
- Monthly P&I
- —
- Monthly cashflow
- —
- DSCR
- —
- Eligible?
- —
Personal DTI + credit; lowest rate.
DSCR
20% down · 8.5% · 30yr
- Down + closing
- —
- Monthly P&I
- —
- Monthly cashflow
- —
- DSCR
- —
- Eligible?
- —
No personal income docs; deal must DSCR.
Hard money
10% down · 12.0% · 12mo
- Down + closing
- —
- Monthly P&I
- —
- Monthly cashflow
- —
- DSCR
- —
- Eligible?
- —
Short-term bridge; refi at stabilization.
Rent comps 11 comps
| Address | Beds | Baths | Sqft | Rent | $/sqft | DOM | Units | Dist |
|---|---|---|---|---|---|---|---|---|
| 301 E 4th St Unit 5 Weslaco, TX | 1.0 | 1.0 | 700 | $670 | $0.96 | 43d | 1 | 0.29mi |
| 518 N Cantu St Weslaco, TX | 2.0 | 1.0 | 648 | $900 | $1.39 | 44d | 1 | 0.36mi |
| 705 E 6th St Unit 21 Weslaco, TX | 1.0 | 1.0 | 700 | $595 | $0.85 | 43d | 1 | 0.42mi |
| 705 E 6th St Apt 4 Weslaco, TX | 1.0 | 1.0 | 700 | $695 | $0.99 | 43d | 1 | 0.42mi |
| 610 S Hospital Dr Unit A9 Weslaco, TX | 1.0 | 1.0 | 600 | $795 | $1.32 | 43d | 1 | 0.67mi |
| 1601 S Airport Dr Unit 231 Weslaco, TX | 1.0 | 1.0 | 385 | $1,200 | $3.12 | 43d | 1 | 1.04mi |
| 1409 W Business 83 Unit 00 722 Weslaco, TX | 1.0 | 1.0 | 550 | $855 | $1.55 | 43d | 1 | 1.07mi |
| 222 S Westgate Dr Weslaco, TX | 1.0 | 1.0 | 700 | $680 | $0.97 | 44d | 1 | 1.32mi |
| 222 S Westgate Dr Weslaco, TX | 1.0 | 1.0 | 650 | $670 | $1.03 | 43d | 1 | 1.32mi |
| 222 S Westgate Dr Apt 6 Weslaco, TX | 1.0 | 1.0 | 700 | $680 | $0.97 | 43d | 1 | 1.32mi |
| 1006 Lilia Dr Weslaco, TX | 1.0 | 1.0 | 720 | $650 | $0.90 | 43d | 1 | 1.39mi |
Listing history 14 events
-
2026-06-16days on market $60,000 Active 18 DOM
-
2026-06-15days on market $60,000 Active 17 DOM
-
2026-06-15days on market $60,000 Active 16 DOM
-
2026-06-13days on market $60,000 Active 15 DOM
-
2026-06-12days on market $60,000 Active 14 DOM
-
2026-06-09days on market $60,000 Active 11 DOM
-
2026-06-08days on market $60,000 Active 10 DOM
-
2026-06-08days on market $60,000 Active 9 DOM
-
2026-06-07days on market $60,000 Active 8 DOM
-
2026-06-03pricedays on market $60,000 Active 5 DOM
-
2026-06-02days on market $70,000 Active 4 DOM
-
2026-06-01days on market $70,000 Active 3 DOM
-
2026-05-31days on market $70,000 Active 2 DOM
-
2026-05-29$70,000 Active
ⓘ Source: listings_history table (triggers on properties + properties_extension) + one-shot
backfill from property_details.listing_events for pre-trigger history.
Tax reassessment forecast TX · Resets to sale price
- Current annual tax
- $1,615 · $135/mo
- Projected year-2 tax
- $1,615 · $135/mo
- Expected delta
- $0/yr ($0/mo · 0.0%)
ⓘ Screening estimate from a state-policy table — verify with the county assessor before closing.
Climate risk First Street
- Flood 6/10 Major FEMA zone X · 70% chance over 30 yrs
- Wildfire 1/10 Low
- Heat 9/10 Extreme 7 d/yr ≥111°F today · 23 d/yr by 30 yrs out
- Wind 8/10 Severe 99% chance of damaging wind over 30 yrs
- Air quality 1/10 Low 0 unhealthy d/yr today · 0 by 30 yrs out
Nearby sold comps map
Loading sold comps map…
Walkable amenities ~0.75 mi
Loading nearby amenities…
Taxation est. · year 1
- Rental income
- $8,628
- − Mortgage interest
- −$3,361
- − Property taxes
- −$1,615
- − Insurance
- −$300
- − Repairs & maintenance
- −$690
- − Management
- −$690
- − Depreciation
- −$1,745
- Taxable income
- $226
- Est. tax owed @ 24.0%
- −$54
- After-tax cash flow
- $1,071/yr
For passive investors: Depreciation is non-cash, so a rental often shows a tax loss while cash-flowing — sheltering income. Rental losses are passive: they offset passive income freely, and up to $25,000/yr can offset ordinary (W-2) income if you actively participate and your MAGI is under $100k (phasing out to $0 by $150k); unused losses carry forward. On sale, claimed depreciation is recaptured at up to 25%, and gains may owe capital-gains tax (a 1031 exchange can defer both). Figures are a year-1 estimate at your 24.0% rate — not tax advice; consult a CPA.
Schools (NCES district)
- District
- Weslaco ISD
- NCES district ID
- 4844960
- Math proficiency
- 23% ▼ -29.00%
- Reading proficiency
- 31% ▼ -9.00%
- Median HH income
- $32,867
- Composite
- 22.05/100
- National rank
- #8196
- State rank
- #705 of 826 in TX
Livability — Weslaco
- Score
- 72/100
- State rank
- #277
- US rank
- #6469
Category grades
Schools grade is shown separately in the Schools card above.
Census & demographics
- Census place
- Weslaco, TX
- Population (ZIP)
- 38,942
Population outlook (Hidalgo County) Hauer SSP2
- Today (2025)
- 955,232 people
- By 2030
- 1,009,774 · +5.7%
- By 2040
- 1,120,332 · +17.3%
- By 2050
- 1,225,036 · +28.2%
- By 2075
- 1,439,189 · +50.7%
- By 2100
- 1,533,429 · +60.5%
Race, ethnicity, and origin ACS 2023
- Neighborhood character
- Predominantly Hispanic (86%)
- Race & ethnicity
- Hispanic / Latino 86% Two or more races 38% White 13%
- Hispanic origin (detail)
- Mexican 82%
- Common ancestry
- Slovak 1%
- Foreign-born
- 17% · Canada
- Languages at home
- 27% English-only · Spanish 72%
Political lean MEDSL · Hidalgo
- 2024 margin
- Toss-up / Even · D 48.1% · R 51.0%
- 2008→2024 swing
- -41.6pp toward R · 2008: 38.7pp · 2024: -2.9pp
- All cycles
- 2024: R+2.9 2020: D+17.1 2016: D+40.5 2012: D+41.8 2008: D+38.7
Not yet ingested
- Civics
- —
Market trends
- HPI YoY
- ▼ -0.58%
- Current HPI
- 261.5117
- Rent YoY
- —
- Metro
- —
- State GDP YoY
- ▲ 3.95%
- F500 in state
- 110
Industry mix (Fortune 500 HQ in TX)
| Industry | F500 HQs | Revenue |
|---|---|---|
| Energy | 16 | $1,198B |
|
||
| Technology | 5 | $198B |
|
||
| Engineering / Construction | 4 | $72B |
|
||
| Energy Services | 3 | $60B |
|
||
| Utilities | 3 | $41B |
|
||
| Healthcare | 2 | $330B |
|
||
Price history
1 event — show timeline
- 2026-05-29 Listed $70,000 MCALLENMLS
Property tax history
+8.8%/yrLatest (2025): $1,615 · +0.7% YoY. Source: county tax records.
Cash-flow waterfall
monthlySold comps — $/sqft
last 12 mo · ≤1 miLoading sold comps…