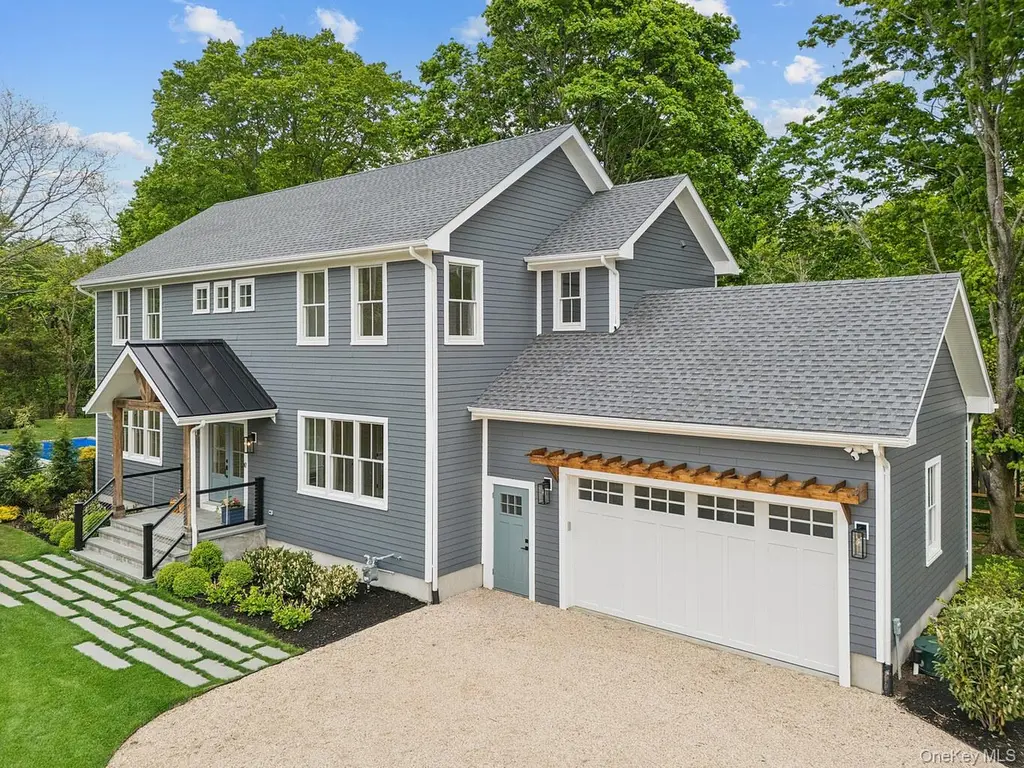
480 Ackerly Pond Ln · Southold, NY
Flood risk 1/10 · Minimal
- FEMA flood zone
- X (unshaded)
- Chance of flooding over 30 yrs
- 0.0%
- Est. flood insurance / yr
- $507 – $1,088
Fire risk 1/10 · Minimal
- Est. fire insurance / yr
- $691 – $1,283
Heat risk 5/10 · Moderate
- Hot days now (above 90°F)
- 7 days/yr
- Hot days in 30 yrs
- 19 days/yr
Wind risk 8/10 · Major
- Chance of severe wind over 30 yrs
- 80.0%
Air-quality risk 3/10 · Minor
- Unhealthy air days now
- 3 days/yr
- Unhealthy air days in 30 yrs
- 4 days/yr
Risk factors via First Street. Map © Google.
Why this score? — see what drove the C grade
The composite is a weighted blend of 9 inputs, each scored 0–100. Each bar is that input's sub-score; the figure is the points it added to the 100-point composite (weight × sub-score).
- Cash flow +27.3/30.0
- DSCR +9.5/10.0
- 1% rule +7.4/10.0
- Schools +4.8/10.0
- Livability +3.4/5.0
- Rent growth +2.5/5.0
- Condition / age +2.5/5.0
- ARV discount +0.0/15.0
- Appreciation +0.0/10.0
$1,749,000
🖨 Deal sheet 📄 Offer letter ✓ Due diligence
Listing remarks
Effortless luxury living meets the best of every day life on the North Fork! Thoughtfully designed with modern elegance and timeless appeal, this bespoke home is privately set while offering seamless access to Southold Town beaches, local vineyards, breweries, marinas, and acclaimed North Fork dining. One of the most exceptional features of this property is its unmatched privacy—backing protected land and over 7 acres of agriculturally zoned property, ensuring a serene and secluded setting that will remain preserved for years to come. From the moment you enter, the home makes a lasting impression. A covered front porch welcomes you into a light-filled foyer with shiplap accents and 9-
Key facts
- 0.7 acre lot
- 2 garage spots
- Pool
Property features AI
Exterior
- Pool: Private in-ground outdoor pool with electric heat
- Parking: Attached covered garage with garage door opener; 2 garage spaces; Driveway parking for additional vehicles; Private parking (4 total spaces)
- Security: Smoke detectors
- Utilities: Electricity connected (PSEG); Natural gas connected; Water connected; Sewer connected; property uses a septic tank; Trash collection (private)
- Home design: Single-family residence; New construction condition; Three or more levels; Basement with finished space and walk-out access; Basement includes Bilco doors, storage and full finished area; Attic with pull-down stairs, storage, unfinished space
- Construction: HardiPlank-type siding; Foam insulation; Concrete perimeter foundation; Built/2016–2026 (new construction listed as actual condition)
- Exterior features: Private landscaped yard with front and back yards; Garden; Rain gutters; Level lot; Near shops; Secluded setting; Stone/brick wall; Wooded areas; Wood fencing in front yard
Interior
- Kitchen: Chef's kitchen with kitchen island and pantry; Convection oven; Gas oven and gas range; Oven; Microwave; Dishwasher; Refrigerator; Stainless steel appliances
- Bedrooms: Multiple bedrooms including a first-floor bedroom; master suite on main level
- Flooring: Hardwood floors; Reclaimed wood accents; Wood flooring
- Bathrooms: 5 full bathrooms; 1 half bathroom; Primary bathroom with double vanity
- Heating & cooling: Central air; Zoned cooling; Forced air heating; Radiant heating; Smart thermostat
- Interior features: First-floor bedroom; First-floor full bathroom; Built-in features; Chef's kitchen; Double vanity; Eat-in kitchen; Entrance foyer; High ceilings; Kitchen island; Primary bathroom; Master suite on main level; Natural woodwork; Open floor plan; Open kitchen; Pantry; Recessed lighting; Smart thermostat; Storage; Walk-in closet(s); Washer/dryer hookup; Wet bar; Covered porch; Deck; Porch; New windows; Oversized windows
- Laundry & utility: Laundry room with washer and dryer; Washer; Dryer; Washer/dryer hookup
Neighborhood map
What this means for you Summary
Snapshot
- This is a 5-bed/5.5-bath land listed at $1.75M.
Deal economics
- At list price, monthly cash flow is $5k ($61k/yr) — positive.
- The deal already cash-flows at list — no discount required.
- Meets the 1% rule at list price ($22k rent vs $1.75M).
- Recommended offer: $1.72M (1.5% below list) — sets the bar for market timing.
- Cap rate 9.8% vs local median 6.9% in Southold — top-decile yield for the area; either an underpriced asset or a hidden risk that comps aren't pricing in. Stress-test before assuming the spread holds.
Location & tenants
- Location reads 67/100 on livability (#583 in NY) — a middle-class / working-renter tenant base. Strengths: crime A+, employment A+, health & safety B+; Watch: amenities F, commute F, cost of living F.
- Southold Union Free School District (town): math 46% / reading 59% proficiency, ranked #298 of 590 in NY (top 50%) — acceptable for families but not a draw, mixed tenant base, ~2y average lease; only 17% free/reduced lunch — higher-income household profile.
- Zoned schools: Southold Elementary School (math 37% / reading 62%, grade D, #1,085 of 2,108 statewide, top 56%, 317 students, 35% FRL); Southold Junior-Senior High School (math 52% / reading 52%, grade D+, #946 of 1,100 statewide, top 88%, 380 students, 40% FRL) — zoned schools average 38% FRL vs 17% district-wide (21 pts higher); higher-poverty schools than district average — tighter screening recommended.
- Market conditions: 79 active listings in the ZIP; 6 comparable units currently listed for rent nearby; rentals lingering (median 44d on market — plan ~5-8 weeks vacancy on turnover, expect pricing pressure); 83% of comp listings sitting > 30 days — soft ceiling on asking rent; 1,366 units permitted in Suffolk County in 2024 (216 in 5+ unit buildings).
Forward outlook
- Local home prices are declining (-3.0%/yr); year-one equity from $12k of loan paydown is wiped out by about $52k of value loss. Plan a longer hold.
- Suffolk County population projected to shrink 5% by 2050 — rents likely to lag national; underwrite the cash flow, not the appreciation.
- At projected returns (-3.0% appreciation + 3.0% rent growth), your $490k cash investment doubles in ~10 years — after that, you're playing with house money.
Negotiation context
- It's been on market 26 days — a 2% lower offer ($1.72M) is reasonable based on typical stale-listing flexibility.
- 8 sale attempts since 12y ago with the ask held roughly flat each time — persistent listings suggest the price (not the market) is what's stuck; bring a comps-based counter.
- Current owner paid $145k; list at $1.75M implies a 1106% gain — meaningful room to come down on a strong offer.
Risks & watch-outs
- Climate carrying-cost: severe wind risk, 80% chance of damaging wind over 30y; extreme-heat days projected 7→19/yr by 2055 (HVAC capex compounding) — expect insurance premiums to compound above CPI over the hold.
Questions for the listing agent
- Is there a deadline driving the sale (1031 exchange, divorce, estate, relocation)? That informs how much negotiation room exists.
- Schools are A-rated — typically a magnet for longer-tenancy family renters. What's the average tenant stay here, and is there a school-zone premium baked into asking?
- What's the average days-on-market for RENTAL listings here right now (not sales)? A rising rental-DOM trend means longer vacancies and softer asking-rent achievability than the comps imply.
- What's the recent tenant-quality profile in this submarket — average credit score on applications, eviction rate, late-payment / NSF rate, and stable-employment percentage? A property-management company in the area should have these aggregated.
- How much new for-sale + rental construction is in the pipeline within 1–3 miles? Heavy new supply typically softens prices + rents 12–24 months out; constrained supply supports both.
Investment metrics
- 1% rule
- 1.24% ✓
- Cap rate
- 9.77%
- Cash-on-cash
- 12.41%
- DSCR
- 1.55
- GRM
- 6.7
CMA / ARV
- ARV (median comp)
- $1,384,912
- List price
- $1,749,000
- Delta
- 26.29%
- Verdict
- OVERPRICED
- Comps
- 16 within 1.0 mi
Projected returns pro-forma
-3.0% appreciation · 3.0% rent growth · sell at horizon
- IRR
- 2.1%
- Equity multiple
- 1.08×
- Total profit
- $39,394
- Equity at exit
- $260,782
- IRR
- 11.7%
- Equity multiple
- 1.92×
- Total profit
- $450,878
- Equity at exit
- $151,222
Cash invested: $489,720 (down + closing). Projections, not guarantees.
Landlord ↔ Tenant lean methodology
- Overall (STATE)
- 15 Strongly Tenant-Friendly
- State New York
- 15 Strongly Tenant-Friendly · D+10
- County
- — inherits STATE
- City
- — inherits STATE
ZIP-level market 11971
- Home prices YoY
- -15.8%
- Active inventory
- 79
- Price-to-rent
- 6.7×
Monthly cashflow live
- Estimated rent
- $21,709 medium interval (Pro) →
- Mortgage (P&I)
- −$9,172
- Tax est. 1.5%
- −$2,186 /mo · $26,235/yr
- Insurance
- −$729
- HOA
- −$0
- Vacancy / Maint / Mgmt
- −$4,559
- Net cashflow
- $5,063
Break-even live
UW: 25.0% down · 7.5% · 30yr · 1.5% tax · 5.0% vac · 8.0% maint · 8.0% mgmt
Financing live
Cash to close
- Down payment
- $437,250
- Closing costs
- $52,470
- Reserves months
- —
- Total cash needed
- —
Loan-product check · same deal, 3 products live
Conventional
25% down · 7.5% · 30yr
- Down + closing
- —
- Monthly P&I
- —
- Monthly cashflow
- —
- DSCR
- —
- Eligible?
- —
Personal DTI + credit; lowest rate.
DSCR
20% down · 8.5% · 30yr
- Down + closing
- —
- Monthly P&I
- —
- Monthly cashflow
- —
- DSCR
- —
- Eligible?
- —
No personal income docs; deal must DSCR.
Hard money
10% down · 12.0% · 12mo
- Down + closing
- —
- Monthly P&I
- —
- Monthly cashflow
- —
- DSCR
- —
- Eligible?
- —
Short-term bridge; refi at stabilization.
Rent comps 6 comps
| Address | Beds | Baths | Sqft | Rent | $/sqft | DOM | Units | Dist |
|---|---|---|---|---|---|---|---|---|
| 110 Sleepy Hollow Ln Southold, NY | 4.0 | 3.0 | 2900 | $25,000 | $8.62 | 43d | 1 | 0.51mi |
| 6710 Soundview Ave Southold, NY | 4.0 | 2.0 | 2000 | $4,900 | $2.45 | 43d | 1 | 1.07mi |
| 1160 Goose Creek Ln Southold, NY | 5.0 | 3.0 | 2000 | $50,000 | $25.00 | 43d | 1 | 1.18mi |
| 3400 Youngs Ave Southold, NY | 4.0 | 2.0 | 2000 | $7,500 | $3.75 | 43d | 1 | 1.19mi |
| 270 N Sea Dr Southold, NY | 4.0 | 3.0 | 1800 | $22,500 | $12.50 | 43d | 1 | 1.47mi |
| 215 Northfield Ln Southold, NY | 4.0 | 3.0 | 2300 | $13,000 | $5.65 | 18d | 1 | 1.48mi |
Listing history 18 events
-
2026-05-31statusdays on market $1,749,000 Pending 26 DOM
-
2026-05-06$1,749,000 Active 2763-char remark
-
2026-04-27historical $1,749,000 2763-char remark
-
2025-11-16$1,799,000 Active
-
2025-10-05historical
-
2025-07-23price $1,899,000
-
2025-05-18$1,950,000 Active
-
2021-02-02historical
-
2020-02-07$275,000 New
-
2019-11-25historical
-
2019-05-24$219,000 New
-
2017-10-24historical
-
2017-04-23$219,000 Listing Extended
-
2017-04-10historical
-
2016-04-11$219,000 New
-
2015-09-15historical
-
2014-09-16$219,500
-
2004-10-15soldstatus $145,000
ⓘ Source: listings_history table (triggers on properties + properties_extension) + one-shot
backfill from property_details.listing_events for pre-trigger history.
Climate risk First Street
- Flood 1/10 Low FEMA zone X (unshaded) · 0% chance over 30 yrs
- Wildfire 1/10 Low
- Heat 5/10 Major 7 d/yr ≥90°F today · 19 d/yr by 30 yrs out
- Wind 8/10 Severe 80% chance of damaging wind over 30 yrs
- Air quality 3/10 Moderate 3 unhealthy d/yr today · 4 by 30 yrs out
Nearby sold comps map
Loading sold comps map…
Walkable amenities ~0.75 mi
Loading nearby amenities…
Taxation est. · year 1
- Rental income
- $260,509
- − Mortgage interest
- −$97,971
- − Property taxes
- −$26,235
- − Insurance
- −$8,745
- − Repairs & maintenance
- −$20,841
- − Management
- −$20,841
- − Depreciation
- −$50,880
- Taxable income
- $34,996
- Est. tax owed @ 24.0%
- −$8,399
- After-tax cash flow
- $52,360/yr
For passive investors: Depreciation is non-cash, so a rental often shows a tax loss while cash-flowing — sheltering income. Rental losses are passive: they offset passive income freely, and up to $25,000/yr can offset ordinary (W-2) income if you actively participate and your MAGI is under $100k (phasing out to $0 by $150k); unused losses carry forward. On sale, claimed depreciation is recaptured at up to 25%, and gains may owe capital-gains tax (a 1031 exchange can defer both). Figures are a year-1 estimate at your 24.0% rate — not tax advice; consult a CPA.
Schools (NCES district)
- District
- Southold Union Free School District
- NCES district ID
- 3627620
- Math proficiency
- 46% ▼ -10.00%
- Reading proficiency
- 59% ▲ 6.00%
- Median HH income
- $78,622
- Composite
- 47.54/100
- National rank
- #2269
- State rank
- #298 of 590 in NY
Livability — Southold
- Score
- 67/100
- State rank
- #583
- US rank
- #10545
Category grades
Schools grade is shown separately in the Schools card above.
Census & demographics
- Census place
- Southold, NY
- City population
- 6,507
- Population (ZIP)
- 6,507
Population outlook (Suffolk County) Hauer SSP2
- Today (2025)
- 1,505,262 people
- By 2030
- 1,498,318 · -0.5%
- By 2040
- 1,471,101 · -2.3%
- By 2050
- 1,424,848 · -5.3%
- By 2075
- 1,337,157 · -11.2%
- By 2100
- 1,217,720 · -19.1%
Race, ethnicity, and origin ACS 2023
- Neighborhood character
- Predominantly White (78%)
- Race & ethnicity
- White 78% Hispanic / Latino 14% Two or more races 5% Asian 4%
- Hispanic origin (detail)
- Mexican 3% Puerto Rican 1% Dominican 3%
- Common ancestry
- Romanian 6% Italian 2% Slovak 2%
- Foreign-born
- 14% · Canada, China, Dominican Republic
- Languages at home
- 83% English-only · Spanish 11% Russian/Polish/Slavic 2% Other Indo-European 2%
Political lean MEDSL · Suffolk
- 2024 margin
- Lean R (+10.0) · D 45.0% · R 55.0%
- 2008→2024 swing
- -16.0pp toward R · 2008: 6.0pp · 2024: -10.0pp
- All cycles
- 2024: R+10.0 2020: R+0.0 2016: R+8.2 2012: D+2.9 2008: D+6.0
Not yet ingested
- Civics
- —
Market trends
- HPI YoY
- ▼ -74.14%
- Current HPI
- 396.5481
- Rent YoY
- —
- Metro
- —
- State GDP YoY
- ▲ 2.60%
- F500 in state
- 92
Industry mix (Fortune 500 HQ in NY)
| Industry | F500 HQs | Revenue |
|---|---|---|
| Financial Services | 10 | $950B |
|
||
| Consumer Goods | 9 | $162B |
|
||
| Insurance | 4 | $225B |
|
||
| Telecommunications | 2 | $144B |
|
||
| Pharmaceuticals | 2 | $112B |
|
||
| Media / Entertainment | 2 | $69B |
|
||
Price history
+1106.2% since first listed18 events — show timeline
- 2026-05-31 Pending — OneKey® MLS as Distributed by MLS Grid
- 2026-05-06 Listed $1,749,000 OneKey® MLS as Distributed by MLS Grid
- 2026-04-27 Coming Soon $1,749,000 OneKey® MLS as Distributed by MLS Grid
- 2025-11-16 Listed $1,799,000 OneKey® MLS as Distributed by MLS Grid
- 2025-10-05 Listing Removed — OneKey® MLS as Distributed by MLS Grid
- 2025-07-23 Price Changed $1,899,000 OneKey® MLS as Distributed by MLS Grid
- 2025-05-18 Listed $1,950,000 OneKey® MLS as Distributed by MLS Grid
- 2021-02-02 Listing Removed — OneKey® MLS as Distributed by MLS Grid
- 2020-02-07 Listed $275,000 OneKey® MLS as Distributed by MLS Grid
- 2019-11-25 Listing Removed — OneKey® MLS as Distributed by MLS Grid
- 2019-05-24 Listed $219,000 OneKey® MLS as Distributed by MLS Grid
- 2017-10-24 Listing Removed — OneKey® MLS as Distributed by MLS Grid
- 2017-04-23 Listed $219,000 OneKey® MLS as Distributed by MLS Grid
- 2017-04-10 Listing Removed — OneKey® MLS as Distributed by MLS Grid
- 2016-04-11 Listed $219,000 OneKey® MLS as Distributed by MLS Grid
- 2015-09-15 Listing Removed — OneKey® MLS as Distributed by MLS Grid
- 2014-09-16 Listed $219,500 OneKey® MLS as Distributed by MLS Grid
- 2004-10-15 Sold (Public Records) $145,000 Public Records
Property tax history
+2.3%/yrLatest (2025): $1,075 · +0.0% YoY. Source: county tax records.
Cash-flow waterfall
monthlySold comps — $/sqft
last 12 mo · ≤1 miLoading sold comps…