38740 N Anderle Ave · Lindenhurst, IL
Flood risk 1/10 · Minimal
- FEMA flood zone
- X (unshaded)
- Chance of flooding over 30 yrs
- 0.0%
- Est. flood insurance / yr
- $473 – $860
Fire risk 3/10 · Minor
- Est. fire insurance / yr
- $804 – $1,492
Heat risk 2/10 · Minimal
- Hot days now (above 100°F)
- 7 days/yr
- Hot days in 30 yrs
- 14 days/yr
Wind risk 2/10 · Minimal
- Chance of severe wind over 30 yrs
- —
Air-quality risk 3/10 · Minor
- Unhealthy air days now
- 3 days/yr
- Unhealthy air days in 30 yrs
- 3 days/yr
Risk factors via First Street. Map © Google.
Why this score? — see what drove the B+ grade
The composite is a weighted blend of 9 inputs, each scored 0–100. Each bar is that input's sub-score; the figure is the points it added to the 100-point composite (weight × sub-score).
- Cash flow +30.0/30.0
- ARV discount +15.0/15.0
- 1% rule +10.0/10.0
- DSCR +10.0/10.0
- Livability +3.9/5.0
- Schools +3.6/10.0
- Rent growth +2.5/5.0
- Condition / age +2.5/5.0
- Appreciation +0.0/10.0
$160,000
🖨 Deal sheet (PDF) 📄 Offer letter ✓ Due diligence
Listing remarks MLS
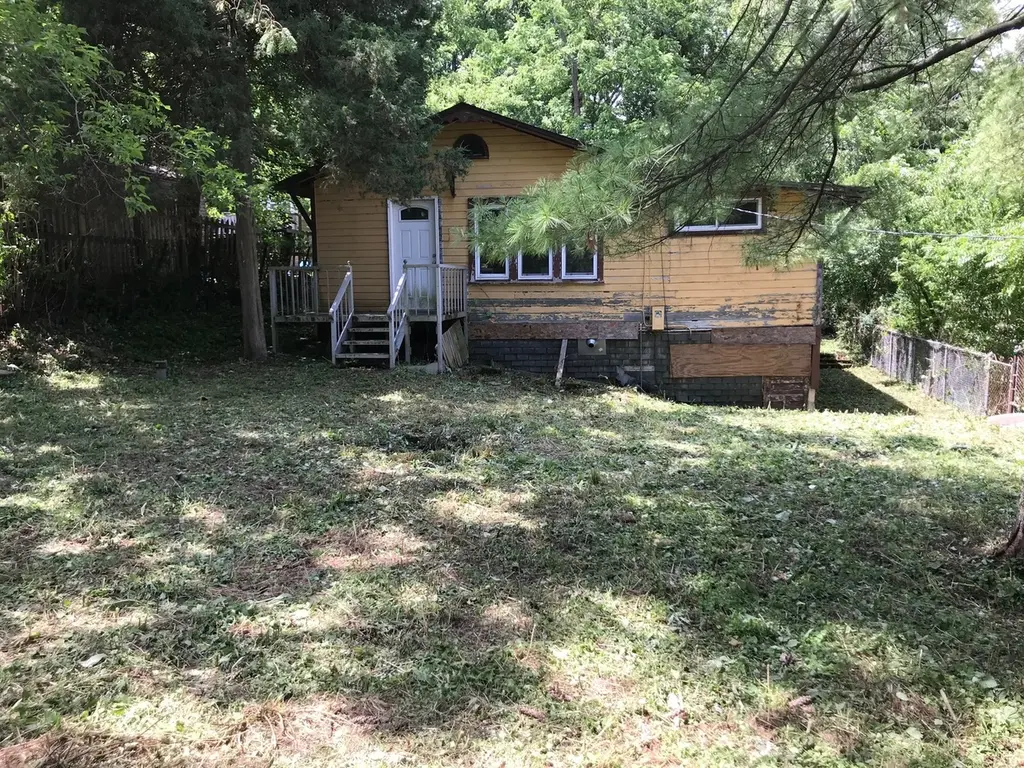
Build your retreat by the lake. Tons of potential on this 50x125 lot; Northern exposure offers unobstructed view of Crooked Lake. Mature trees on the property. Quiet and private. Minutes from shopping and area restaurants. Drive by only. Sold AS IS.
Key facts
- Unobstructed view
- Northern exposure
- Quiet and private
Tags
Neighborhood map
What this means for you Summary
Snapshot
- This is a 3-bed/1.0-bath single-family listed at $160k.
Deal economics
- At list price, monthly cash flow is $815 ($10k/yr) — positive.
- The deal already cash-flows at list — no discount required.
- Meets the 1% rule at list price ($2k rent vs $160k).
- Recommended offer: $146k (9.0% below list) — sets the bar for market timing.
- Cap rate 12.4% vs local median 3.8% in Lindenhurst — top-decile yield for the area; either an underpriced asset or a hidden risk that comps aren't pricing in. Stress-test before assuming the spread holds.
Location & tenants
- Location reads 77/100 on livability (#165 in IL, #3,036 nationally) — a middle-class / working-renter tenant base. Strengths: crime A+, employment A+, housing A+; Watch: amenities F, commute F.
- Chsd 117 (suburban): math 36% / reading 40% proficiency, ranked #135 of 620 in IL (top 22%) — families likely to look elsewhere, expect single-tenant / working-renter base with shorter leases.
- Zoned schools: B J Hooper Elem School (585 students, 0% FRL); Peter J Palombi School (math 24% / reading 24%, grade F, #332 of 665 statewide, top 55%, 837 students, 0% FRL); Lakes Community High School (math 40% / reading 43%, grade F, #82 of 693 statewide, top 12%, 1,317 students, 0% FRL).
- Market conditions: 84 active listings in the ZIP; high-income renter base; 948 units permitted in Lake County in 2024 (424 in 5+ unit buildings).
Forward outlook
- Local home prices are declining (-3.0%/yr); year-one equity from $1k of loan paydown is wiped out by about $5k of value loss. Plan a longer hold.
- Lake County population projected to shrink 8% by 2050 — rents likely to lag national; underwrite the cash flow, not the appreciation.
- At projected returns (-3.0% appreciation + 3.0% rent growth), your $45k cash investment doubles in ~6 years — after that, you're playing with house money.
Negotiation context
- It's been on market 103 days — a 9% lower offer ($146k) is reasonable based on typical stale-listing flexibility.
- 9 sale attempts since 8y ago with the ask held roughly flat each time — persistent listings suggest the price (not the market) is what's stuck; bring a comps-based counter.
- Current owner paid $32k; list at $160k implies a 392% gain — meaningful room to come down on a strong offer.
Risks & watch-outs
- Watch-outs: built in 1917 — expect roof / HVAC / electrical / plumbing capex.
Questions for the listing agent
- It's been on market 103 days. Have you received any prior offers? Is the seller open to a 9% concession, seller financing, or rate buy-down credit?
- Built in 1917 — when were the roof, HVAC, electrical panel, plumbing, and water heater last replaced?
- Why hasn't it sold? Are there any deal-killer items the seller is aware of (foundation, flood, title, zoning, code violations)?
- Is there a deadline driving the sale (1031 exchange, divorce, estate, relocation)? That informs how much negotiation room exists.
- Schools are B-rated — typically a magnet for longer-tenancy family renters. What's the average tenant stay here, and is there a school-zone premium baked into asking?
- What's the average days-on-market for RENTAL listings here right now (not sales)? A rising rental-DOM trend means longer vacancies and softer asking-rent achievability than the comps imply.
- What's the recent tenant-quality profile in this submarket — average credit score on applications, eviction rate, late-payment / NSF rate, and stable-employment percentage? A property-management company in the area should have these aggregated.
- How much new for-sale + rental construction is in the pipeline within 1–3 miles? Heavy new supply typically softens prices + rents 12–24 months out; constrained supply supports both.
Investment metrics
- 1% rule
- 1.50% ✓
- Cap rate
- 12.41%
- Cash-on-cash
- 21.83%
- DSCR
- 1.97
- GRM
- 5.6
CMA / ARV
- ARV (median comp)
- $273,052
- List price
- $160,000
- Delta
- -41.40%
- Verdict
- UNDERPRICED
- Comps
- 20 within 1.0 mi
Show comp detail 2 sales within ~0.75 mi
| Address | Dist | Beds/Ba | Sqft | Sold | Price | $/sf | Match |
|---|---|---|---|---|---|---|---|
| 21584 W Lake Ave | 0.35mi | 2/1.0 (-1) | 872 (+10%) | 8mo | $95,000 | $109 | 56 |
| 21701 W Willow St | 0.48mi | 2/1.0 (-1) | 720 (-9%) | 19mo | $172,000 | $239 | 41 |
Match score weights: distance 35% · size 25% · config 20% · recency 20%. Top-matched comps best support the ARV.
Projected returns pro-forma
-3.0% appreciation · 3.0% rent growth · sell at horizon
- IRR
- 14.5%
- Equity multiple
- 1.58×
- Total profit
- $26,009
- Equity at exit
- $23,857
- IRR
- 23.2%
- Equity multiple
- 3.00×
- Total profit
- $89,579
- Equity at exit
- $13,834
Cash invested: $44,800 (down + closing). Projections, not guarantees.
Landlord ↔ Tenant lean methodology
- Overall (STATE)
- 43 Moderately Tenant-Leaning
- State Illinois
- 43 Moderately Tenant-Leaning · D+7
- County
- — inherits STATE
- City
- — inherits STATE
ZIP-level market 60046
- Active inventory
- 84
- Price-to-rent
- 5.6×
Monthly cashflow live
- Estimated rent
- $2,398 medium interval (Pro) →
- Mortgage (P&I)
- −$839
- Tax from tax record
- −$174 /mo · $2,086/yr
- Insurance
- −$67
- HOA
- −$0
- Vacancy / Maint / Mgmt
- −$504
- Net cashflow
- $815
Break-even live
Sensitivity live
| Price | -10% $906 | -5% $860 | +0% $815 | +5% $770 | +10% $725 |
|---|---|---|---|---|---|
| Rent | -10% $626 | -5% $720 | +0% $815 | +5% $910 | +10% $1,005 |
| Rate | -1.0pp $896 | -0.5pp $856 | base $815 | +0.5pp $774 | +1.0pp $731 |
UW: 25.0% down · 7.5% · 30yr · 1.5% tax · 5.0% vac · 8.0% maint · 8.0% mgmt
Financing live
Cash to close
- Down payment
- $40,000
- Closing costs
- $4,800
- Reserves months
- —
- Total cash needed
- —
Loan-product check · same deal, 3 products live
Conventional
25% down · 7.5% · 30yr
- Down + closing
- —
- Monthly P&I
- —
- Monthly cashflow
- —
- DSCR
- —
- Eligible?
- —
Personal DTI + credit; lowest rate.
DSCR
20% down · 8.5% · 30yr
- Down + closing
- —
- Monthly P&I
- —
- Monthly cashflow
- —
- DSCR
- —
- Eligible?
- —
No personal income docs; deal must DSCR.
Hard money
10% down · 12.0% · 12mo
- Down + closing
- —
- Monthly P&I
- —
- Monthly cashflow
- —
- DSCR
- —
- Eligible?
- —
Short-term bridge; refi at stabilization.
Listing history 33 events
-
2026-06-21days on market $160,000 Active 103 DOM
-
2026-06-18days on market $160,000 Active 100 DOM
-
2026-06-17days on market $160,000 Active 99 DOM
-
2026-06-16days on market $160,000 Active 98 DOM
-
2026-06-15days on market $160,000 Active 97 DOM
-
2026-06-13days on market $160,000 Active 95 DOM
-
2026-06-13days on market $160,000 Active 94 DOM
-
2026-06-09days on market $160,000 Active 91 DOM
-
2026-06-08days on market $160,000 Active 90 DOM
-
2026-06-07days on market $160,000 Active 89 DOM
-
2026-06-04days on market $160,000 Active 86 DOM
-
2026-06-03days on market $160,000 Active 85 DOM
-
2026-06-02days on market $160,000 Active 84 DOM
-
2026-06-01days on market $160,000 Active 83 DOM
-
2026-05-31days on market $160,000 Active 82 DOM
-
2026-03-10$160,000 Active 256-char remark
Show marketing remark (256 chars)
Build your retreat by the lake. Tons of potential on this 50x125 lot; Northern exposure offers unobstructed view of Crooked Lake. Mature trees on the property. Quiet and private. Minutes from shopping and area restaurants. Drive by only. Sold AS IS.
-
2018-11-30historical
-
2018-11-30historical
-
2018-10-02New
-
2018-10-02New
-
2018-09-30historical
-
2018-09-30historical
-
2018-07-22New
-
2018-07-22New
-
2018-07-22historical
-
2018-07-22historical
-
2018-07-06New
-
2018-07-06New
-
2018-06-30historical
-
2018-05-31historical
-
2018-04-29New
-
2018-02-25New
-
1996-11-01soldstatus $32,500
ⓘ Source: listings_history table (triggers on properties + properties_extension) + one-shot
backfill from property_details.listing_events for pre-trigger history.
Tax reassessment forecast IL · Partial reset (capped growth)
- Current annual tax
- $2,086 · $174/mo
- Projected year-2 tax
- $2,859 · $238/mo
- Expected delta
- +$773/yr (+$64/mo · 37.1%)
ⓘ Screening estimate from a state-policy table — verify with the county assessor before closing.
Climate risk First Street
- Flood 1/10 Low FEMA zone X (unshaded) · 0% chance over 30 yrs
- Wildfire 3/10 Moderate
- Heat 2/10 Low 7 d/yr ≥100°F today · 14 d/yr by 30 yrs out
- Wind 2/10 Low
- Air quality 3/10 Moderate 3 unhealthy d/yr today · 3 by 30 yrs out
Nearby sold comps map
Loading sold comps map…
Walkable amenities ~0.75 mi
Loading nearby amenities…
Taxation est. · year 1
- Rental income
- $28,780
- − Mortgage interest
- −$8,962
- − Property taxes
- −$2,086
- − Insurance
- −$800
- − Repairs & maintenance
- −$2,302
- − Management
- −$2,302
- − Depreciation
- −$4,655
- Taxable income
- $7,672
- Est. tax owed @ 24.0%
- −$1,841
- After-tax cash flow
- $7,940/yr
For passive investors: Depreciation is non-cash, so a rental often shows a tax loss while cash-flowing — sheltering income. Rental losses are passive: they offset passive income freely, and up to $25,000/yr can offset ordinary (W-2) income if you actively participate and your MAGI is under $100k (phasing out to $0 by $150k); unused losses carry forward. On sale, claimed depreciation is recaptured at up to 25%, and gains may owe capital-gains tax (a 1031 exchange can defer both). Figures are a year-1 estimate at your 24.0% rate — not tax advice; consult a CPA.
Schools (NCES district)
- District
- Chsd 117
- NCES district ID
- 1703870
- Math proficiency
- 36% ▼ -8.00%
- Reading proficiency
- 40% ▼ -4.00%
- Median HH income
- $80,993
- Composite
- 35.79/100
- National rank
- #4836
- State rank
- #135 of 620 in IL
Livability — Lindenhurst
- Score
- 77/100
- State rank
- #165
- US rank
- #3036
Category grades
Schools grade is shown separately in the Schools card above.
Census & demographics
- County
- Lake County · 591,991 people
- City population
- 34,613
- Metro
- Chicago-Naperville-Elgin, IL-IN-WI
- Population (ZIP)
- 34,613
- Household income
- $126,042
- Rent vs Own
- Severe rent burden
- 282.0
Population outlook (Lake County) Hauer SSP2
- Today (2025)
- 700,217 people
- By 2030
- 693,290 · -1.0%
- By 2040
- 673,588 · -3.8%
- By 2050
- 643,556 · -8.1%
- By 2075
- 562,792 · -19.6%
- By 2100
- 457,715 · -34.6%
Race, ethnicity, and origin ACS 2023
- Neighborhood character
- Predominantly White (70%)
- Race & ethnicity
- White 70% Hispanic / Latino 17% Two or more races 9% Asian 6% Black 4%
- Hispanic origin (detail)
- Mexican 12% Puerto Rican 2%
- Common ancestry
- Romanian 13% Portuguese 2% Lithuanian 2%
- Foreign-born
- 13% · Canada, South Korea, Vietnam
- Languages at home
- 80% English-only · Spanish 11% Russian/Polish/Slavic 3% Other Asian/Pacific 1%
Political lean MEDSL · Lake
- 2024 margin
- Strong D (+20.8) · D 59.7% · R 38.9% · Other 1.4%
- 2008→2024 swing
- +1.1pp toward D · 2008: 19.6pp · 2024: 20.8pp
- All cycles
- 2024: D+20.8 2020: D+24.1 2016: D+20.3 2012: D+8.1 2008: D+19.6
Not yet ingested
- Civics
- —
Market trends
- HPI YoY
- ▼ -137.45%
- Current HPI
- 202.1374
- Rent YoY
- —
- Metro
- Chicago-Naperville-Elgin, IL-IN-WI
- State GDP YoY
- ▲ 1.59%
- F500 in state
- 60
Industry mix (Fortune 500 HQ in IL)
| Industry | F500 HQs | Revenue |
|---|---|---|
| Insurance | 4 | $201B |
|
||
| Consumer Goods | 4 | $87B |
|
||
| Industrial Machinery | 3 | $64B |
|
||
| Healthcare | 2 | $55B |
|
||
| Retail / Pharmacy | 1 | $148B |
|
||
| Agriculture / Food | 1 | $86B |
|
||
Price history
+392.3% since first listed18 events — show timeline
- 2026-03-10 Listed $160,000 MRED as Distributed by MLS Grid
- 2018-11-30 Listing Removed — MRED as Distributed by MLS Grid
- 2018-11-30 Listing Removed — MRED as Distributed by MLS Grid
- 2018-10-02 Listed — MRED as Distributed by MLS Grid
- 2018-10-02 Listed — MRED as Distributed by MLS Grid
- 2018-09-30 Listing Removed — MRED as Distributed by MLS Grid
- 2018-09-30 Listing Removed — MRED as Distributed by MLS Grid
- 2018-07-22 Listing Removed — MRED as Distributed by MLS Grid
- 2018-07-22 Listing Removed — MRED as Distributed by MLS Grid
- 2018-07-22 Listed — MRED as Distributed by MLS Grid
- 2018-07-22 Listed — MRED as Distributed by MLS Grid
- 2018-07-06 Listed — MRED as Distributed by MLS Grid
- 2018-07-06 Listed — MRED as Distributed by MLS Grid
- 2018-06-30 Listing Removed — MRED as Distributed by MLS Grid
- 2018-05-31 Listing Removed — MRED as Distributed by MLS Grid
- 2018-04-29 Listed — MRED as Distributed by MLS Grid
- 2018-02-25 Listed — MRED as Distributed by MLS Grid
- 1996-11-01 Sold (Public Records) $32,500 Public Records
Property tax history
+3.9%/yrLatest (2024): $2,086 · +4.2% YoY. Source: county tax records.
Cash-flow waterfall
monthlySold comps — $/sqft
last 12 mo · ≤1 miLoading sold comps…