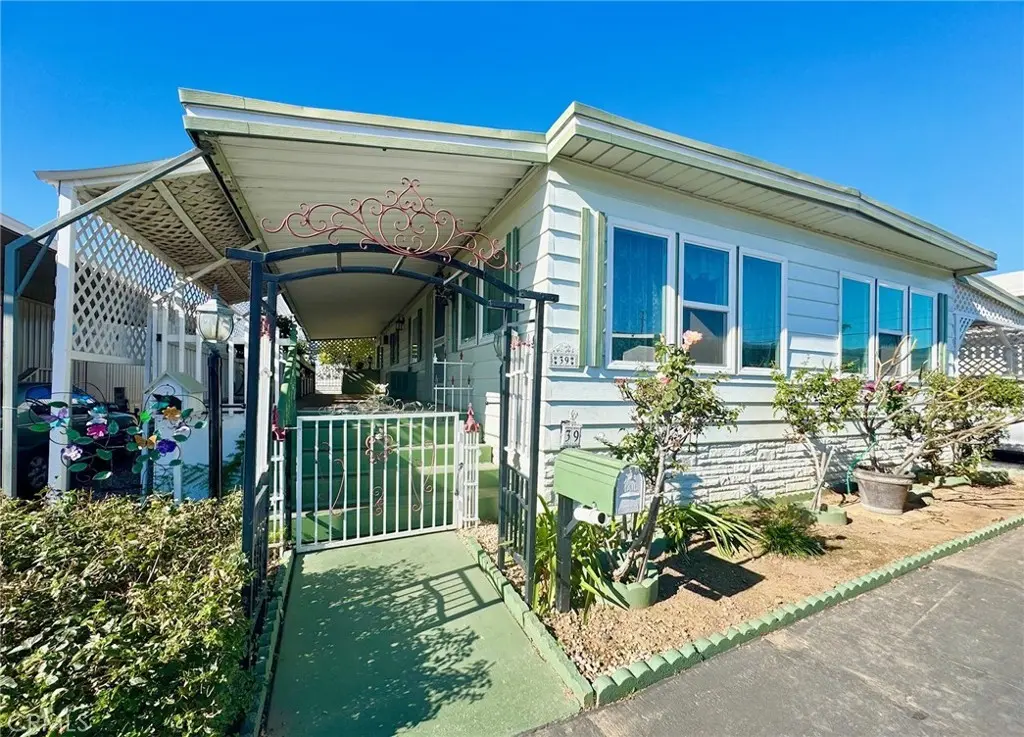
1630 W Covina Blvd #39 · San Dimas, CA
Flood risk 1/10 · Minimal
- FEMA flood zone
- X (unshaded)
- Chance of flooding over 30 yrs
- 0.0%
- Est. flood insurance / yr
- $507 – $1,088
Fire risk 7/10 · Major
- Est. fire insurance / yr
- $659 – $1,223
Heat risk 7/10 · Major
- Hot days now (above 99°F)
- 7 days/yr
- Hot days in 30 yrs
- 20 days/yr
Wind risk 1/10 · Minimal
- Chance of severe wind over 30 yrs
- —
Air-quality risk 8/10 · Major
- Unhealthy air days now
- 17 days/yr
- Unhealthy air days in 30 yrs
- 21 days/yr
Risk factors via First Street. Map © Google.
Why this score? — see what drove the B+ grade
The composite is a weighted blend of 9 inputs, each scored 0–100. Each bar is that input's sub-score; the figure is the points it added to the 100-point composite (weight × sub-score).
- Cash flow +30.0/30.0
- ARV discount +15.0/15.0
- 1% rule +10.0/10.0
- DSCR +10.0/10.0
- Schools +4.7/10.0
- Condition / age +3.8/5.0
- Livability +3.6/5.0
- Rent growth +2.3/5.0
- Appreciation +0.0/10.0
$155,000
🖨 Deal sheet 📄 Offer letter ✓ Due diligence
Listing remarks MLS
JUST REDUCED FOR QUICK SALE! Spacious 2bedroom 2bathroom located in a 55years plus community in the Beautiful City of San Dimas! This home features an open floorplan with upgrades throughout including a remodeled kitchen, updated flooring, new interior paint to name a few. Home features spacious bedrooms and 2 full bathrooms. Exterior has a long size driveway that can accommodate 2 car parking with guest parking nearby. Home features a cute yard with fruit trees and space for your garden needs. Community features a pool and jacuzzi as well as a clubhouse in which the park hosts event for residents all year long. Conveniently located close by shopping, transportation, and entertainment. Seller will consider a space rent credit to reduce space rent for the first year!
Key facts
- 2 parking spots
- Community pool
- Built 1968
Neighborhood map
What this means for you Summary
Snapshot
- This is a 2-bed/2.0-bath manufactured listed at $155k. Condition is rated good.
Deal economics
- At list price, monthly cash flow is $1k ($16k/yr) — positive.
- The deal already cash-flows at list — no discount required.
- Meets the 1% rule at list price ($3k rent vs $155k).
- Recommended offer: $136k (12.0% below list) — sets the bar for market timing.
- Cap rate 16.3% vs local median 2.6% in San Dimas — top-decile yield for the area; either an underpriced asset or a hidden risk that comps aren't pricing in. Stress-test before assuming the spread holds.
Location & tenants
- Location reads 72/100 on livability (#192 in CA) — a middle-class / working-renter tenant base. Strengths: employment A+, commute A, schools B; Watch: cost of living F, health & safety F.
- Charter Oak Unified (suburban): math 45% / reading 55% proficiency, ranked #387 of 1,400 in CA (top 28%) — acceptable for families but not a draw, mixed tenant base, ~2y average lease.
- Market conditions: Rents soft (-1.0%/yr); 85 active listings in the ZIP; 20 comparable units currently listed for rent nearby; rentals at typical pace (median 25d on market — plan ~3-4 weeks tenant-placement turnaround); solid renter incomes; 19,697 units permitted in Los Angeles County in 2024 (9,426 in 5+ unit buildings).
- This rent runs 32% of the median local income ($105k/yr) — at the standard rent-burdened threshold; future hikes will face affordability resistance.
Forward outlook
- Local home prices are declining (-3.0%/yr); year-one equity from $1k of loan paydown is wiped out by about $5k of value loss. Plan a longer hold.
- Los Angeles County population projected at +9% by 2050 — modest demand growth; plan on rents tracking national, not racing it.
- At projected returns (-3.0% appreciation + 0.0% rent growth), your $43k cash investment doubles in ~4 years — after that, you're playing with house money.
Negotiation context
- It's been on market 192 days — a 12% lower offer ($136k) is reasonable based on typical stale-listing flexibility.
Risks & watch-outs
- Climate carrying-cost: major wildfire risk; extreme-heat days projected 7→20/yr by 2055 (HVAC capex compounding) — expect insurance premiums to compound above CPI over the hold.
Questions for the listing agent
- It's been on market 192 days. Have you received any prior offers? Is the seller open to a 12% concession, seller financing, or rate buy-down credit?
- Built in 1968 — when were the roof, HVAC, electrical panel, plumbing, and water heater last replaced?
- Why hasn't it sold? Are there any deal-killer items the seller is aware of (foundation, flood, title, zoning, code violations)?
- Is there a deadline driving the sale (1031 exchange, divorce, estate, relocation)? That informs how much negotiation room exists.
- Schools are B-rated — typically a magnet for longer-tenancy family renters. What's the average tenant stay here, and is there a school-zone premium baked into asking?
- What's the average days-on-market for RENTAL listings here right now (not sales)? A rising rental-DOM trend means longer vacancies and softer asking-rent achievability than the comps imply.
- What's the recent tenant-quality profile in this submarket — average credit score on applications, eviction rate, late-payment / NSF rate, and stable-employment percentage? A property-management company in the area should have these aggregated.
- How much new for-sale + rental construction is in the pipeline within 1–3 miles? Heavy new supply typically softens prices + rents 12–24 months out; constrained supply supports both.
Investment metrics
- 1% rule
- 1.81% ✓
- Cap rate
- 16.35%
- Cash-on-cash
- 35.91%
- DSCR
- 2.60
- GRM
- 4.6
CMA / ARV
- ARV (median comp)
- $213,726
- List price
- $155,000
- Delta
- -27.48%
- Verdict
- UNDERPRICED
- Comps
- 20 within 1.0 mi
Show comp detail 12 sales within ~0.75 mi
| Address | Dist | Beds/Ba | Sqft | Sold | Price | $/sf | Match |
|---|---|---|---|---|---|---|---|
| 1630 W Covina Blvd #11 | 0.00mi | 3/2.0 (+1) | 1,248 (+4%) | 9mo | $180,000 | $144 | 81 |
| 1635 W Covina Blvd #109 | 0.14mi | 3/2.0 (+1) | 1,056 (-12%) | 6mo | $215,642 | $204 | 63 |
| 21210 E Arrow #123 | 0.53mi | 3/2.0 (+1) | 1,180 (-2%) | 8mo | $235,000 | $199 | 61 |
| 21210 E Arrow Hwy #41 | 0.53mi | 3/2.0 (+1) | 1,248 (+4%) | 7mo | $265,000 | $212 | 58 |
| 1205 Cypress St #115 | 0.63mi | 2/2.0 | 1,344 (+12%) | 1mo | $215,000 | $160 | 50 |
| 1245 W Cienega Ave #95 | 0.60mi | 2/2.0 | 1,080 (-10%) | 8mo | $137,500 | $127 | 49 |
| 1205 Cypress St #160 | 0.63mi | 3/2.0 (+1) | 1,120 (-7%) | 10mo | $220,000 | $196 | 46 |
| 21210 E Arrow #105 | 0.53mi | 3/2.0 (+1) | 1,040 (-13%) | 4mo | $165,000 | $159 | 45 |
| 1245 W Cienega Ave #123 | 0.60mi | 2/2.0 | 1,348 (+12%) | 9mo | $275,000 | $204 | 44 |
| 1245 W Cienega Ave #44 | 0.62mi | 2/2.0 | 1,368 (+14%) | 10mo | $132,200 | $97 | 39 |
| 1205 Cypress St #199 | 0.63mi | 3/2.0 (+1) | 1,344 (+12%) | 10mo | $290,000 | $216 | 37 |
| 1245 W Cienega Ave #88 | 0.60mi | 3/2.0 (+1) | 1,375 (+15%) | 10mo | $350,000 | $255 | 35 |
Match score weights: distance 35% · size 25% · config 20% · recency 20%. Top-matched comps best support the ARV.
Projected returns pro-forma
-3.0% appreciation · 0.0% rent growth · sell at horizon
- IRR
- 28.4%
- Equity multiple
- 2.14×
- Total profit
- $49,354
- Equity at exit
- $23,111
- IRR
- 34.1%
- Equity multiple
- 3.71×
- Total profit
- $117,583
- Equity at exit
- $13,402
Cash invested: $43,400 (down + closing). Projections, not guarantees.
Landlord ↔ Tenant lean methodology
- Overall (STATE)
- 18 Strongly Tenant-Friendly
- State California
- 18 Strongly Tenant-Friendly · D+13
- County
- — inherits STATE
- City
- — inherits STATE
ZIP-level market 91773
- Rents YoY
- -1.0%
- Active inventory
- 85
- Price-to-rent
- 4.6×
Monthly cashflow live
- Estimated rent
- $2,798 high interval (Pro) →
- Mortgage (P&I)
- −$813
- Tax from tax record
- −$34 /mo · $411/yr
- Insurance
- −$65
- HOA
- −$0
- Vacancy / Maint / Mgmt
- −$588
- Net cashflow
- $1,299
Break-even live
UW: 25.0% down · 7.5% · 30yr · 1.5% tax · 5.0% vac · 8.0% maint · 8.0% mgmt
Financing live
Cash to close
- Down payment
- $38,750
- Closing costs
- $4,650
- Reserves months
- —
- Total cash needed
- —
Loan-product check · same deal, 3 products live
Conventional
25% down · 7.5% · 30yr
- Down + closing
- —
- Monthly P&I
- —
- Monthly cashflow
- —
- DSCR
- —
- Eligible?
- —
Personal DTI + credit; lowest rate.
DSCR
20% down · 8.5% · 30yr
- Down + closing
- —
- Monthly P&I
- —
- Monthly cashflow
- —
- DSCR
- —
- Eligible?
- —
No personal income docs; deal must DSCR.
Hard money
10% down · 12.0% · 12mo
- Down + closing
- —
- Monthly P&I
- —
- Monthly cashflow
- —
- DSCR
- —
- Eligible?
- —
Short-term bridge; refi at stabilization.
Rent comps 20 comps
| Address | Beds | Baths | Sqft | Rent | $/sqft | DOM | Units | Dist |
|---|---|---|---|---|---|---|---|---|
| 1430 W Badillo St San Dimas, CA | 3.0 | 1.5 | 1200 | $3,000 | $2.50 | 1d | 1 | 0.27mi |
| 1471 Cypress St San Dimas, CA | 2.0 | 2.0 | 1127 | $900 | $0.80 | 7d | 1 | 0.28mi |
| 20983 E Covina Blvd Covina, CA | 2.0 | 2.0 | 962 | $2,500 | $2.60 | 25d | 1 | 0.35mi |
| 1145 N Barston Ave Covina, CA | 2.0 | 1.0 | 836 | $2,300 | $2.75 | 7d | 1 | 0.45mi |
| 220 S Valley Center Ave San Dimas, CA | 2.0 | 1.0 | 1000 | $2,495 | $2.50 | 44d | 1 | 0.51mi |
| 21042 E Arrow Hwy Covina, CA | 1.0–2.0 | 1.0–2.0 | 803 | $2,875 | $3.58 | 1d | 11 | 0.60mi |
| 1189 Strawberry Ln Glendora, CA | 2.0 | 2.5 | 1292 | $2,900 | $2.24 | 44d | 1 | 0.62mi |
| 1746 S Sunflower Ave Unit 10 Glendora, CA | 2.0 | 1.5 | 1100 | $2,400 | $2.18 | 44d | 1 | 0.71mi |
| 1746 S Sunflower Ave Unit 7 Glendora, CA | 2.0 | 2.0 | 1100 | $2,400 | $2.18 | 25d | 1 | 0.71mi |
| 801 Claraday St Glendora, CA | 1.0–2.0 | 1.0–2.0 | 900 | $2,325 | $2.58 | 22d | 6 | 0.83mi |
| 710 Claraday St Glendora, CA | 2.0 | 1.0 | 850 | $2,200 | $2.59 | 7d | 1 | 0.86mi |
| 711 Claraday St Unit A Glendora, CA | 2.0 | 1.0 | 750 | $2,250 | $3.00 | 44d | 1 | 0.89mi |
| 217 Danecroft Ave Unit A San Dimas, CA | 2.0 | 1.0 | 735 | $2,800 | $3.81 | 44d | 1 | 1.00mi |
| 1447 S Valley Center Ave Glendora, CA | 3.0 | 2.0 | 1345 | $3,500 | $2.60 | 1d | 1 | 1.00mi |
| 20254 E Arrow Hwy Unit B Covina, CA | 3.0 | 2.5 | 1477 | $3,100 | $2.10 | 25d | 1 | 1.10mi |
| 559 E Juanita Ave Glendora, CA | 3.0 | 3.0 | 1000 | $4,500 | $4.50 | 1d | 1 | 1.11mi |
| 20240 E Arrow Hwy Unit D Covina, CA | 3.0 | 2.5 | 1477 | $3,350 | $2.27 | 44d | 1 | 1.11mi |
| 1061 N Glendora Ave Covina, CA | 2.0 | 2.0 | 1212 | $2,850 | $2.35 | 44d | 1 | 1.35mi |
| 1632 S Glendora Ave Glendora, CA | 3.0 | 2.0 | 1000 | $3,200 | $3.20 | 6d | 1 | 1.49mi |
| 1620 S Glendora Ave Glendora, CA | 3.0 | 2.0 | 1450 | $3,500 | $2.41 | 6d | 1 | 1.49mi |
Listing history 17 events
-
2026-06-18days on market $155,000 Active 192 DOM
-
2026-06-17days on market $155,000 Active 191 DOM
-
2026-06-16days on market $155,000 Active 190 DOM
-
2026-06-15days on market $155,000 Active 189 DOM
-
2026-06-13days on market $155,000 Active 187 DOM
-
2026-06-13days on market $155,000 Active 186 DOM
-
2026-06-09days on market $155,000 Active 183 DOM
-
2026-06-08days on market $155,000 Active 182 DOM
-
2026-06-07days on market $155,000 Active 181 DOM
-
2026-06-04days on market $155,000 Active 178 DOM
-
2026-06-03days on market $155,000 Active 177 DOM
-
2026-06-02days on market $155,000 Active 176 DOM
-
2026-06-01days on market $155,000 Active 175 DOM
-
2026-05-31days on market $155,000 Active 174 DOM
-
2026-05-12price $155,000 776-char remark
Show marketing remark (776 chars)
JUST REDUCED FOR QUICK SALE! Spacious 2bedroom 2bathroom located in a 55years plus community in the Beautiful City of San Dimas! This home features an open floorplan with upgrades throughout including a remodeled kitchen, updated flooring, new interior paint to name a few. Home features spacious bedrooms and 2 full bathrooms. Exterior has a long size driveway that can accommodate 2 car parking with guest parking nearby. Home features a cute yard with fruit trees and space for your garden needs. Community features a pool and jacuzzi as well as a clubhouse in which the park hosts event for residents all year long. Conveniently located close by shopping, transportation, and entertainment. Seller will consider a space rent credit to reduce space rent for the first year!
-
2026-02-19price $157,000 776-char remark
Show marketing remark (776 chars)
JUST REDUCED FOR QUICK SALE! Spacious 2bedroom 2bathroom located in a 55years plus community in the Beautiful City of San Dimas! This home features an open floorplan with upgrades throughout including a remodeled kitchen, updated flooring, new interior paint to name a few. Home features spacious bedrooms and 2 full bathrooms. Exterior has a long size driveway that can accommodate 2 car parking with guest parking nearby. Home features a cute yard with fruit trees and space for your garden needs. Community features a pool and jacuzzi as well as a clubhouse in which the park hosts event for residents all year long. Conveniently located close by shopping, transportation, and entertainment. Seller will consider a space rent credit to reduce space rent for the first year!
-
2025-12-08$159,000 Active 776-char remark
Show marketing remark (776 chars)
JUST REDUCED FOR QUICK SALE! Spacious 2bedroom 2bathroom located in a 55years plus community in the Beautiful City of San Dimas! This home features an open floorplan with upgrades throughout including a remodeled kitchen, updated flooring, new interior paint to name a few. Home features spacious bedrooms and 2 full bathrooms. Exterior has a long size driveway that can accommodate 2 car parking with guest parking nearby. Home features a cute yard with fruit trees and space for your garden needs. Community features a pool and jacuzzi as well as a clubhouse in which the park hosts event for residents all year long. Conveniently located close by shopping, transportation, and entertainment. Seller will consider a space rent credit to reduce space rent for the first year!
ⓘ Source: listings_history table (triggers on properties + properties_extension) + one-shot
backfill from property_details.listing_events for pre-trigger history.
Tax reassessment forecast CA · Resets to sale price
- Current annual tax
- $411 · $34/mo
- Projected year-2 tax
- $1,178 · $98/mo
- Expected delta
- +$767/yr (+$64/mo · 186.6%)
ⓘ Screening estimate from a state-policy table — verify with the county assessor before closing.
Climate risk First Street
- Flood 1/10 Low FEMA zone X (unshaded) · 0% chance over 30 yrs
- Wildfire 7/10 Severe
- Heat 7/10 Severe 7 d/yr ≥99°F today · 20 d/yr by 30 yrs out
- Wind 1/10 Low
- Air quality 8/10 Severe 17 unhealthy d/yr today · 21 by 30 yrs out
Nearby sold comps map
Loading sold comps map…
Walkable amenities ~0.75 mi
Loading nearby amenities…
Taxation est. · year 1
- Rental income
- $33,578
- − Mortgage interest
- −$8,682
- − Property taxes
- −$411
- − Insurance
- −$775
- − Repairs & maintenance
- −$2,686
- − Management
- −$2,686
- − Depreciation
- −$4,509
- Taxable income
- $13,828
- Est. tax owed @ 24.0%
- −$3,319
- After-tax cash flow
- $12,268/yr
For passive investors: Depreciation is non-cash, so a rental often shows a tax loss while cash-flowing — sheltering income. Rental losses are passive: they offset passive income freely, and up to $25,000/yr can offset ordinary (W-2) income if you actively participate and your MAGI is under $100k (phasing out to $0 by $150k); unused losses carry forward. On sale, claimed depreciation is recaptured at up to 25%, and gains may owe capital-gains tax (a 1031 exchange can defer both). Figures are a year-1 estimate at your 24.0% rate — not tax advice; consult a CPA.
Condition & rehab AI · 12 photos
This home is in good condition with upgrades throughout, including a remodeled kitchen and updated flooring. It is located in a desirable community with a pool and jacuzzi. The property is move-in ready with minor maintenance items to address.
Value-add opportunities
- Resale Paint the exterior walls — Fresh paint can enhance curb appeal and property value.
- Resale Replace the front door — A new front door can improve the home's curb appeal and security.
- Both Clean the gutters — Clean gutters can prevent water damage and improve the home's appearance.
Renovation cost estimate screening
Value-add ROI direction
- Resale Paint the exterior walls — Fresh paint can enhance curb appeal and property value. ↑
- Resale Replace the front door — A new front door can improve the home's curb appeal and security. ↑
- Both Clean the gutters — Clean gutters can prevent water damage and improve the home's appearance. ↑
ⓘ Cost ranges are severity-bucket heuristics (US national rule-of-thumb). Get contractor quotes + a written scope before underwriting a rehab budget.
Schools (NCES district)
- District
- Charter Oak Unified
- NCES district ID
- 0608190
- Math proficiency
- 45% ▲ 2.00%
- Reading proficiency
- 55% ▲ 4.00%
- Median HH income
- $72,756
- Composite
- 46.95/100
- National rank
- #5160
- State rank
- #387 of 1400 in CA
Livability — San Dimas
- Score
- 72/100
- State rank
- #192
- US rank
- #6164
Category grades
Schools grade is shown separately in the Schools card above.
Census & demographics
- Census place
- San Dimas, CA
- County
- Los Angeles County · 9,444,647 people
- City population
- 33,598
- Metro
- Los Angeles-Long Beach-Anaheim, CA
- Population (ZIP)
- 33,598
- Household income
- $105,338
- Rent vs Own
- Severe rent burden
- 1238.0
Population outlook (Los Angeles County) Hauer SSP2
- Today (2025)
- 10,940,515 people
- By 2030
- 11,256,481 · +2.9%
- By 2040
- 11,729,929 · +7.2%
- By 2050
- 11,948,407 · +9.2%
- By 2075
- 11,818,114 · +8.0%
- By 2100
- 10,842,928 · -0.9%
Race, ethnicity, and origin ACS 2023
- Neighborhood character
- Diverse neighborhood (Simpson 0.69)
- Race & ethnicity
- White 38% Hispanic / Latino 37% Two or more races 19% Asian 18% Black 3% Native American 1%
- Hispanic origin (detail)
- Mexican 27% Puerto Rican 1%
- Common ancestry
- Romanian 2% Lithuanian 2% Slovak 2%
- Foreign-born
- 22% · Canada, China, Vietnam
- Languages at home
- 64% English-only · Spanish 18% Chinese 8% Tagalog/Filipino 2%
Political lean MEDSL · Los Angeles
- 2024 margin
- Solid D (+32.9) · D 64.8% · R 31.9% · Other 3.3%
- 2008→2024 swing
- -7.4pp toward R · 2008: 40.4pp · 2024: 32.9pp
- All cycles
- 2024: D+32.9 2020: D+44.2 2016: D+48.0 2012: D+40.0 2008: D+40.4
Not yet ingested
- Civics
- —
Market trends
- HPI YoY
- ▼ -778.24%
- Current HPI
- 379.5269
- Rent YoY
- ▼ -0.97%
- Metro
- Los Angeles-Long Beach-Anaheim, CA
- State GDP YoY
- ▲ 3.21%
- F500 in state
- 116
Industry mix (Fortune 500 HQ in CA)
| Industry | F500 HQs | Revenue |
|---|---|---|
| Technology | 27 | $1,492B |
|
||
| Financial Services | 3 | $174B |
|
||
| Retail | 3 | $44B |
|
||
| Insurance | 3 | $26B |
|
||
| Media / Entertainment | 2 | $115B |
|
||
| Pharmaceuticals / Biotech | 2 | $62B |
|
||
Price history
-2.5% since first listed3 events — show timeline
- 2026-05-12 Price Changed $155,000 CRMLS
- 2026-02-19 Price Changed $157,000 CRMLS
- 2025-12-08 Listed $159,000 CRMLS
Property tax history
+7.2%/yrLatest (2025): $411 · +7.2% YoY. Source: county tax records.
Cash-flow waterfall
monthlySold comps — $/sqft
last 12 mo · ≤1 miLoading sold comps…