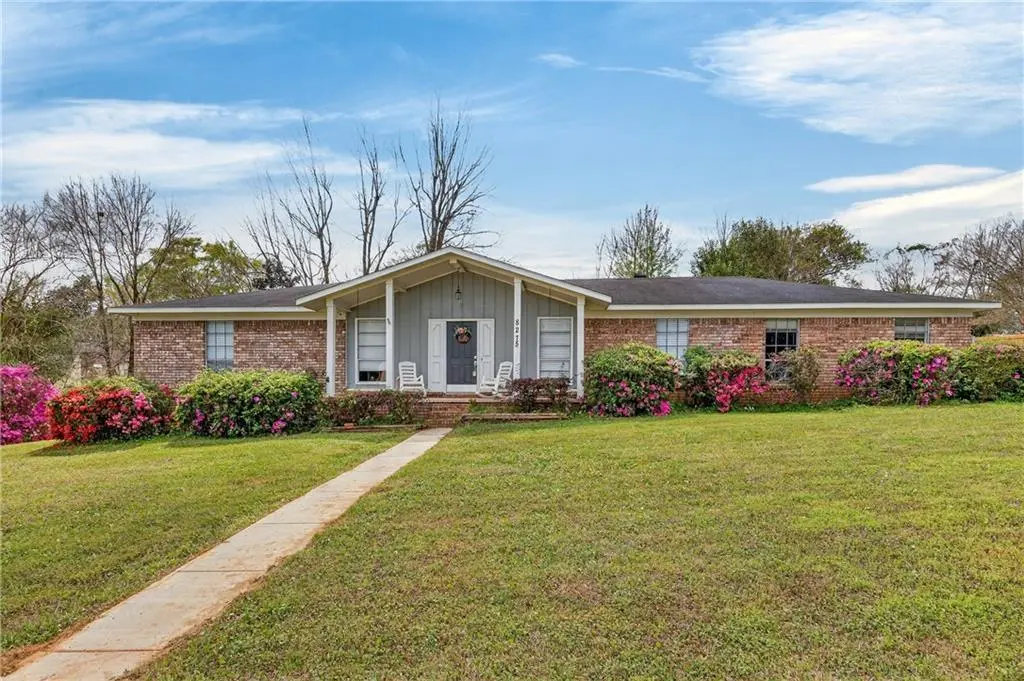
8275 Fontana Ct · Mobile, AL
Flood risk 1/10 · Minimal
- FEMA flood zone
- X (unshaded)
- Chance of flooding over 30 yrs
- 0.0%
- Est. flood insurance / yr
- $507 – $1,088
Fire risk 3/10 · Minor
- Est. fire insurance / yr
- $916 – $1,700
Heat risk 9/10 · Severe
- Hot days now (above 105°F)
- 7 days/yr
- Hot days in 30 yrs
- 21 days/yr
Wind risk 9/10 · Severe
- Chance of severe wind over 30 yrs
- 99.0%
Air-quality risk 1/10 · Minimal
- Unhealthy air days now
- 0 days/yr
- Unhealthy air days in 30 yrs
- 0 days/yr
Risk factors via First Street. Map © Google.
Why this score? — see what drove the D grade
The composite is a weighted blend of 9 inputs, each scored 0–100. Each bar is that input's sub-score; the figure is the points it added to the 100-point composite (weight × sub-score).
- Cash flow +13.2/30.0
- ARV discount +11.1/15.0
- DSCR +4.0/10.0
- Livability +3.8/5.0
- 1% rule +2.9/10.0
- Condition / age +2.5/5.0
- Rent growth +2.4/5.0
- Schools +2.3/10.0
- Appreciation +0.0/10.0
$240,000
🖨 Deal sheet (PDF) 📄 Offer letter ✓ Due diligence
Listing remarks MLS
Welcome home to this beautifully maintained 3-bedroom, 2-bath property perfectly situated on a desirable corner lot in a quiet cul-de-sac. This inviting home features a charming front porch and a spacious deck out back?ideal for relaxing or entertaining. Inside, you?ll find fresh neutral paint and durable LVP flooring throughout, creating a clean and modern feel. The spacious living room offers a cozy wood-burning fireplace, custom built-ins, and sliding glass doors that open directly to the back deck, filling the space with natural light. The large primary suite is a true retreat, complete with an en suite bath featuring double vanities and an impressive three closets for ample storage. Additional highlights include a 2-car attached garage and a functional layout designed for comfortable everyday living.
Key facts
- Quiet cul-de-sac
- Front porch
- Spacious deck
Tags
Neighborhood map
What this means for you Summary
Snapshot
- This is a 3-bed/2.0-bath single-family listed at $240k.
Deal economics
- At list price, monthly cash flow is $-4 ($-45/yr) — negative.
- To cash-flow at today's rent, offer at most $239k (0.3% below list).
- To meet the 1% rule (rent ≥ 1% of price), the offer needs to be $189k (21.1% below list).
- Recommended offer: $189k (21.1% below list) — sets the bar for 1% rule.
- Cap rate 6.3% vs local median 4.9% in Mobile — meaningfully above typical; check what's discounted (condition, days-on-market, listing class) to confirm the premium yield is real.
Location & tenants
- Location reads 75/100 on livability (#20 in AL, #4,262 nationally) — a middle-class / working-renter tenant base. Strengths: commute A+, cost of living A+, housing A+; Watch: crime F, employment D-.
- Mobile County (urban): math 15% / reading 39% proficiency, ranked #81 of 129 in AL (top 63%) — low school quality limits family demand, transient renter base, plan for 1-2y turnover; 67% free/reduced lunch — lower-income household profile, screen leases tightly.
- Zoned schools: Orourke Elementary School (math 27% / reading 59%, grade F, #204 of 627 statewide, top 33%, 862 students, 54% FRL); Bernice J Causey Middle School (math 17% / reading 51%, grade F, #98 of 257 statewide, top 38%, 1,418 students, 53% FRL); Baker High School (math 25% / reading 28%, grade F, #107 of 305 statewide, top 36%, 2,491 students, 42% FRL) — zoned schools average 49% FRL vs 67% district-wide (18 pts lower); this property's tenant base skews higher-income than the district average.
- Market conditions: Rents soft (-0.4%/yr); 557 active listings in the ZIP; 7 comparable units currently listed for rent nearby; rentals lingering (median 46d on market — plan ~5-8 weeks vacancy on turnover, expect pricing pressure); 57% of comp listings sitting > 30 days — soft ceiling on asking rent; solid renter incomes; 1,678 units permitted in Mobile County in 2024 (264 in 5+ unit buildings).
Forward outlook
- Local home prices are declining (-3.0%/yr); year-one equity from $2k of loan paydown is wiped out by about $7k of value loss. Plan a longer hold.
- Mobile County population projected to shrink 8% by 2050 — rents likely to lag national; underwrite the cash flow, not the appreciation.
Negotiation context
- It's been on market 82 days — a 6% lower offer ($226k) is reasonable based on typical stale-listing flexibility.
Risks & watch-outs
- Climate carrying-cost: severe wind risk, 99% chance of damaging wind over 30y; extreme-heat days projected 7→21/yr by 2055 (HVAC capex compounding) — expect insurance premiums to compound above CPI over the hold.
Questions for the listing agent
- What do current leases actually rent for vs. the listed asking? Can we see a recent rent roll and the last 12 months of T-12 income?
- It's been on market 82 days. Have you received any prior offers? Is the seller open to a 21% concession, seller financing, or rate buy-down credit?
- Built in 1977 — when were the roof, HVAC, electrical panel, plumbing, and water heater last replaced?
- Why hasn't it sold? Are there any deal-killer items the seller is aware of (foundation, flood, title, zoning, code violations)?
- Is there a deadline driving the sale (1031 exchange, divorce, estate, relocation)? That informs how much negotiation room exists.
- Schools are D-rated, which usually means shorter tenancies and higher turnover. Who's the typical renter profile here, and what's been the actual vacancy rate?
- Crime grade is F in this area — have there been break-ins, vandalism, or insurance claims at this property in the last 3 years? What carrier currently insures it and at what premium?
- The area grade is low — what's the realistic commute time and amenity access for the typical tenant pool here? Any planned neighborhood developments (good or bad) we should know about?
- What's the average days-on-market for RENTAL listings here right now (not sales)? A rising rental-DOM trend means longer vacancies and softer asking-rent achievability than the comps imply.
- What's the recent tenant-quality profile in this submarket — average credit score on applications, eviction rate, late-payment / NSF rate, and stable-employment percentage? A property-management company in the area should have these aggregated.
- How much new for-sale + rental construction is in the pipeline within 1–3 miles? Heavy new supply typically softens prices + rents 12–24 months out; constrained supply supports both.
Investment metrics
- 1% rule
- 0.79% ✗
- Cap rate
- 6.27%
- Cash-on-cash
- -0.07%
- DSCR
- 1.00
- GRM
- 10.6
CMA / ARV
- ARV (median comp)
- $260,906
- List price
- $240,000
- Delta
- -8.01%
- Verdict
- FAIR
- Comps
- 20 within 1.0 mi
Show comp detail 12 sales within ~0.75 mi
| Address | Dist | Beds/Ba | Sqft | Sold | Price | $/sf | Match |
|---|---|---|---|---|---|---|---|
| 8406 Champlain Cir | 0.20mi | 3/2.0 | 1,736 (-0%) | 1mo | $247,900 | $143 | 89 |
| 8451 Placid Dr | 0.25mi | 3/2.0 | 1,824 (+5%) | 1mo | $220,000 | $121 | 80 |
| 2575 Rosebud Dr | 0.41mi | 3/2.0 | 1,723 (-1%) | 2mo | $263,000 | $153 | 77 |
| 2520 Rosebud Dr | 0.43mi | 3/2.0 | 1,659 (-5%) | 0mo | $239,000 | $144 | 72 |
| 2744 Rosebud Dr E | 0.47mi | 3/2.0 | 1,763 (+1%) | 8mo | $269,900 | $153 | 69 |
| 8166 Junior Rd | 0.30mi | 3/2.0 | 1,828 (+5%) | 10mo | $270,000 | $148 | 69 |
| 2271 Carrington Dr | 0.41mi | 4/2.5 (+1) | 1,824 (+5%) | 3mo | $320,000 | $175 | 63 |
| 8240 Winchester Woods Ct | 0.18mi | 4/2.0 (+1) | 1,928 (+11%) | 11mo | $300,000 | $156 | 59 |
| 2261 Vulcan Ct | 0.59mi | 3/2.0 | 1,868 (+7%) | 2mo | $260,000 | $139 | 59 |
| 2618 D'iberville Dr N | 0.52mi | 3/2.0 | 1,650 (-5%) | 10mo | $180,000 | $109 | 58 |
| 2691 E Rosebud Dr | 0.40mi | 4/2.0 (+1) | 1,923 (+10%) | 12mo | $274,500 | $143 | 49 |
| 7931 Candlewood Dr | 0.71mi | 3/2.5 | 1,996 (+14%) | 14mo | $350,000 | $175 | 30 |
Match score weights: distance 35% · size 25% · config 20% · recency 20%. Top-matched comps best support the ARV.
Projected returns pro-forma
-3.0% appreciation · 0.0% rent growth · sell at horizon
- IRR
- -19.5%
- Equity multiple
- 0.33×
- Total profit
- $-44,749
- Equity at exit
- $35,785
- IRR
- -19.4%
- Equity multiple
- 0.09×
- Total profit
- $-61,007
- Equity at exit
- $20,751
Cash invested: $67,200 (down + closing). Projections, not guarantees.
Landlord ↔ Tenant lean methodology
- Overall (STATE)
- 90 Strongly Landlord-Friendly
- State Alabama
- 90 Strongly Landlord-Friendly · R+15
- County
- — inherits STATE
- City
- — inherits STATE
ZIP-level market 36695
- Home prices YoY
- -30.9%
- Rents YoY
- -0.4%
- Active inventory
- 557
- Price-to-rent
- 10.6×
Monthly cashflow live
- Estimated rent
- $1,894 high interval (Pro) →
- Mortgage (P&I)
- −$1,259
- Tax from tax record
- −$142 /mo · $1,698/yr
- Insurance
- −$100
- HOA
- −$0
- Vacancy / Maint / Mgmt
- −$398
- Net cashflow
- $-4
Break-even live
Sensitivity live
| Price | -10% $132 | -5% $64 | +0% $-4 | +5% $-72 | +10% $-140 |
|---|---|---|---|---|---|
| Rent | -10% $-153 | -5% $-79 | +0% $-4 | +5% $71 | +10% $146 |
| Rate | -1.0pp $117 | -0.5pp $57 | base $-4 | +0.5pp $-66 | +1.0pp $-129 |
UW: 25.0% down · 7.5% · 30yr · 1.5% tax · 5.0% vac · 8.0% maint · 8.0% mgmt
Financing live
Cash to close
- Down payment
- $60,000
- Closing costs
- $7,200
- Reserves months
- —
- Total cash needed
- —
Loan-product check · same deal, 3 products live
Conventional
25% down · 7.5% · 30yr
- Down + closing
- —
- Monthly P&I
- —
- Monthly cashflow
- —
- DSCR
- —
- Eligible?
- —
Personal DTI + credit; lowest rate.
DSCR
20% down · 8.5% · 30yr
- Down + closing
- —
- Monthly P&I
- —
- Monthly cashflow
- —
- DSCR
- —
- Eligible?
- —
No personal income docs; deal must DSCR.
Hard money
10% down · 12.0% · 12mo
- Down + closing
- —
- Monthly P&I
- —
- Monthly cashflow
- —
- DSCR
- —
- Eligible?
- —
Short-term bridge; refi at stabilization.
Rent comps 7 comps
| Address | Beds | Baths | Sqft | Rent | $/sqft | DOM | Units | Dist |
|---|---|---|---|---|---|---|---|---|
| 2719 Rosebud Dr Mobile, AL | 3.0 | 2.0 | 1704 | $1,950 | $1.14 | 15d | 1 | 0.51mi |
| 8361 Jeptha Ct Mobile, AL | 3.0 | 2.0 | 1600 | $1,900 | $1.19 | 45d | 1 | 0.72mi |
| 2346 Bobwhite Trl W Mobile, AL | 3.0 | 2.0 | 1781 | $1,650 | $0.93 | 23d | 1 | 0.96mi |
| 2212 Summer Xing Mobile, AL | 3.0 | 2.0 | 1327 | $1,800 | $1.36 | 45d | 1 | 1.04mi |
| 2175 Schillinger Rd S Mobile, AL | 1.0–3.0 | 1.0–2.0 | 1188 | $1,790 | $1.51 | 15d | 11 | 1.10mi |
| 2147 Seasons Ct Mobile, AL | 4.0 | 2.0 | 1600 | $1,625 | $1.02 | 45d | 1 | 1.10mi |
| 1718 Calgary Dr W Mobile, AL | 4.0 | 2.0 | 1830 | $2,200 | $1.20 | 45d | 1 | 1.14mi |
Listing history 18 events
-
2026-06-21days on market $240,000 Active 82 DOM
-
2026-06-18days on market $240,000 Active 79 DOM
-
2026-06-17days on market $240,000 Active 78 DOM
-
2026-06-16days on market $240,000 Active 77 DOM
-
2026-06-15days on market $240,000 Active 76 DOM
-
2026-06-14days on market $240,000 Active 74 DOM
-
2026-06-13days on market $240,000 Active 73 DOM
-
2026-06-10days on market $240,000 Active 71 DOM
-
2026-06-09days on market $240,000 Active 70 DOM
-
2026-06-08days on market $240,000 Active 69 DOM
-
2026-06-07days on market $240,000 Active 68 DOM
-
2026-06-05days on market $240,000 Active 65 DOM
-
2026-06-03days on market $240,000 Active 64 DOM
-
2026-06-02days on market $240,000 Active 63 DOM
-
2026-06-01days on market $240,000 Active 62 DOM
-
2026-05-31days on market $240,000 Active 61 DOM
-
2026-05-30days on market $240,000 Active 60 DOM
-
2026-03-31$248,000 Active 822-char remark
Show marketing remark (822 chars)
Welcome home to this beautifully maintained 3-bedroom, 2-bath property perfectly situated on a desirable corner lot in a quiet cul-de-sac. This inviting home features a charming front porch and a spacious deck out back?ideal for relaxing or entertaining. Inside, you?ll find fresh neutral paint and durable LVP flooring throughout, creating a clean and modern feel. The spacious living room offers a cozy wood-burning fireplace, custom built-ins, and sliding glass doors that open directly to the back deck, filling the space with natural light. The large primary suite is a true retreat, complete with an en suite bath featuring double vanities and an impressive three closets for ample storage. Additional highlights include a 2-car attached garage and a functional layout designed for comfortable everyday living.
ⓘ Source: listings_history table (triggers on properties + properties_extension) + one-shot
backfill from property_details.listing_events for pre-trigger history.
Tax reassessment forecast AL · Resets to sale price
- Current annual tax
- $1,698 · $142/mo
- Projected year-2 tax
- $1,698 · $142/mo
- Expected delta
- $0/yr ($0/mo · 0.0%)
ⓘ Screening estimate from a state-policy table — verify with the county assessor before closing.
Climate risk First Street
- Flood 1/10 Low FEMA zone X (unshaded) · 0% chance over 30 yrs
- Wildfire 3/10 Moderate
- Heat 9/10 Extreme 7 d/yr ≥105°F today · 21 d/yr by 30 yrs out
- Wind 9/10 Extreme 99% chance of damaging wind over 30 yrs
- Air quality 1/10 Low 0 unhealthy d/yr today · 0 by 30 yrs out
Nearby sold comps map
Loading sold comps map…
Walkable amenities ~0.75 mi
Loading nearby amenities…
Taxation est. · year 1
- Rental income
- $22,730
- − Mortgage interest
- −$13,444
- − Property taxes
- −$1,698
- − Insurance
- −$1,200
- − Repairs & maintenance
- −$1,818
- − Management
- −$1,818
- − Depreciation
- −$6,982
- Taxable loss
- −$4,231
- Est. tax savings @ 24.0%
- +$1,015
- After-tax cash flow
- $970/yr
For passive investors: Depreciation is non-cash, so a rental often shows a tax loss while cash-flowing — sheltering income. Rental losses are passive: they offset passive income freely, and up to $25,000/yr can offset ordinary (W-2) income if you actively participate and your MAGI is under $100k (phasing out to $0 by $150k); unused losses carry forward. On sale, claimed depreciation is recaptured at up to 25%, and gains may owe capital-gains tax (a 1031 exchange can defer both). Figures are a year-1 estimate at your 24.0% rate — not tax advice; consult a CPA.
Schools (NCES district)
- District
- Mobile County
- NCES district ID
- 0102370
- Math proficiency
- 15% ▼ -28.00%
- Reading proficiency
- 39% ▬ 0.00%
- Median HH income
- $42,455
- Composite
- 22.9/100
- National rank
- #8002
- State rank
- #81 of 129 in AL
Livability — Mobile
- Score
- 75/100
- State rank
- #20
- US rank
- #4262
Category grades
Schools grade is shown separately in the Schools card above.
Census & demographics
- County
- Mobile County · 246,577 people
- City population
- 205,729
- Metro
- Mobile, AL
- Population (ZIP)
- 52,690
- Household income
- $76,040
- Rent vs Own
- Severe rent burden
- 1619.0
Population outlook (Mobile County) Hauer SSP2
- Today (2025)
- 415,303 people
- By 2030
- 411,755 · -0.9%
- By 2040
- 399,670 · -3.8%
- By 2050
- 382,616 · -7.9%
- By 2075
- 337,353 · -18.8%
- By 2100
- 283,391 · -31.8%
Race, ethnicity, and origin ACS 2023
- Neighborhood character
- Predominantly White (67%)
- Race & ethnicity
- White 67% Black 23% Two or more races 5% Hispanic / Latino 5% Asian 2%
- Common ancestry
- Lithuanian 3% Italian 2% Slovak 1%
- Foreign-born
- 5% · Canada, Vietnam, China
- Languages at home
- 94% English-only · Spanish 2% Vietnamese 1% Arabic 1%
Political lean MEDSL · Mobile
- 2024 margin
- R (+16.4) · D 41.3% · R 57.7%
- 2008→2024 swing
- -7.7pp toward R · 2008: -8.7pp · 2024: -16.4pp
- All cycles
- 2024: R+16.4 2020: R+11.9 2016: R+13.9 2012: R+9.3 2008: R+8.7
Not yet ingested
- Civics
- —
Market trends
- HPI YoY
- ▼ -86.28%
- Current HPI
- 193.1651
- Rent YoY
- ▼ -0.41%
- Metro
- Mobile, AL
- State GDP YoY
- ▲ 2.94%
- F500 in state
- 4
Industry mix (Fortune 500 HQ in AL)
| Industry | F500 HQs | Revenue |
|---|---|---|
| Financial Services | 1 | $8B |
|
||
| Healthcare | 1 | $5B |
|
||
Price history
1 event — show timeline
- 2026-03-31 Listed $248,000 GCMLS AL
Property tax history
+12.8%/yrLatest (2025): $1,698 · +4.7% YoY. Source: county tax records.
Cash-flow waterfall
monthlySold comps — $/sqft
last 12 mo · ≤1 miLoading sold comps…