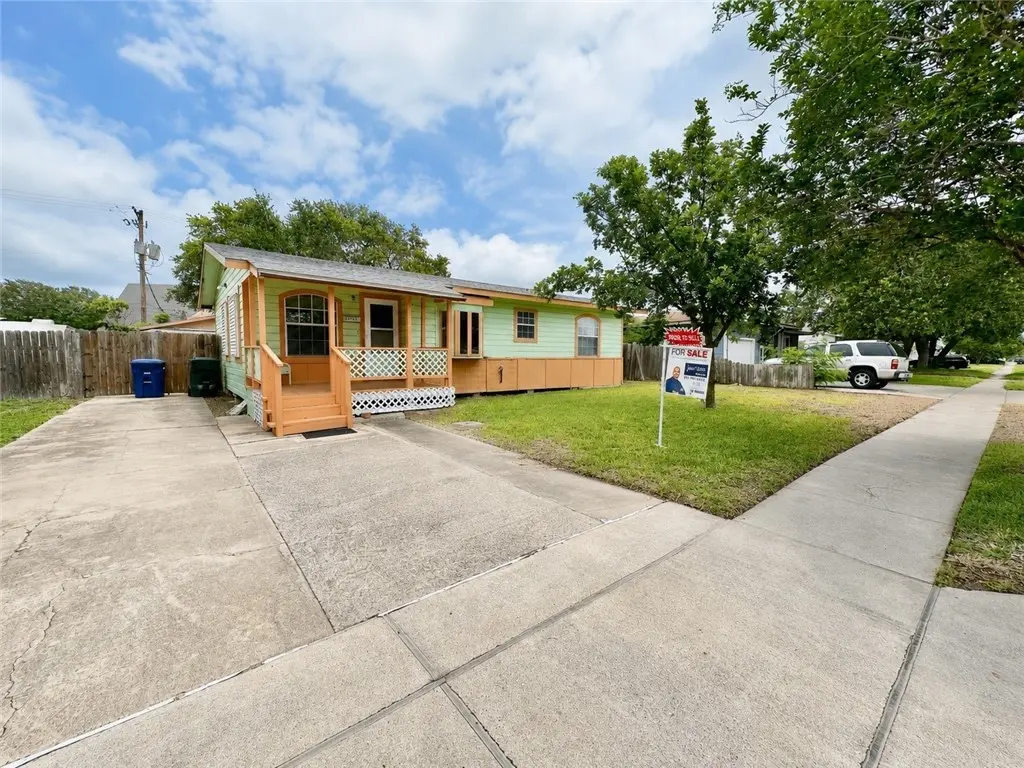
5018 Bevly Dr · Corpus Christi, TX
Flood risk 5/10 · Moderate
- FEMA flood zone
- X (unshaded)
- Chance of flooding over 30 yrs
- 0.6%
- Est. flood insurance / yr
- $507 – $1,088
Fire risk 1/10 · Minimal
- Est. fire insurance / yr
- $1,222 – $2,270
Heat risk 10/10 · Severe
- Hot days now (above 107°F)
- 7 days/yr
- Hot days in 30 yrs
- 25 days/yr
Wind risk 9/10 · Severe
- Chance of severe wind over 30 yrs
- 99.0%
Air-quality risk 1/10 · Minimal
- Unhealthy air days now
- 0 days/yr
- Unhealthy air days in 30 yrs
- 0 days/yr
Risk factors via First Street. Map © Google.
Why this score? — see what drove the B- grade
The composite is a weighted blend of 9 inputs, each scored 0–100. Each bar is that input's sub-score; the figure is the points it added to the 100-point composite (weight × sub-score).
- Cash flow +23.1/30.0
- ARV discount +15.0/15.0
- 1% rule +7.5/10.0
- DSCR +7.4/10.0
- Rent growth +4.5/5.0
- Livability +3.9/5.0
- Schools +2.8/10.0
- Condition / age +2.5/5.0
- Appreciation +0.0/10.0
$99,000
🖨 Deal sheet (PDF) 📄 Offer letter ✓ Due diligence
Listing remarks
Prime Investment Potential in Windsor Park #4! This home is a standout opportunity for investors or DIY enthusiasts. Nestled in a great location, this property is within walking distance to Lena Park and just minutes on foot from the premier shopping and dining at La Palmera Mall. Major Structural Update: Peace of mind starts at the top with a new roof installed in 2023. Approximately 984 sq. ft. of living space on a generous backyard, providing a manageable renovation project with great curb appeal. Easy Commute with quick and easy access to SPID puts the rest of Corpus Christi just minutes away. Top-Tier Convenience, it is close to groceries, entertainment, and the highway, making it an i
Key facts
- New roof installed
- Quick access to spid
- Generous backyard
Tags
Property features AI
Finance
- HOA & community: Short-term rentals allowed
Exterior
- Parking: Detached garage; Carport; Two covered parking spaces
- Security: Smoke detector(s)
- Utilities: Natural gas available; Public water; Public sewer
- Home design: Single-story home; Wood siding exterior; Pillar/post/pier foundation; Shingle roof
- Construction: Wood siding construction; Shingle roof; Pillar/Post/Pier foundation
- Exterior features: Open patio; Exterior storage; Wood fencing
Interior
- Kitchen: Range hood
- Flooring: Laminate flooring; Vinyl flooring
- Bathrooms: One full bathroom
- Heating & cooling: Central heating (electric); Central air conditioning
- Interior features: Smoke detectors installed; Storage space
- Laundry & utility: Washer hookup; Dryer hookup
Neighborhood map
What this means for you Summary
Snapshot
- This is a 2-bed/1.0-bath single-family listed at $99k.
Deal economics
- At list price, monthly cash flow is $178 ($2k/yr) — positive.
- The deal already cash-flows at list — no discount required.
- Meets the 1% rule at list price ($1k rent vs $99k).
- Recommended offer: $96k (3.0% below list) — sets the bar for market timing.
- Cap rate 8.5% vs local median 3.6% in Corpus Christi — top-decile yield for the area; either an underpriced asset or a hidden risk that comps aren't pricing in. Stress-test before assuming the spread holds.
Location & tenants
- Location reads 78/100 on livability (#66 in TX, #2,404 nationally) — a middle-class / working-renter tenant base. Strengths: commute A+, cost of living A+, housing A+; Watch: crime F.
- Corpus Christi ISD (urban): math 31% / reading 35% proficiency, ranked #562 of 826 in TX (top 68%) — families likely to look elsewhere, expect single-tenant / working-renter base with shorter leases; 63% free/reduced lunch — lower-income household profile, screen leases tightly.
- Market conditions: Rents rising fast (+7.9%/yr); 147 active listings in the ZIP; 22 comparable units currently listed for rent nearby; rentals at typical pace (median 22d on market — plan ~3-4 weeks tenant-placement turnaround); 45% of comp listings sitting > 30 days — soft ceiling on asking rent; 1,397 units permitted in Nueces County in 2024 (47 in 5+ unit buildings).
Forward outlook
- Local home prices are declining (-3.0%/yr); year-one equity from $684 of loan paydown is wiped out by about $3k of value loss. Plan a longer hold.
- Nueces County population projected at +36% by 2050 — long-run rental-demand tailwind backs the buy-and-hold thesis.
- At projected returns (-3.0% appreciation + 7.9% rent growth), your $28k cash investment doubles in ~8 years — after that, you're playing with house money.
Negotiation context
- It's been on market 37 days — a 3% lower offer ($96k) is reasonable based on typical stale-listing flexibility.
- 3 sale attempts since 2y ago; this cycle's ask has dropped $31k (24%) from the opening price — seller is motivated, your offer sets the floor, not the list.
Risks & watch-outs
- Watch-outs: property tax is 2.9% of price; built in 1953 — expect roof / HVAC / electrical / plumbing capex.
- Climate carrying-cost: moderate flood risk; severe wind risk, 99% chance of damaging wind over 30y; extreme-heat days projected 7→25/yr by 2055 (HVAC capex compounding) — expect insurance premiums to compound above CPI over the hold.
Questions for the listing agent
- It's been on market 37 days. Have you received any prior offers? Is the seller open to a 3% concession, seller financing, or rate buy-down credit?
- Built in 1953 — when were the roof, HVAC, electrical panel, plumbing, and water heater last replaced?
- Property tax is high relative to price — has the assessment been appealed recently, and will the sale trigger a re-assessment?
- Is there a deadline driving the sale (1031 exchange, divorce, estate, relocation)? That informs how much negotiation room exists.
- Crime grade is F in this area — have there been break-ins, vandalism, or insurance claims at this property in the last 3 years? What carrier currently insures it and at what premium?
- What's the average days-on-market for RENTAL listings here right now (not sales)? A rising rental-DOM trend means longer vacancies and softer asking-rent achievability than the comps imply.
- What's the recent tenant-quality profile in this submarket — average credit score on applications, eviction rate, late-payment / NSF rate, and stable-employment percentage? A property-management company in the area should have these aggregated.
- How much new for-sale + rental construction is in the pipeline within 1–3 miles? Heavy new supply typically softens prices + rents 12–24 months out; constrained supply supports both.
Investment metrics
- 1% rule
- 1.25% ✓
- Cap rate
- 8.45%
- Cash-on-cash
- 7.71%
- DSCR
- 1.34
- GRM
- 6.7
CMA / ARV
- ARV (median comp)
- $156,401
- List price
- $99,000
- Delta
- -36.70%
- Verdict
- UNDERPRICED
- Comps
- 20 within 1.0 mi
Show comp detail 12 sales within ~0.75 mi
| Address | Dist | Beds/Ba | Sqft | Sold | Price | $/sf | Match |
|---|---|---|---|---|---|---|---|
| 4814 Willowbrook Dr | 0.29mi | 3/1.0 (+1) | 996 (+1%) | 2mo | $99,000 | $99 | 78 |
| 729 Sharon Dr | 0.40mi | 2/1.0 | 1,025 (+4%) | 2mo | $195,900 | $191 | 73 |
| 758 Sharon Dr | 0.32mi | 2/1.0 | 902 (-8%) | 2mo | $89,900 | $100 | 69 |
| 4917 Andover Dr | 0.33mi | 3/1.0 (+1) | 1,031 (+5%) | 4mo | $177,000 | $172 | 69 |
| 4909 Holmes Dr | 0.32mi | 3/1.5 (+1) | 1,032 (+5%) | 2mo | $179,900 | $174 | 68 |
| 726 John Lee St | 0.41mi | 3/1.0 (+1) | 1,015 (+3%) | 5mo | $179,000 | $176 | 67 |
| 4237 Jacquelyn Dr | 0.40mi | 3/1.0 (+1) | 943 (-4%) | 4mo | $69,900 | $74 | 66 |
| 601 Lansdown Dr | 0.65mi | 2/1.0 | 944 (-4%) | 3mo | $149,900 | $159 | 60 |
| 4621 Calvin Dr | 0.59mi | 3/1.5 (+1) | 1,019 (+4%) | 1mo | $161,000 | $158 | 59 |
| 702 Sharon Dr | 0.47mi | 2/1.0 | 872 (-11%) | 3mo | $129,000 | $148 | 56 |
| 734 Lansdown Dr | 0.38mi | 2/1.0 | 1,117 (+14%) | 5mo | $165,000 | $148 | 55 |
| 638 Sharon Dr | 0.55mi | 2/1.0 | 868 (-12%) | 1mo | $155,000 | $179 | 54 |
Match score weights: distance 35% · size 25% · config 20% · recency 20%. Top-matched comps best support the ARV.
Projected returns pro-forma
-3.0% appreciation · 7.91% rent growth · sell at horizon
- IRR
- 1.6%
- Equity multiple
- 1.07×
- Total profit
- $1,817
- Equity at exit
- $14,761
- IRR
- 16.1%
- Equity multiple
- 2.65×
- Total profit
- $45,733
- Equity at exit
- $8,560
Cash invested: $27,720 (down + closing). Projections, not guarantees.
Landlord ↔ Tenant lean methodology
- Overall (STATE)
- 87 Strongly Landlord-Friendly
- State Texas
- 87 Strongly Landlord-Friendly · R+5
- County
- — inherits STATE
- City
- — inherits STATE
ZIP-level market 78411
- Rents YoY
- 7.9%
- Active inventory
- 147
- Price-to-rent
- 6.7×
Monthly cashflow live
- Estimated rent
- $1,239 high interval (Pro) →
- Mortgage (P&I)
- −$519
- Tax from tax record
- −$240 /mo · $2,878/yr
- Insurance
- −$41
- HOA
- −$0
- Vacancy / Maint / Mgmt
- −$260
- Net cashflow
- $178
Break-even live
Sensitivity live
| Price | -10% $234 | -5% $206 | +0% $178 | +5% $150 | +10% $122 |
|---|---|---|---|---|---|
| Rent | -10% $80 | -5% $129 | +0% $178 | +5% $227 | +10% $276 |
| Rate | -1.0pp $228 | -0.5pp $203 | base $178 | +0.5pp $153 | +1.0pp $126 |
UW: 25.0% down · 7.5% · 30yr · 1.5% tax · 5.0% vac · 8.0% maint · 8.0% mgmt
Financing live
Cash to close
- Down payment
- $24,750
- Closing costs
- $2,970
- Reserves months
- —
- Total cash needed
- —
Loan-product check · same deal, 3 products live
Conventional
25% down · 7.5% · 30yr
- Down + closing
- —
- Monthly P&I
- —
- Monthly cashflow
- —
- DSCR
- —
- Eligible?
- —
Personal DTI + credit; lowest rate.
DSCR
20% down · 8.5% · 30yr
- Down + closing
- —
- Monthly P&I
- —
- Monthly cashflow
- —
- DSCR
- —
- Eligible?
- —
No personal income docs; deal must DSCR.
Hard money
10% down · 12.0% · 12mo
- Down + closing
- —
- Monthly P&I
- —
- Monthly cashflow
- —
- DSCR
- —
- Eligible?
- —
Short-term bridge; refi at stabilization.
Rent comps 22 comps
| Address | Beds | Baths | Sqft | Rent | $/sqft | DOM | Units | Dist |
|---|---|---|---|---|---|---|---|---|
| 5002 Bevly Dr Unit B Corpus Christi, TX | 2.0 | 1.0 | 550 | $699 | $1.27 | 22d | 1 | 0.07mi |
| 4613 Gollihar Rd Unit 3 Corpus Christi, TX | 1.0 | 1.0 | 743 | $925 | $1.24 | 44d | 1 | 0.59mi |
| 802 Barry St Corpus Christi, TX | 2.0 | 1.5 | 1102 | $1,529 | $1.39 | 44d | 1 | 0.65mi |
| 946 Lum Ave Corpus Christi, TX | 3.0 | 1.0 | 1045 | $1,300 | $1.24 | 44d | 1 | 0.70mi |
| 4805 Lavaca Dr Unit 1 Corpus Christi, TX | 2.0 | 1.0 | 1030 | $1,300 | $1.26 | 22d | 1 | 0.76mi |
| 4422 S Alameda St Corpus Christi, TX | 1.0–3.0 | 1.0–2.0 | 820 | $800 | $0.98 | 14d | 1 | 0.76mi |
| 1001 Carmel Pkwy Corpus Christi, TX | 1.0 | 1.0 | 854 | $999 | $1.17 | 44d | 1 | 0.79mi |
| 5825 Hugo Dr Corpus Christi, TX | 3.0 | 1.0 | 970 | $1,550 | $1.60 | 14d | 1 | 0.90mi |
| 4848 S Alameda St Corpus Christi, TX | 2.0 | 1.0 | 1085 | $975 | $0.90 | 44d | 1 | 0.98mi |
| 4201 Junior Ter Corpus Christi, TX | 3.0 | 1.0 | 1016 | $1,600 | $1.57 | 44d | 1 | 0.99mi |
| 4502 Corona Dr Corpus Christi, TX | 1.0–2.0 | 1.0–2.0 | 855 | $1,000 | $1.17 | 14d | 1 | 1.03mi |
| 5750 Curtis Clark Dr Corpus Christi, TX | 2.0 | 1.0–2.0 | 756 | $1,560 | $2.06 | 14d | 20 | 1.17mi |
| 318 Aberdeen Ave Unit 1268410P Corpus Christi, TX | 3.0 | 1.5 | 1076 | $4,405 | $4.09 | 44d | 1 | 1.22mi |
| 4645 Ocean Dr Corpus Christi, TX | 2.0 | 1.0–2.0 | 760 | $1,320 | $1.74 | 14d | 1 | 1.29mi |
| 4325 Ocean Dr Corpus Christi, TX | 1.0 | 1.0 | 730 | $974 | $1.33 | 44d | 2 | 1.33mi |
| 4657 Ocean Dr Corpus Christi, TX | 1.0–2.0 | 1.0–2.0 | 931 | $1,890 | $2.03 | 14d | 7 | 1.33mi |
| 4002 McArdle Rd Corpus Christi, TX | 3.0 | 1.0 | 1018 | $1,095 | $1.08 | 14d | 1 | 1.37mi |
| 4602 Ocean Dr Corpus Christi, TX | 1.0–2.0 | 1.0–2.0 | 972 | $3,671 | $3.77 | 14d | 30 | 1.37mi |
| 5802 Everhart Rd Corpus Christi, TX | 1.0–3.0 | 1.0–2.0 | 926 | $1,315 | $1.42 | 14d | 16 | 1.39mi |
| 4334 Ocean Dr #605 Corpus Christi, TX | 1.0 | 2.0 | 948 | $2,000 | $2.11 | 22d | 1 | 1.40mi |
| 5757 S Staples St Corpus Christi, TX | 1.0–3.0 | 1.0–2.0 | 856 | $1,306 | $1.52 | 44d | 1 | 1.44mi |
| 4224 Ocean Dr Corpus Christi, TX | 2.0 | 1.0 | 699 | $949 | $1.36 | 44d | 7 | 1.48mi |
Listing history 18 events
-
2026-06-10days on market $99,000 Active 37 DOM
-
2026-06-09days on market $99,000 Active 36 DOM
-
2026-06-08days on market $99,000 Active 35 DOM
-
2026-06-07days on market $99,000 Active 34 DOM
-
2026-06-05days on market $99,000 Active 31 DOM
-
2026-06-03days on market $99,000 Active 30 DOM
-
2026-06-02days on market $99,000 Active 29 DOM
-
2026-06-01days on market $99,000 Active 28 DOM
-
2026-05-31days on market $99,000 Active 27 DOM
-
2026-05-30days on market $99,000 Active 26 DOM
-
2026-05-04$130,000 Active 990-char remark
-
2025-05-03status Pending
-
2025-04-22price $127,500
-
2025-03-11$132,500 Active
-
2024-12-15status Pending
-
2024-12-09historical Active Under Contract
-
2024-10-28$120,000 Active
-
1996-01-19soldstatus
ⓘ Source: listings_history table (triggers on properties + properties_extension) + one-shot
backfill from property_details.listing_events for pre-trigger history.
Tax reassessment forecast TX · Resets to sale price
- Current annual tax
- $2,878 · $240/mo
- Projected year-2 tax
- $2,878 · $240/mo
- Expected delta
- $0/yr ($0/mo · 0.0%)
ⓘ Screening estimate from a state-policy table — verify with the county assessor before closing.
Climate risk First Street
- Flood 5/10 Major FEMA zone X (unshaded) · 60% chance over 30 yrs
- Wildfire 1/10 Low
- Heat 10/10 Extreme 7 d/yr ≥107°F today · 25 d/yr by 30 yrs out
- Wind 9/10 Extreme 99% chance of damaging wind over 30 yrs
- Air quality 1/10 Low 0 unhealthy d/yr today · 0 by 30 yrs out
Nearby sold comps map
Loading sold comps map…
Walkable amenities ~0.75 mi
Loading nearby amenities…
Taxation est. · year 1
- Rental income
- $14,862
- − Mortgage interest
- −$5,546
- − Property taxes
- −$2,878
- − Insurance
- −$495
- − Repairs & maintenance
- −$1,189
- − Management
- −$1,189
- − Depreciation
- −$2,880
- Taxable income
- $686
- Est. tax owed @ 24.0%
- −$165
- After-tax cash flow
- $1,973/yr
For passive investors: Depreciation is non-cash, so a rental often shows a tax loss while cash-flowing — sheltering income. Rental losses are passive: they offset passive income freely, and up to $25,000/yr can offset ordinary (W-2) income if you actively participate and your MAGI is under $100k (phasing out to $0 by $150k); unused losses carry forward. On sale, claimed depreciation is recaptured at up to 25%, and gains may owe capital-gains tax (a 1031 exchange can defer both). Figures are a year-1 estimate at your 24.0% rate — not tax advice; consult a CPA.
Schools (NCES district)
- District
- Corpus Christi ISD
- NCES district ID
- 4815270
- Math proficiency
- 31% ▼ -18.00%
- Reading proficiency
- 35% ▼ -7.00%
- Median HH income
- $45,672
- Composite
- 28.27/100
- National rank
- #6793
- State rank
- #562 of 826 in TX
Livability — Corpus Christi
- Score
- 78/100
- State rank
- #66
- US rank
- #2404
Category grades
Schools grade is shown separately in the Schools card above.
Census & demographics
- Census place
- Corpus Christi, TX
- County
- Nueces County · 296,836 people
- City population
- 296,836
- Metro
- Corpus Christi, TX
- Population (ZIP)
- 23,682
- Household income
- $57,742
- Rent vs Own
- Severe rent burden
- 1284.0
Population outlook (Nueces County) Hauer SSP2
- Today (2025)
- 418,037 people
- By 2030
- 447,123 · +7.0%
- By 2040
- 505,911 · +21.0%
- By 2050
- 567,522 · +35.8%
- By 2075
- 729,686 · +74.6%
- By 2100
- 847,087 · +102.6%
Race, ethnicity, and origin ACS 2023
- Neighborhood character
- Majority Hispanic (58%)
- Race & ethnicity
- Hispanic / Latino 58% White 35% Two or more races 29% Black 3% Asian 2%
- Hispanic origin (detail)
- Mexican 51%
- Common ancestry
- Slovak 2% Italian 1% Serbian 1%
- Foreign-born
- 6% · Canada
- Languages at home
- 75% English-only · Spanish 23% Tagalog/Filipino 1% Other Indo-European 1%
Political lean MEDSL · Nueces
- 2024 margin
- R (+11.5) · D 43.8% · R 55.3%
- 2008→2024 swing
- -7.1pp toward R · 2008: -4.4pp · 2024: -11.5pp
- All cycles
- 2024: R+11.5 2020: R+2.9 2016: R+1.5 2012: R+3.2 2008: R+4.4
Not yet ingested
- Civics
- —
Market trends
- HPI YoY
- ▼ -265.71%
- Current HPI
- 191.7201
- Rent YoY
- ▲ 7.91%
- Metro
- Corpus Christi, TX
- State GDP YoY
- ▲ 3.95%
- F500 in state
- 110
Industry mix (Fortune 500 HQ in TX)
| Industry | F500 HQs | Revenue |
|---|---|---|
| Energy | 16 | $1,198B |
|
||
| Technology | 5 | $198B |
|
||
| Engineering / Construction | 4 | $72B |
|
||
| Energy Services | 3 | $60B |
|
||
| Utilities | 3 | $41B |
|
||
| Healthcare | 2 | $330B |
|
||
Price history
-17.5% since first listed10 events — show timeline
- 2026-06-10 Delisted — CBMLS
- 2026-05-22 Price Changed $99,000 CBMLS
- 2026-05-04 Listed $130,000 CBMLS
- 2025-05-03 Pending — CBMLS
- 2025-04-22 Price Changed $127,500 CBMLS
- 2025-03-11 Listed $132,500 CBMLS
- 2024-12-15 Pending — CBMLS
- 2024-12-09 Contingent — CBMLS
- 2024-10-28 Listed $120,000 CBMLS
- 1996-01-19 Sold (Public Records) — Public Records
Property tax history
+3.6%/yrLatest (2025): $2,878 · +12.0% YoY. Source: county tax records.
Cash-flow waterfall
monthlySold comps — $/sqft
last 12 mo · ≤1 miLoading sold comps…