2013 E 4th Ave · Port Angeles East, WA
Flood risk 1/10 · Minimal
- FEMA flood zone
- X
- Chance of flooding over 30 yrs
- 0.0%
- Est. flood insurance / yr
- $507 – $1,088
Fire risk 2/10 · Minimal
- Est. fire insurance / yr
- $604 – $1,122
Heat risk 2/10 · Minimal
- Hot days now (above 81°F)
- 7 days/yr
- Hot days in 30 yrs
- 15 days/yr
Wind risk 1/10 · Minimal
- Chance of severe wind over 30 yrs
- —
Air-quality risk 6/10 · Moderate
- Unhealthy air days now
- 8 days/yr
- Unhealthy air days in 30 yrs
- 9 days/yr
Risk factors via First Street. Map © Google.
Why this score? — see what drove the B+ grade
The composite is a weighted blend of 9 inputs, each scored 0–100. Each bar is that input's sub-score; the figure is the points it added to the 100-point composite (weight × sub-score).
- Cash flow +30.0/30.0
- ARV discount +15.0/15.0
- 1% rule +10.0/10.0
- DSCR +10.0/10.0
- Schools +5.2/10.0
- Livability +3.8/5.0
- Rent growth +2.5/5.0
- Condition / age +2.5/5.0
- Appreciation +0.0/10.0
$75,000
🖨 Deal sheet (PDF) 📄 Offer letter ✓ Due diligence
Listing remarks MLS
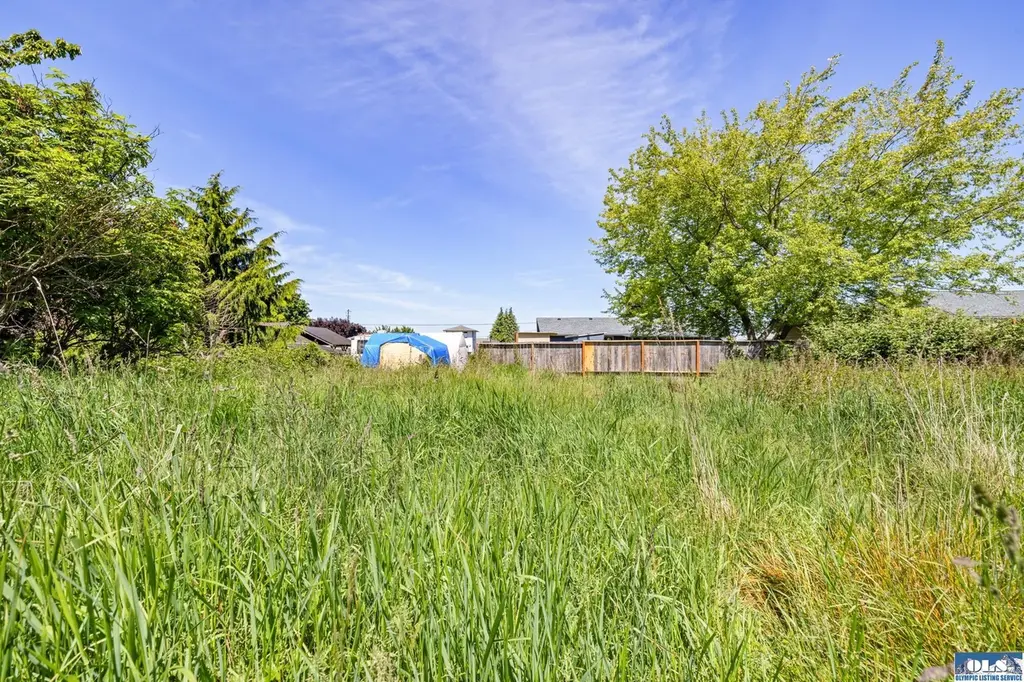
Opportunity awaits in Port Angeles' Gales Addition. Situated on a double-sized lot along a paved street, this entire property is being sold as-is and offers a valuable canvas for redevelopment, investment, or a fresh start. The existing 1964 single-wide mobile home is not habitable, with the value primarily in the land and existing utility infrastructure. Property features include PUD power, water at the street, a detached workshop building, and an existing septic system that has been inspected, with repairs or upgrades likely needed. Whether you're considering placement of a new manufactured home, a custom build, or another vision for the site, this property offers potential in a neighborhood experiencing ongoing renewal and improvement. Bring your tools, creativity, and vision to unlock the possibilities this oversized parcel has to offer.
Key facts
- Double-sized lot
- Pud water and power
- 0.3 acre lot
Tags
Property features AI
Finance
- Other: Lot includes Lots 14–16 and vacated alley (approximately 0.3012 acres, ~75 x 175'); Vegetation: brush; Zoning: LD (county jurisdiction); Site features include value in land
- Financial info: Listing terms: Cash
Exterior
- Parking: Driveway parking; Covered parking for 1 vehicle
- Utilities: Electric service (Clallam County PUD); Public water (Clallam County PUD); Private septic; Electric water heater
- Home design: Manufactured single-wide home; Single-story; West-facing; Has a view; Condition: fixer
- Construction: Built circa 1964 (effective year); Metal/vinyl construction; Torch down roof; Block and pier/pillar foundation
- Exterior features: Metal/vinyl exterior; Outbuildings; Paved access
Interior
- Kitchen: Appliances listed in remarks
- Bedrooms: 2 bedrooms (both on the main level)
- Flooring: Vinyl flooring; Carpet
- Bathrooms: 1 full bathroom with tub and shower
- Heating & cooling: Forced air heating; No cooling
- Interior features: Water heater
- Laundry & utility: See remarks for included appliances
Neighborhood map
What this means for you Summary
Snapshot
- This is a 2-bed/1.0-bath manufactured listed at $75k.
Deal economics
- At list price, monthly cash flow is $1k ($13k/yr) — positive.
- The deal already cash-flows at list — no discount required.
- Meets the 1% rule at list price ($2k rent vs $75k).
- Cap rate 23.6% vs local median 1.4% in Port Angeles East — top-decile yield for the area; either an underpriced asset or a hidden risk that comps aren't pricing in. Stress-test before assuming the spread holds.
Location & tenants
- Location reads 75/100 on livability (#162 in WA, #3,899 nationally) — a middle-class / working-renter tenant base. Strengths: commute A+, housing A+, cost of living A-; Watch: employment D+, health & safety D, amenities F.
- Port Angeles School District (town): math 55% / reading 65% proficiency, ranked #70 of 291 in WA (top 24%) — acceptable for families but not a draw, mixed tenant base, ~2y average lease.
- Zoned schools: Roosevelt Elementary School (406 students, 64% FRL); Stevens Middle School (492 students, 63% FRL); Port Angeles High School (989 students, 57% FRL) — zoned schools average 61% FRL vs 46% district-wide (16 pts higher); higher-poverty schools than district average — tighter screening recommended.
- Market conditions: 273 active listings in the ZIP; 1 comparable units currently listed for rent nearby; 166 units permitted in Clallam County in 2024 (0 in 5+ unit buildings).
Forward outlook
- Local home prices are declining (-3.0%/yr); year-one equity from $519 of loan paydown is wiped out by about $2k of value loss. Plan a longer hold.
- Clallam County population projected at +5% by 2050 — modest demand growth; plan on rents tracking national, not racing it.
- At projected returns (-3.0% appreciation + 3.0% rent growth), your $21k cash investment doubles in ~2 years — after that, you're playing with house money.
Negotiation context
- Only 2 days on market — expect competitive offers; lowballing is unlikely to land.
- 2 sale attempts with the ask held roughly flat each time — persistent listings suggest the price (not the market) is what's stuck; bring a comps-based counter.
Questions for the listing agent
- Built in 1964 — when were the roof, HVAC, electrical panel, plumbing, and water heater last replaced?
- Is there a deadline driving the sale (1031 exchange, divorce, estate, relocation)? That informs how much negotiation room exists.
- Schools are F-rated, which usually means shorter tenancies and higher turnover. Who's the typical renter profile here, and what's been the actual vacancy rate?
- What's the average days-on-market for RENTAL listings here right now (not sales)? A rising rental-DOM trend means longer vacancies and softer asking-rent achievability than the comps imply.
- What's the recent tenant-quality profile in this submarket — average credit score on applications, eviction rate, late-payment / NSF rate, and stable-employment percentage? A property-management company in the area should have these aggregated.
- How much new for-sale + rental construction is in the pipeline within 1–3 miles? Heavy new supply typically softens prices + rents 12–24 months out; constrained supply supports both.
Investment metrics
- 1% rule
- 2.67% ✓
- Cap rate
- 23.61%
- Cash-on-cash
- 61.83%
- DSCR
- 3.75
- GRM
- 3.1
CMA / ARV
- ARV (on-the-fly)
- $147,420
- Comps found
- 1
Show comp detail 1 sale within ~0.75 mi
| Address | Dist | Beds/Ba | Sqft | Sold | Price | $/sf | Match |
|---|---|---|---|---|---|---|---|
| 2033 E Sixth Ave | 0.14mi | 2/1.0 | 988 (+9%) | 21mo | $160,000 | $162 | 62 |
Match score weights: distance 35% · size 25% · config 20% · recency 20%. Top-matched comps best support the ARV.
Projected returns pro-forma
-3.0% appreciation · 3.0% rent growth · sell at horizon
- IRR
- 60.7%
- Equity multiple
- 3.70×
- Total profit
- $56,779
- Equity at exit
- $11,183
- IRR
- 65.4%
- Equity multiple
- 7.58×
- Total profit
- $138,253
- Equity at exit
- $6,485
Cash invested: $21,000 (down + closing). Projections, not guarantees.
Landlord ↔ Tenant lean methodology
- Overall (STATE)
- 28 Tenant-Leaning
- State Washington
- 28 Tenant-Leaning · D+8
- County
- — inherits STATE
- City
- — inherits STATE
ZIP-level market 98362
- Active inventory
- 273
- Price-to-rent
- 3.1×
Monthly cashflow live
- Estimated rent
- $2,000 medium interval (Pro) →
- Mortgage (P&I)
- −$393
- Tax from tax record
- −$73 /mo · $881/yr
- Insurance
- −$31
- HOA
- −$0
- Vacancy / Maint / Mgmt
- −$420
- Net cashflow
- $1,082
Break-even live
Sensitivity live
| Price | -10% $1,124 | -5% $1,103 | +0% $1,082 | +5% $1,061 | +10% $1,040 |
|---|---|---|---|---|---|
| Rent | -10% $924 | -5% $1,003 | +0% $1,082 | +5% $1,161 | +10% $1,240 |
| Rate | -1.0pp $1,120 | -0.5pp $1,101 | base $1,082 | +0.5pp $1,063 | +1.0pp $1,043 |
UW: 25.0% down · 7.5% · 30yr · 1.5% tax · 5.0% vac · 8.0% maint · 8.0% mgmt
Financing live
Cash to close
- Down payment
- $18,750
- Closing costs
- $2,250
- Reserves months
- —
- Total cash needed
- —
Loan-product check · same deal, 3 products live
Conventional
25% down · 7.5% · 30yr
- Down + closing
- —
- Monthly P&I
- —
- Monthly cashflow
- —
- DSCR
- —
- Eligible?
- —
Personal DTI + credit; lowest rate.
DSCR
20% down · 8.5% · 30yr
- Down + closing
- —
- Monthly P&I
- —
- Monthly cashflow
- —
- DSCR
- —
- Eligible?
- —
No personal income docs; deal must DSCR.
Hard money
10% down · 12.0% · 12mo
- Down + closing
- —
- Monthly P&I
- —
- Monthly cashflow
- —
- DSCR
- —
- Eligible?
- —
Short-term bridge; refi at stabilization.
Rent comps 1 comps
| Address | Beds | Baths | Sqft | Rent | $/sqft | DOM | Units | Dist |
|---|---|---|---|---|---|---|---|---|
| 2938 E Walnut St Unit 5 Port Angeles, WA | 2.0 | 1.0 | 740 | $2,000 | $2.70 | 45d | 1 | 1.25mi |
Listing history 4 events
-
2026-06-04status $75,000 Pending 2 DOM
-
2026-06-03days on market $75,000 Active 2 DOM
-
2026-06-02remarks 699-char remark
-
2026-06-02$75,000 Active 1 DOM
ⓘ Source: listings_history table (triggers on properties + properties_extension) + one-shot
backfill from property_details.listing_events for pre-trigger history.
Tax reassessment forecast WA · Resets to sale price
- Current annual tax
- $881 · $73/mo
- Projected year-2 tax
- $881 · $73/mo
- Expected delta
- $0/yr ($0/mo · 0.0%)
ⓘ Screening estimate from a state-policy table — verify with the county assessor before closing.
Climate risk First Street
- Flood 1/10 Low FEMA zone X · 0% chance over 30 yrs
- Wildfire 2/10 Low
- Heat 2/10 Low 7 d/yr ≥81°F today · 15 d/yr by 30 yrs out
- Wind 1/10 Low
- Air quality 6/10 Major 8 unhealthy d/yr today · 9 by 30 yrs out
Nearby sold comps map
Loading sold comps map…
Walkable amenities ~0.75 mi
Loading nearby amenities…
Taxation est. · year 1
- Rental income
- $24,000
- − Mortgage interest
- −$4,201
- − Property taxes
- −$881
- − Insurance
- −$375
- − Repairs & maintenance
- −$1,920
- − Management
- −$1,920
- − Depreciation
- −$2,182
- Taxable income
- $12,521
- Est. tax owed @ 24.0%
- −$3,005
- After-tax cash flow
- $9,979/yr
For passive investors: Depreciation is non-cash, so a rental often shows a tax loss while cash-flowing — sheltering income. Rental losses are passive: they offset passive income freely, and up to $25,000/yr can offset ordinary (W-2) income if you actively participate and your MAGI is under $100k (phasing out to $0 by $150k); unused losses carry forward. On sale, claimed depreciation is recaptured at up to 25%, and gains may owe capital-gains tax (a 1031 exchange can defer both). Figures are a year-1 estimate at your 24.0% rate — not tax advice; consult a CPA.
Schools (NCES district)
- District
- Port Angeles School District
- NCES district ID
- 5306820
- Math proficiency
- 55% ▬ 0.00%
- Reading proficiency
- 65% ▲ 1.00%
- Median HH income
- $46,594
- Composite
- 52.34/100
- National rank
- #3432
- State rank
- #70 of 291 in WA
Livability — Port Angeles East
- Score
- 75/100
- State rank
- #162
- US rank
- #3899
Category grades
Schools grade is shown separately in the Schools card above.
Census & demographics
- Census place
- Port Angeles East, WA
- Population (ZIP)
- 23,907
Population outlook (Clallam County) Hauer SSP2
- Today (2025)
- 76,817 people
- By 2030
- 78,177 · +1.8%
- By 2040
- 79,795 · +3.9%
- By 2050
- 80,890 · +5.3%
- By 2075
- 83,933 · +9.3%
- By 2100
- 82,141 · +6.9%
Race, ethnicity, and origin ACS 2023
- Neighborhood character
- Predominantly White (84%)
- Race & ethnicity
- White 84% Two or more races 8% Hispanic / Latino 7% Native American 1% Asian 1%
- Hispanic origin (detail)
- Mexican 4%
- Common ancestry
- Italian 6% Portuguese 6% Lithuanian 4%
- Foreign-born
- 4% · Canada
- Languages at home
- 95% English-only · Spanish 3% German/W. Germanic 1%
Political lean MEDSL · Clallam
- 2024 margin
- Lean D (+7.9) · D 52.6% · R 44.7% · Other 2.7%
- 2008→2024 swing
- +4.6pp toward D · 2008: 3.3pp · 2024: 7.9pp
- All cycles
- 2024: D+7.9 2020: D+3.4 2016: R+1.6 2012: D+0.4 2008: D+3.3
Not yet ingested
- Civics
- —
Market trends
- HPI YoY
- ▼ -340.90%
- Current HPI
- 189.7112
- Rent YoY
- —
- Metro
- —
- State GDP YoY
- ▲ 4.65%
- F500 in state
- 22
Industry mix (Fortune 500 HQ in WA)
| Industry | F500 HQs | Revenue |
|---|---|---|
| Retail | 2 | $269B |
|
||
| Technology / Retail | 1 | $638B |
|
||
| Technology | 1 | $245B |
|
||
| Telecommunications | 1 | $38B |
|
||
| Food / Beverage | 1 | $36B |
|
||
| Automotive / Trucks | 1 | $34B |
|
||
Price history
+0.0% since first listed2 events — show timeline
- 2026-06-01 Listed $75,000 OLS
- 2026-06-01 Listed $75,000 NWMLS as Distributed by MLS Grid
Property tax history
+5.4%/yrLatest (2026): $881 · -0.2% YoY. Source: county tax records.
Cash-flow waterfall
monthlySold comps — $/sqft
last 12 mo · ≤1 miLoading sold comps…