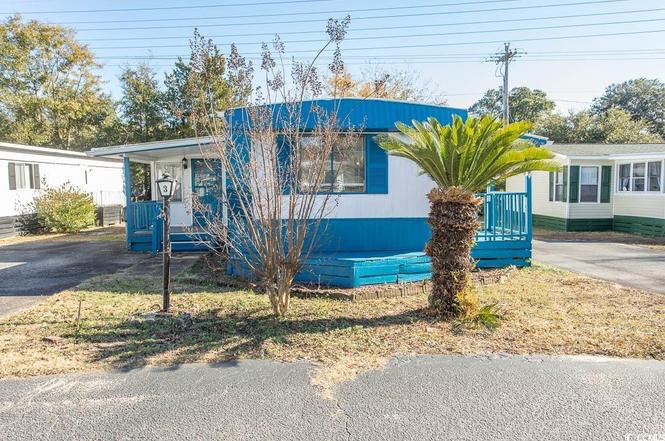
3 Burr Cir · Murrells Inlet, SC
Flood risk 5/10 · Moderate
- FEMA flood zone
- X (shaded)
- Chance of flooding over 30 yrs
- 0.24%
- Est. flood insurance / yr
- $507 – $1,088
Fire risk 4/10 · Minor
- Est. fire insurance / yr
- $783 – $1,453
Heat risk 9/10 · Severe
- Hot days now (above 106°F)
- 7 days/yr
- Hot days in 30 yrs
- 18 days/yr
Wind risk 9/10 · Severe
- Chance of severe wind over 30 yrs
- 99.0%
Air-quality risk 2/10 · Minimal
- Unhealthy air days now
- 0 days/yr
- Unhealthy air days in 30 yrs
- 1 days/yr
Risk factors via First Street. Map © Google.
Why this score? — see what drove the B+ grade
The composite is a weighted blend of 9 inputs, each scored 0–100. Each bar is that input's sub-score; the figure is the points it added to the 100-point composite (weight × sub-score).
- Cash flow +30.0/30.0
- ARV discount +15.0/15.0
- 1% rule +10.0/10.0
- DSCR +10.0/10.0
- Livability +3.8/5.0
- Rent growth +3.7/5.0
- Schools +2.7/10.0
- Condition / age +2.5/5.0
- Appreciation +0.0/10.0
$49,900
🖨 Deal sheet 📄 Offer letter ✓ Due diligence
Listing remarks
Discover 3 Burr Circle in Inlet Oaks Village, an active 55+ community in Murrells Inlet, SC. This refreshed home offers affordable coastal living just minutes from the Marsh Walk, local dining, and area beaches. The community features a friendly atmosphere with amenities including a pool and clubhouse, ideal for an active and social lifestyle. Inside, the home offers a well-designed layout with a spacious kitchen, three bedrooms, and one-and-a-half baths. A bright four-season porch provides a relaxing space to enjoy year-round, and an outdoor storage shed adds extra convenience. Perfect as a primary residence or weekend getaway, 3 Burr Circle blends comfort, convenience, and community livin
Key facts
- Pool and clubhouse
- Well-designed layout
- Four-season porch
Tags
Property features AI
Finance
- Financial info: Has land lease: $690 monthly; Property is for sale; Pets allowed by owner
- HOA & community: Monthly association fee; Association amenities: clubhouse, pet restrictions, owner-allowed golf cart, owner-allowed motorcycle; Senior community
Exterior
- Parking: Driveway; 2 parking spaces (total)
- Security: Smoke detector(s)
- Utilities: Public water; Sewer available; Cable available; Underground utilities
- Home design: Single wide mobile home; Resale property; Rectangular lot; Zoned residential
- Construction: Vinyl siding; Crawlspace foundation
- Exterior features: Front porch; Community outdoor pool; Community amenities (clubhouse, recreation area)
Interior
- Kitchen: Dishwasher; Microwave; Range; Refrigerator; Pantry; Kitchen/Dining combo; Breakfast bar
- Bedrooms: Bedroom on main level
- Flooring: Vinyl
- Bathrooms: 1 full bathroom; 1 half bathroom
- Heating & cooling: Central heating; Central air conditioning
- Interior features: Main level primary bedroom; Window treatments; Breakfast bar; Carolina room; Utility room; Unfurnished
- Laundry & utility: Washer hookup; Dryer; Washer
Neighborhood map
What this means for you Summary
Snapshot
- This is a 3-bed/1.5-bath manufactured listed at $50k.
Deal economics
- At list price, monthly cash flow is $1k ($14k/yr) — positive.
- The deal already cash-flows at list — no discount required.
- Meets the 1% rule at list price ($2k rent vs $50k).
- Recommended offer: $44k (12.0% below list) — sets the bar for market timing.
- Cap rate 35.1% vs local median 2.2% in Murrells Inlet — top-decile yield for the area; either an underpriced asset or a hidden risk that comps aren't pricing in. Stress-test before assuming the spread holds.
Location & tenants
- Location reads 76/100 on livability (#25 in SC, #3,720 nationally) — a middle-class / working-renter tenant base. Strengths: crime A+, housing A+, health & safety A+; Watch: amenities F, commute F.
- Georgetown 01 (town): math 26% / reading 38% proficiency, ranked #51 of 80 in SC (top 64%) — families likely to look elsewhere, expect single-tenant / working-renter base with shorter leases.
- Market conditions: Rents rising fast (+4.7%/yr); 287 active listings in the ZIP; 5 comparable units currently listed for rent nearby; rentals at typical pace (median 24d on market — plan ~3-4 weeks tenant-placement turnaround); 323 units permitted in Georgetown County in 2024 (0 in 5+ unit buildings).
- This rent runs 33% of the median local income ($71k/yr) — at the standard rent-burdened threshold; future hikes will face affordability resistance.
Forward outlook
- Local home prices are declining (-3.0%/yr); year-one equity from $345 of loan paydown is wiped out by about $1k of value loss. Plan a longer hold.
- At projected returns (-3.0% appreciation + 4.7% rent growth), your $14k cash investment doubles in ~2 years — after that, you're playing with house money.
Negotiation context
- It's been on market 184 days — a 12% lower offer ($44k) is reasonable based on typical stale-listing flexibility.
- 8 sale attempts since 2y ago; this cycle's ask has dropped $10k (17%) from the opening price — seller is motivated, your offer sets the floor, not the list.
Risks & watch-outs
- Climate carrying-cost: moderate flood risk; severe wind risk, 99% chance of damaging wind over 30y; extreme-heat days projected 7→18/yr by 2055 (HVAC capex compounding) — expect insurance premiums to compound above CPI over the hold.
Questions for the listing agent
- It's been on market 184 days. Have you received any prior offers? Is the seller open to a 12% concession, seller financing, or rate buy-down credit?
- Why hasn't it sold? Are there any deal-killer items the seller is aware of (foundation, flood, title, zoning, code violations)?
- Is there a deadline driving the sale (1031 exchange, divorce, estate, relocation)? That informs how much negotiation room exists.
- Schools are A-rated — typically a magnet for longer-tenancy family renters. What's the average tenant stay here, and is there a school-zone premium baked into asking?
- What's the average days-on-market for RENTAL listings here right now (not sales)? A rising rental-DOM trend means longer vacancies and softer asking-rent achievability than the comps imply.
- What's the recent tenant-quality profile in this submarket — average credit score on applications, eviction rate, late-payment / NSF rate, and stable-employment percentage? A property-management company in the area should have these aggregated.
- How much new for-sale + rental construction is in the pipeline within 1–3 miles? Heavy new supply typically softens prices + rents 12–24 months out; constrained supply supports both.
Investment metrics
- 1% rule
- 3.92% ✓
- Cap rate
- 35.14%
- Cash-on-cash
- 103.04%
- DSCR
- 5.58
- GRM
- 2.1
CMA / ARV
- ARV (on-the-fly)
- $71,400
- Comps found
- 12
Show comp detail 12 sales within ~0.75 mi
| Address | Dist | Beds/Ba | Sqft | Sold | Price | $/sf | Match |
|---|---|---|---|---|---|---|---|
| 43 Ravenel Ct | 0.14mi | 2/2.0 (-1) | 1,260 (-1%) | 6mo | $54,900 | $44 | 79 |
| 74 Boone Loop | 0.18mi | 3/2.0 | 1,350 (+6%) | 1mo | $130,000 | $96 | 79 |
| 103 Village Ct | 0.07mi | 3/2.0 | 1,194 (-6%) | 9mo | $92,000 | $77 | 77 |
| 106 Inlet Oaks Village Ct | 0.09mi | 3/2.0 | 1,357 (+6%) | 8mo | $95,000 | $70 | 76 |
| 163 Crooked Island Cir | 0.39mi | 3/2.0 | 1,344 (+5%) | 3mo | $75,000 | $56 | 68 |
| 59 Crooked Island Cir | 0.55mi | 3/2.0 | 1,300 (+2%) | 6mo | $85,000 | $65 | 64 |
| 10 Acorn Ct | 0.11mi | 2/2.0 (-1) | 1,130 (-11%) | 8mo | $75,000 | $66 | 62 |
| 100 Crooked Island Cir | 0.59mi | 3/2.0 | 1,344 (+5%) | 1mo | $40,000 | $30 | 61 |
| 8 Buccaneer St | 0.52mi | 3/2.0 | 1,400 (+10%) | 1mo | $59,000 | $42 | 56 |
| 22 Crooked Island Cir | 0.60mi | 3/2.0 | 1,431 (+12%) | 0mo | $65,000 | $45 | 49 |
| 91 Crooked Island Cir | 0.62mi | 2/2.0 (-1) | 1,120 (-12%) | 4mo | $11,500 | $10 | 40 |
| 67 Crooked Island Cir | 0.65mi | 2/2.0 (-1) | 1,100 (-14%) | 0mo | $45,000 | $41 | 40 |
Match score weights: distance 35% · size 25% · config 20% · recency 20%. Top-matched comps best support the ARV.
Projected returns pro-forma
-3.0% appreciation · 4.66% rent growth · sell at horizon
- IRR
- —
- Equity multiple
- 6.13×
- Total profit
- $71,674
- Equity at exit
- $7,440
- IRR
- —
- Equity multiple
- 13.53×
- Total profit
- $175,014
- Equity at exit
- $4,314
Cash invested: $13,972 (down + closing). Projections, not guarantees.
Landlord ↔ Tenant lean methodology
- Overall (STATE)
- 90 Strongly Landlord-Friendly
- State South Carolina
- 90 Strongly Landlord-Friendly · R+6
- County
- — inherits STATE
- City
- — inherits STATE
ZIP-level market 29576
- Home prices YoY
- -18.8%
- Rents YoY
- 4.7%
- Active inventory
- 287
- Price-to-rent
- 2.1×
Monthly cashflow live
- Estimated rent
- $1,955 high interval (Pro) →
- Mortgage (P&I)
- −$262
- Tax est. 1.5%
- −$62 /mo · $748/yr
- Insurance
- −$21
- HOA
- −$0
- Vacancy / Maint / Mgmt
- −$411
- Net cashflow
- $1,200
Break-even live
UW: 25.0% down · 7.5% · 30yr · 1.5% tax · 5.0% vac · 8.0% maint · 8.0% mgmt
Financing live
Cash to close
- Down payment
- $12,475
- Closing costs
- $1,497
- Reserves months
- —
- Total cash needed
- —
Loan-product check · same deal, 3 products live
Conventional
25% down · 7.5% · 30yr
- Down + closing
- —
- Monthly P&I
- —
- Monthly cashflow
- —
- DSCR
- —
- Eligible?
- —
Personal DTI + credit; lowest rate.
DSCR
20% down · 8.5% · 30yr
- Down + closing
- —
- Monthly P&I
- —
- Monthly cashflow
- —
- DSCR
- —
- Eligible?
- —
No personal income docs; deal must DSCR.
Hard money
10% down · 12.0% · 12mo
- Down + closing
- —
- Monthly P&I
- —
- Monthly cashflow
- —
- DSCR
- —
- Eligible?
- —
Short-term bridge; refi at stabilization.
Rent comps 5 comps
| Address | Beds | Baths | Sqft | Rent | $/sqft | DOM | Units | Dist |
|---|---|---|---|---|---|---|---|---|
| 4996 Highway 17 Business Murrells Inlet, SC | 2.0 | 2.0 | 925 | $1,500 | $1.62 | 14d | 1 | 0.62mi |
| 13 Muddy Bay Dr Murrells Inlet, SC | 2.0–3.0 | 2.0 | 1095 | $2,116 | $1.93 | 14d | 13 | 1.27mi |
| 50 Turning Stone Boulelvard Murrells Inlet, SC | 3.0 | 2.0 | 1350 | $1,750 | $1.30 | 23d | 1 | 1.37mi |
| 66 Turning Stone Boulelvard Unit 1 Murrells Inlet, SC | 3.0 | 2.0 | 1350 | $1,595 | $1.18 | 23d | 1 | 1.38mi |
| 66 Turning Stone Blvd Murrells Inlet, SC | 3.0 | 2.0 | 1450 | $1,700 | $1.17 | 23d | 1 | 1.40mi |
Listing history 30 events
-
2026-06-18days on market $49,900 Active 184 DOM
-
2026-06-17days on market $49,900 Active 183 DOM
-
2026-06-16days on market $49,900 Active 182 DOM
-
2026-06-15days on market $49,900 Active 181 DOM
-
2026-06-14days on market $49,900 Active 179 DOM
-
2026-06-10days on market $49,900 Active 176 DOM
-
2026-06-09days on market $49,900 Active 175 DOM
-
2026-06-08days on market $49,900 Active 174 DOM
-
2026-06-07days on market $49,900 Active 173 DOM
-
2026-06-03days on market $49,900 Active 169 DOM
-
2026-06-02days on market $49,900 Active 168 DOM
-
2026-06-01days on market $49,900 Active 167 DOM
-
2026-05-31days on market $49,900 Active 166 DOM
-
2026-05-30days on market $49,900 Active 165 DOM
-
2026-05-06status Active
-
2026-04-23historical Active Under Contract
-
2026-04-15price $49,900
-
2025-12-16$59,959 Active
-
2025-10-30historical
-
2025-09-23status Active
-
2025-09-08historical Active Under Contract
-
2025-08-29$75,000 Active
-
2025-08-07historical
-
2025-07-15$75,000 Active
-
2025-07-12historical
-
2025-04-28$79,000 Active
-
2025-04-26historical
-
2025-02-07$85,000 Active
-
2025-02-01historical
-
2024-11-27$90,000 Active
ⓘ Source: listings_history table (triggers on properties + properties_extension) + one-shot
backfill from property_details.listing_events for pre-trigger history.
Climate risk First Street
- Flood 5/10 Major FEMA zone X (shaded) · 24% chance over 30 yrs
- Wildfire 4/10 Moderate
- Heat 9/10 Extreme 7 d/yr ≥106°F today · 18 d/yr by 30 yrs out
- Wind 9/10 Extreme 99% chance of damaging wind over 30 yrs
- Air quality 2/10 Low 0 unhealthy d/yr today · 1 by 30 yrs out
Nearby sold comps map
Loading sold comps map…
Walkable amenities ~0.75 mi
Loading nearby amenities…
Taxation est. · year 1
- Rental income
- $23,462
- − Mortgage interest
- −$2,795
- − Property taxes
- −$748
- − Insurance
- −$250
- − Repairs & maintenance
- −$1,877
- − Management
- −$1,877
- − Depreciation
- −$1,452
- Taxable income
- $14,463
- Est. tax owed @ 24.0%
- −$3,471
- After-tax cash flow
- $10,926/yr
For passive investors: Depreciation is non-cash, so a rental often shows a tax loss while cash-flowing — sheltering income. Rental losses are passive: they offset passive income freely, and up to $25,000/yr can offset ordinary (W-2) income if you actively participate and your MAGI is under $100k (phasing out to $0 by $150k); unused losses carry forward. On sale, claimed depreciation is recaptured at up to 25%, and gains may owe capital-gains tax (a 1031 exchange can defer both). Figures are a year-1 estimate at your 24.0% rate — not tax advice; consult a CPA.
Schools (NCES district)
- District
- Georgetown 01
- NCES district ID
- 4502280
- Math proficiency
- 26% ▼ -11.00%
- Reading proficiency
- 38% ▼ -5.00%
- Median HH income
- $43,045
- Composite
- 27.15/100
- National rank
- #7030
- State rank
- #51 of 80 in SC
Livability — Murrells Inlet
- Score
- 76/100
- State rank
- #25
- US rank
- #3720
Category grades
Schools grade is shown separately in the Schools card above.
Census & demographics
- Census place
- Murrells Inlet, SC
- County
- Horry County · 356,152 people
- City population
- 34,695
- Metro
- Myrtle Beach-Conway-North Myrtle Beach, SC-NC
- Population (ZIP)
- 34,695
- Household income
- $70,691
- Rent vs Own
- Severe rent burden
- 309.0
Population outlook (Georgetown County) Hauer SSP2
- Today (2025)
- 63,275 people
- By 2030
- 63,630 · +0.6%
- By 2040
- 63,130 · -0.2%
- By 2050
- 61,904 · -2.2%
- By 2075
- 59,305 · -6.3%
- By 2100
- 53,852 · -14.9%
Race, ethnicity, and origin ACS 2023
- Neighborhood character
- Predominantly White (89%)
- Race & ethnicity
- White 89% Hispanic / Latino 4% Black 3% Two or more races 3% Asian 2%
- Common ancestry
- Romanian 4% Slovak 3% Serbian 2%
- Foreign-born
- 5% · Canada, China, Vietnam
- Languages at home
- 96% English-only · Spanish 2% Chinese 1%
Political lean MEDSL · Georgetown
- 2024 margin
- R (+19.5) · D 39.6% · R 59.1% · Other 1.2%
- 2008→2024 swing
- -14.2pp toward R · 2008: -5.2pp · 2024: -19.5pp
- All cycles
- 2024: R+19.5 2020: R+12.7 2016: R+13.0 2012: R+7.6 2008: R+5.2
Not yet ingested
- Civics
- —
Market trends
- HPI YoY
- ▼ -57.53%
- Current HPI
- 248.5102
- Rent YoY
- ▲ 4.66%
- Metro
- Myrtle Beach-Conway-North Myrtle Beach, SC-NC
- State GDP YoY
- ▲ 4.51%
- F500 in state
- 2
Industry mix (Fortune 500 HQ in SC)
| Industry | F500 HQs | Revenue |
|---|---|---|
| Packaging | 1 | $7B |
|
||
Price history
-44.6% since first listed16 events — show timeline
- 2026-05-06 Relisted — CCAR
- 2026-04-23 Contingent — CCAR
- 2026-04-15 Price Changed $49,900 CCAR
- 2025-12-16 Listed $59,959 CCAR
- 2025-10-30 Listing Removed — CCAR
- 2025-09-23 Relisted — CCAR
- 2025-09-08 Contingent — CCAR
- 2025-08-29 Listed $75,000 CCAR
- 2025-08-07 Listing Removed — CCAR
- 2025-07-15 Listed $75,000 CCAR
- 2025-07-12 Listing Removed — CCAR
- 2025-04-28 Listed $79,000 CCAR
- 2025-04-26 Listing Removed — CCAR
- 2025-02-07 Listed $85,000 CCAR
- 2025-02-01 Listing Removed — CCAR
- 2024-11-27 Listed $90,000 CCAR
Cash-flow waterfall
monthlySold comps — $/sqft
last 12 mo · ≤1 miLoading sold comps…