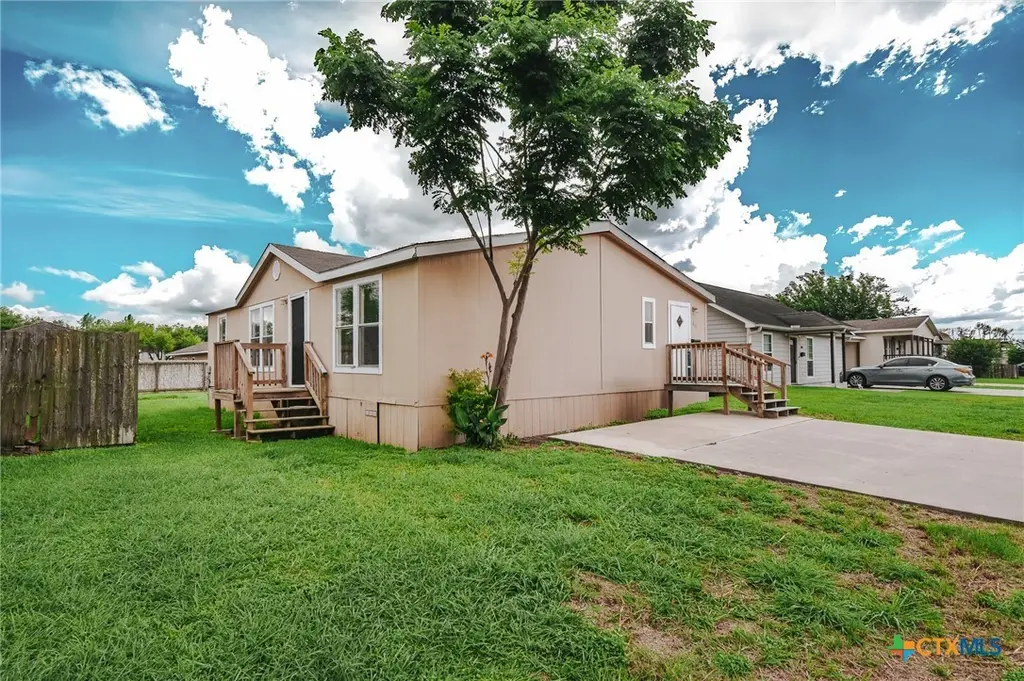
811 E Mesquite Ln · Victoria, TX
Flood risk 1/10 · Minimal
- FEMA flood zone
- X
- Chance of flooding over 30 yrs
- 0.0%
- Est. flood insurance / yr
- $507 – $1,088
Fire risk 4/10 · Minor
- Est. fire insurance / yr
- $1,222 – $2,270
Heat risk 9/10 · Severe
- Hot days now (above 111°F)
- 7 days/yr
- Hot days in 30 yrs
- 21 days/yr
Wind risk 8/10 · Major
- Chance of severe wind over 30 yrs
- 99.0%
Air-quality risk 1/10 · Minimal
- Unhealthy air days now
- 0 days/yr
- Unhealthy air days in 30 yrs
- 0 days/yr
Risk factors via First Street. Map © Google.
Why this score? — see what drove the B- grade
The composite is a weighted blend of 9 inputs, each scored 0–100. Each bar is that input's sub-score; the figure is the points it added to the 100-point composite (weight × sub-score).
- Cash flow +30.0/30.0
- 1% rule +10.0/10.0
- DSCR +10.0/10.0
- ARV discount +7.5/15.0
- Livability +3.6/5.0
- Schools +2.5/10.0
- Condition / age +2.5/5.0
- Rent growth +2.3/5.0
- Appreciation +0.0/10.0
$79,400
🖨 Deal sheet 📄 Offer letter ✓ Due diligence
Listing remarks
811 E Mesquite is a 3 bedroom, 2 bathroom home offering 1,296 square feet of living space and plenty of potential for its next owner. Inside, you'll find a spacious living area that flows into the kitchen and dining space, creating an open and functional layout. The primary suite features its own private bathroom and walk-in closet, while the additional bedrooms provide flexibility for family, guests, or a home office. Outside, enjoy a fenced backyard with room for pets, play, or future improvements. Investors will appreciate the value-add potential, while buyers looking for an affordable home can make it their own with a few personal touches. Schedule your showing today!
Key facts
- Walk-in closet
- Open layout
- Private bathroom
Tags
Property features AI
Exterior
- Security: Smoke detector(s)
- Utilities: Electricity available; Public water; Public sewer; Public trash collection
- Home design: Double wide mobile home; 1 story; Resale property; Pillar/post/pier foundation
- Construction: HardiPlank-type siding; Composition / shingle roof; Built year per assessor
- Exterior features: Private yard; City lot, level, less than quarter acre; City street frontage
Interior
- Kitchen: Eat-in kitchen; Pantry; Some electric appliances; Electric water heater
- Bedrooms: 1 bedroom (listed as 'Other')
- Flooring: Laminate
- Bathrooms: 2 full bathrooms
- Heating & cooling: Central heating (electric); Central air conditioning (electric, one unit)
- Interior features: Ceiling fan(s); Garden tub / Roman tub; Open floorplan; Separate shower; Vanity; Walk-in closet(s); Eat-in kitchen; Kitchen and family room combo; Kitchen and dining combo; Pantry; Laminate flooring
- Laundry & utility: Washer hookup inside; Electric dryer hookup inside
Neighborhood map
What this means for you Summary
Snapshot
- This is a 3-bed/2.0-bath manufactured listed at $79k.
Deal economics
- At list price, monthly cash flow is $379 ($5k/yr) — positive.
- The deal already cash-flows at list — no discount required.
- Meets the 1% rule at list price ($1k rent vs $79k).
- Recommended offer: $78k (1.5% below list) — sets the bar for market timing.
- Cap rate 12.0% vs local median 3.7% in Victoria — top-decile yield for the area; either an underpriced asset or a hidden risk that comps aren't pricing in. Stress-test before assuming the spread holds.
Location & tenants
- Location reads 71/100 on livability (#309 in TX) — a middle-class / working-renter tenant base. Strengths: cost of living A+, housing A+, health & safety A+; Watch: crime D+, schools D, amenities F.
- Victoria ISD (urban): math 24% / reading 33% proficiency, ranked #645 of 826 in TX (top 78%) — low school quality limits family demand, transient renter base, plan for 1-2y turnover.
- Market conditions: Rents soft (-0.8%/yr); 196 active listings in the ZIP; 13 comparable units currently listed for rent nearby; rentals lingering (median 44d on market — plan ~5-8 weeks vacancy on turnover, expect pricing pressure); 100% of comp listings sitting > 30 days — soft ceiling on asking rent; 43 units permitted in Victoria County in 2024 (0 in 5+ unit buildings).
Forward outlook
- Local home prices are declining (-3.0%/yr); year-one equity from $549 of loan paydown is wiped out by about $2k of value loss. Plan a longer hold.
- Victoria County population projected at +34% by 2050 — long-run rental-demand tailwind backs the buy-and-hold thesis.
- At projected returns (-3.0% appreciation + 0.0% rent growth), your $22k cash investment doubles in ~8 years — after that, you're playing with house money.
Negotiation context
- It's been on market 16 days — a 2% lower offer ($78k) is reasonable based on typical stale-listing flexibility.
- 3 sale attempts since 8y ago; this cycle's ask has dropped $5k (6%) from the opening price — seller is motivated, your offer sets the floor, not the list.
Risks & watch-outs
- Watch-outs: property tax is 3.3% of price.
- Climate carrying-cost: severe wind risk, 99% chance of damaging wind over 30y; extreme-heat days projected 7→21/yr by 2055 (HVAC capex compounding) — expect insurance premiums to compound above CPI over the hold.
Questions for the listing agent
- Property tax is high relative to price — has the assessment been appealed recently, and will the sale trigger a re-assessment?
- Is there a deadline driving the sale (1031 exchange, divorce, estate, relocation)? That informs how much negotiation room exists.
- Schools are D-rated, which usually means shorter tenancies and higher turnover. Who's the typical renter profile here, and what's been the actual vacancy rate?
- Crime grade is D in this area — have there been break-ins, vandalism, or insurance claims at this property in the last 3 years? What carrier currently insures it and at what premium?
- What's the average days-on-market for RENTAL listings here right now (not sales)? A rising rental-DOM trend means longer vacancies and softer asking-rent achievability than the comps imply.
- What's the recent tenant-quality profile in this submarket — average credit score on applications, eviction rate, late-payment / NSF rate, and stable-employment percentage? A property-management company in the area should have these aggregated.
- How much new for-sale + rental construction is in the pipeline within 1–3 miles? Heavy new supply typically softens prices + rents 12–24 months out; constrained supply supports both.
Investment metrics
- 1% rule
- 1.67% ✓
- Cap rate
- 12.02%
- Cash-on-cash
- 20.45%
- DSCR
- 1.91
- GRM
- 5.0
CMA / ARV
No comps found within radius.
Projected returns pro-forma
-3.0% appreciation · 0.0% rent growth · sell at horizon
- IRR
- 8.9%
- Equity multiple
- 1.34×
- Total profit
- $7,483
- Equity at exit
- $11,839
- IRR
- 15.1%
- Equity multiple
- 2.03×
- Total profit
- $22,984
- Equity at exit
- $6,865
Cash invested: $22,232 (down + closing). Projections, not guarantees.
Landlord ↔ Tenant lean methodology
- Overall (STATE)
- 87 Strongly Landlord-Friendly
- State Texas
- 87 Strongly Landlord-Friendly · R+5
- County
- — inherits STATE
- City
- — inherits STATE
ZIP-level market 77901
- Rents YoY
- -0.8%
- Active inventory
- 196
- Price-to-rent
- 5.0×
Monthly cashflow live
- Estimated rent
- $1,323 high interval (Pro) →
- Mortgage (P&I)
- −$416
- Tax from tax record
- −$217 /mo · $2,600/yr
- Insurance
- −$33
- HOA
- −$0
- Vacancy / Maint / Mgmt
- −$278
- Net cashflow
- $379
Break-even live
UW: 25.0% down · 7.5% · 30yr · 1.5% tax · 5.0% vac · 8.0% maint · 8.0% mgmt
Financing live
Cash to close
- Down payment
- $19,850
- Closing costs
- $2,382
- Reserves months
- —
- Total cash needed
- —
Loan-product check · same deal, 3 products live
Conventional
25% down · 7.5% · 30yr
- Down + closing
- —
- Monthly P&I
- —
- Monthly cashflow
- —
- DSCR
- —
- Eligible?
- —
Personal DTI + credit; lowest rate.
DSCR
20% down · 8.5% · 30yr
- Down + closing
- —
- Monthly P&I
- —
- Monthly cashflow
- —
- DSCR
- —
- Eligible?
- —
No personal income docs; deal must DSCR.
Hard money
10% down · 12.0% · 12mo
- Down + closing
- —
- Monthly P&I
- —
- Monthly cashflow
- —
- DSCR
- —
- Eligible?
- —
Short-term bridge; refi at stabilization.
Rent comps 13 comps
| Address | Beds | Baths | Sqft | Rent | $/sqft | DOM | Units | Dist |
|---|---|---|---|---|---|---|---|---|
| 3001 Arroyo Dr Victoria, TX | 1.0–2.0 | 1.0–2.0 | 857 | $1,330 | $1.55 | 43d | 4 | 0.10mi |
| 305 E Sabine St Unit A Victoria, TX | 2.0 | 1.0 | 1224 | $1,150 | $0.94 | 43d | 1 | 0.89mi |
| 1906 Sam Houston Dr Victoria, TX | 1.0–2.0 | 1.0–2.0 | 678 | $1,255 | $1.85 | 43d | 9 | 0.98mi |
| 1603 E Brazos St Victoria, TX | 1.0–2.0 | 1.0 | 796 | $975 | $1.22 | 43d | 6 | 1.04mi |
| 1810 E Colorado St Victoria, TX | 1.0–3.0 | 1.0–2.0 | 907 | $1,425 | $1.57 | 43d | 8 | 1.08mi |
| 118 Milann St Unit B Victoria, TX | 3.0 | 1.0 | 936 | $1,175 | $1.26 | 43d | 1 | 1.09mi |
| 111 Monterrey Dr Unit A Victoria, TX | 2.0 | 2.0 | 1014 | $1,295 | $1.28 | 43d | 1 | 1.11mi |
| 3104 Sam Houston Dr Victoria, TX | 2.0–3.0 | 1.0–1.5 | 925 | $1,050 | $1.14 | 43d | 2 | 1.13mi |
| 114 Avant Garde Dr Victoria, TX | 3.0 | 2.0 | 1382 | $1,595 | $1.15 | 43d | 1 | 1.14mi |
| 1702 N Moody St Apt C1 Victoria, TX | 2.0 | 1.5 | 945 | $1,050 | $1.11 | 43d | 1 | 1.15mi |
| 1709 Navidad St Victoria, TX | 4.0 | 1.0 | 1457 | $1,595 | $1.09 | 43d | 1 | 1.16mi |
| 2601 Leary Ln #14 Victoria, TX | 3.0 | 2.0 | 950 | $1,195 | $1.26 | 43d | 1 | 1.36mi |
| 2406 E Mockingbird Ln Victoria, TX | 1.0–3.0 | 1.0–2.0 | 1032 | $1,300 | $1.26 | 43d | 4 | 1.41mi |
Listing history 15 events
-
2026-06-19days on market $79,400 Active 16 DOM
-
2026-06-18days on market $79,400 Active 15 DOM
-
2026-06-17days on market $79,400 Active 14 DOM
-
2026-06-16days on market $79,400 Active 13 DOM
-
2026-06-15price $79,400 Active 12 DOM
-
2026-06-15days on market $79,500 Active 12 DOM
-
2026-06-14days on market $79,500 Active 10 DOM
-
2026-06-13days on market $79,500 Active 9 DOM
-
2026-06-10days on market $79,500 Active 7 DOM
-
2026-06-09days on market $79,500 Active 6 DOM
-
2026-06-09price $79,500 Active 5 DOM
-
2026-06-08days on market $84,855 Active 5 DOM
-
2026-06-07days on market $84,855 Active 4 DOM
-
2026-06-03remarks 680-char remark
-
2026-06-03$84,855 Active 1 DOM
ⓘ Source: listings_history table (triggers on properties + properties_extension) + one-shot
backfill from property_details.listing_events for pre-trigger history.
Tax reassessment forecast TX · Resets to sale price
- Current annual tax
- $2,600 · $217/mo
- Projected year-2 tax
- $2,600 · $217/mo
- Expected delta
- $0/yr ($0/mo · 0.0%)
ⓘ Screening estimate from a state-policy table — verify with the county assessor before closing.
Climate risk First Street
- Flood 1/10 Low FEMA zone X · 0% chance over 30 yrs
- Wildfire 4/10 Moderate
- Heat 9/10 Extreme 7 d/yr ≥111°F today · 21 d/yr by 30 yrs out
- Wind 8/10 Severe 99% chance of damaging wind over 30 yrs
- Air quality 1/10 Low 0 unhealthy d/yr today · 0 by 30 yrs out
Nearby sold comps map
Loading sold comps map…
Walkable amenities ~0.75 mi
Loading nearby amenities…
Taxation est. · year 1
- Rental income
- $15,874
- − Mortgage interest
- −$4,448
- − Property taxes
- −$2,600
- − Insurance
- −$397
- − Repairs & maintenance
- −$1,270
- − Management
- −$1,270
- − Depreciation
- −$2,310
- Taxable income
- $3,580
- Est. tax owed @ 24.0%
- −$859
- After-tax cash flow
- $3,688/yr
For passive investors: Depreciation is non-cash, so a rental often shows a tax loss while cash-flowing — sheltering income. Rental losses are passive: they offset passive income freely, and up to $25,000/yr can offset ordinary (W-2) income if you actively participate and your MAGI is under $100k (phasing out to $0 by $150k); unused losses carry forward. On sale, claimed depreciation is recaptured at up to 25%, and gains may owe capital-gains tax (a 1031 exchange can defer both). Figures are a year-1 estimate at your 24.0% rate — not tax advice; consult a CPA.
Schools (NCES district)
- District
- Victoria ISD
- NCES district ID
- 4844150
- Math proficiency
- 24% ▼ -12.00%
- Reading proficiency
- 33% ▼ -2.00%
- Median HH income
- $50,534
- Composite
- 24.98/100
- National rank
- #7562
- State rank
- #645 of 826 in TX
Livability — Victoria
- Score
- 71/100
- State rank
- #309
- US rank
- #6960
Category grades
Schools grade is shown separately in the Schools card above.
Census & demographics
- Census place
- Victoria, TX
- County
- Victoria County · 69,915 people
- City population
- 69,915
- Metro
- Victoria, TX
- Population (ZIP)
- 39,854
- Household income
- $57,923
- Rent vs Own
- Severe rent burden
- 1802.0
Population outlook (Victoria County) Hauer SSP2
- Today (2025)
- 106,119 people
- By 2030
- 113,161 · +6.6%
- By 2040
- 127,402 · +20.1%
- By 2050
- 141,953 · +33.8%
- By 2075
- 179,410 · +69.1%
- By 2100
- 200,127 · +88.6%
Race, ethnicity, and origin ACS 2023
- Neighborhood character
- Predominantly Hispanic (66%)
- Race & ethnicity
- Hispanic / Latino 66% Two or more races 30% White 24% Black 7% Asian 2%
- Hispanic origin (detail)
- Mexican 60%
- Common ancestry
- Serbian 2% Lithuanian 1% Italian 1%
- Foreign-born
- 10% · Canada, China
- Languages at home
- 64% English-only · Spanish 35% Chinese 1%
Political lean MEDSL · Victoria
- 2024 margin
- Solid R (+42.6) · D 28.4% · R 71.0%
- 2008→2024 swing
- -9.0pp toward R · 2008: -33.6pp · 2024: -42.6pp
- All cycles
- 2024: R+42.6 2020: R+38.0 2016: R+40.0 2012: R+37.8 2008: R+33.6
Not yet ingested
- Civics
- —
Market trends
- HPI YoY
- ▼ -127.62%
- Current HPI
- 138.3569
- Rent YoY
- ▼ -0.79%
- Metro
- Victoria, TX
- State GDP YoY
- ▲ 3.95%
- F500 in state
- 110
Industry mix (Fortune 500 HQ in TX)
| Industry | F500 HQs | Revenue |
|---|---|---|
| Energy | 16 | $1,198B |
|
||
| Technology | 5 | $198B |
|
||
| Engineering / Construction | 4 | $72B |
|
||
| Energy Services | 3 | $60B |
|
||
| Utilities | 3 | $41B |
|
||
| Healthcare | 2 | $330B |
|
||
Price history
+17.9% since first listed6 events — show timeline
- 2026-06-03 Listed $84,855 CTXMLS
- 2019-10-07 Sold (MLS) — HARMLS
- 2019-02-18 Listed $129,900 HARMLS
- 2018-08-27 Listing Removed — CTXMLS
- 2018-08-10 Listed $72,000 CTXMLS
- 2008-05-08 Sold (Public Records) — Public Records
Property tax history
+13.4%/yrLatest (2025): $2,600 · +9.2% YoY. Source: county tax records.
Cash-flow waterfall
monthlySold comps — $/sqft
last 12 mo · ≤1 miLoading sold comps…