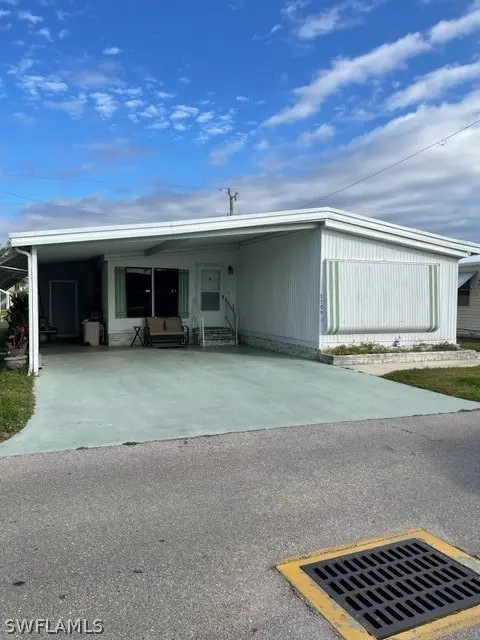
3509 Celestial Way · North Fort Myers, FL
Flood risk 1/10 · Minimal
- FEMA flood zone
- X (shaded)
- Chance of flooding over 30 yrs
- 0.0%
- Est. flood insurance / yr
- $507 – $1,088
Fire risk 5/10 · Moderate
- Est. fire insurance / yr
- $947 – $1,759
Heat risk 10/10 · Severe
- Hot days now (above 107°F)
- 7 days/yr
- Hot days in 30 yrs
- 28 days/yr
Wind risk 10/10 · Severe
- Chance of severe wind over 30 yrs
- 99.0%
Air-quality risk 2/10 · Minimal
- Unhealthy air days now
- 1 days/yr
- Unhealthy air days in 30 yrs
- 1 days/yr
Risk factors via First Street. Map © Google.
Why this score? — see what drove the C grade
The composite is a weighted blend of 9 inputs, each scored 0–100. Each bar is that input's sub-score; the figure is the points it added to the 100-point composite (weight × sub-score).
- Cash flow +28.1/30.0
- DSCR +10.0/10.0
- 1% rule +6.7/10.0
- Schools +4.1/10.0
- Livability +3.7/5.0
- Condition / age +2.5/5.0
- Rent growth +2.0/5.0
- ARV discount +0.0/15.0
- Appreciation +0.0/10.0
$140,000
🖨 Deal sheet 📄 Offer letter ✓ Due diligence
Listing remarks MLS
Great opportunity to own in this popular 55+ community.
Key facts
- New large lanai
- New vapor barrier
- New roof
Tags
Property features AI
Exterior
- Home design: Single-family house; 1,120 sq ft living area
- Exterior features: Lot of approximately 4,250 sq ft
Neighborhood map
What this means for you Summary
Snapshot
- This is a 2-bed/2.0-bath manufactured listed at $140k.
Deal economics
- At list price, monthly cash flow is $440 ($5k/yr) — positive.
- The deal already cash-flows at list — no discount required.
- Meets the 1% rule at list price ($2k rent vs $140k).
- Recommended offer: $132k (6.0% below list) — sets the bar for market timing.
- Cap rate 10.1% vs local median 3.6% in North Fort Myers — top-decile yield for the area; either an underpriced asset or a hidden risk that comps aren't pricing in. Stress-test before assuming the spread holds.
Location & tenants
- Location reads 74/100 on livability (#269 in FL, #4,409 nationally) — a middle-class / working-renter tenant base. Strengths: cost of living A+, housing A+, health & safety A+; Watch: employment C-, amenities F, commute F.
- Lee (suburban): math 47% / reading 50% proficiency, ranked #42 of 73 in FL (top 58%) — families likely to look elsewhere, expect single-tenant / working-renter base with shorter leases.
- Market conditions: Rents soft (-1.9%/yr); 472 active listings in the ZIP; 31 comparable units currently listed for rent nearby; rentals at typical pace (median 16d on market — plan ~3-4 weeks tenant-placement turnaround); 15,411 units permitted in Lee County in 2024 (4,686 in 5+ unit buildings).
- This rent runs 35% of the median local income ($57k/yr) — at the standard rent-burdened threshold; future hikes will face affordability resistance.
Forward outlook
- Local home prices are declining (-3.0%/yr); year-one equity from $968 of loan paydown is wiped out by about $4k of value loss. Plan a longer hold.
- Lee County population projected at +44% by 2050 — long-run rental-demand tailwind backs the buy-and-hold thesis.
Negotiation context
- It's been on market 76 days — a 6% lower offer ($132k) is reasonable based on typical stale-listing flexibility.
- 3 sale attempts since 4y ago with the ask held roughly flat each time — persistent listings suggest the price (not the market) is what's stuck; bring a comps-based counter.
- Current owner paid $110k; 27% above their basis — modest negotiation headroom, anchor on the comps not their cost.
Risks & watch-outs
- Climate carrying-cost: severe wind risk, 99% chance of damaging wind over 30y; moderate wildfire risk; extreme-heat days projected 7→28/yr by 2055 (HVAC capex compounding) — expect insurance premiums to compound above CPI over the hold.
Questions for the listing agent
- It's been on market 76 days. Have you received any prior offers? Is the seller open to a 6% concession, seller financing, or rate buy-down credit?
- Built in 1979 — when were the roof, HVAC, electrical panel, plumbing, and water heater last replaced?
- Why hasn't it sold? Are there any deal-killer items the seller is aware of (foundation, flood, title, zoning, code violations)?
- Is there a deadline driving the sale (1031 exchange, divorce, estate, relocation)? That informs how much negotiation room exists.
- What's the average days-on-market for RENTAL listings here right now (not sales)? A rising rental-DOM trend means longer vacancies and softer asking-rent achievability than the comps imply.
- What's the recent tenant-quality profile in this submarket — average credit score on applications, eviction rate, late-payment / NSF rate, and stable-employment percentage? A property-management company in the area should have these aggregated.
- How much new for-sale + rental construction is in the pipeline within 1–3 miles? Heavy new supply typically softens prices + rents 12–24 months out; constrained supply supports both.
Investment metrics
- 1% rule
- 1.17% ✓
- Cap rate
- 10.07%
- Cash-on-cash
- 13.48%
- DSCR
- 1.60
- GRM
- 7.1
CMA / ARV
- ARV (on-the-fly)
- $114,240
- Comps found
- 12
Show comp detail 12 sales within ~0.75 mi
| Address | Dist | Beds/Ba | Sqft | Sold | Price | $/sf | Match |
|---|---|---|---|---|---|---|---|
| 3204 Pluto Cir | 0.26mi | 2/2.0 | 1,104 (-1%) | 7mo | $110,000 | $100 | 80 |
| 3500 Celestial Way | 0.03mi | 2/2.0 | 1,100 (-2%) | 24mo | $85,000 | $77 | 76 |
| 3167 Pluto Cir | 0.18mi | 2/2.0 | 1,150 (+3%) | 15mo | $126,000 | $110 | 74 |
| 9250 Caloosa Dr | 0.38mi | 2/2.0 | 1,149 (+3%) | 17mo | $139,500 | $121 | 64 |
| 16042 Citron Way | 0.20mi | 2/2.0 | 1,288 (+15%) | 4mo | $132,000 | $102 | 62 |
| 16034 Citron Way | 0.19mi | 2/2.0 | 960 (-14%) | 7mo | $125,000 | $130 | 62 |
| 16041 Citron Way | 0.22mi | 2/2.0 | 960 (-14%) | 6mo | $92,000 | $96 | 61 |
| 170 Lakeside Dr | 0.45mi | 2/2.0 | 1,196 (+7%) | 14mo | $79,000 | $66 | 56 |
| 9209 Bonita Dr | 0.32mi | 2/2.0 | 1,274 (+14%) | 14mo | $135,000 | $106 | 50 |
| 486 Horizon Dr | 0.71mi | 2/2.0 | 1,080 (-4%) | 13mo | $110,000 | $102 | 50 |
| 612 Sunrise Ave | 0.70mi | 2/2.0 | 1,049 (-6%) | 13mo | $173,000 | $165 | 46 |
| 516 Horizon Dr | 0.69mi | 2/2.0 | 1,198 (+7%) | 14mo | $119,500 | $100 | 45 |
Match score weights: distance 35% · size 25% · config 20% · recency 20%. Top-matched comps best support the ARV.
Projected returns pro-forma
-3.0% appreciation · 0.0% rent growth · sell at horizon
- IRR
- 0.3%
- Equity multiple
- 1.01×
- Total profit
- $504
- Equity at exit
- $20,874
- IRR
- 6.9%
- Equity multiple
- 1.45×
- Total profit
- $17,793
- Equity at exit
- $12,105
Cash invested: $39,200 (down + closing). Projections, not guarantees.
Landlord ↔ Tenant lean methodology
- Overall (STATE)
- 87 Strongly Landlord-Friendly
- State Florida
- 87 Strongly Landlord-Friendly · R+3
- County
- — inherits STATE
- City
- — inherits STATE
ZIP-level market 33903
- Rents YoY
- -1.9%
- Active inventory
- 472
- Price-to-rent
- 7.1×
Monthly cashflow live
- Estimated rent
- $1,640 high interval (Pro) →
- Mortgage (P&I)
- −$734
- Tax from tax record
- −$63 /mo · $752/yr
- Insurance
- −$58
- HOA
- −$0
- Vacancy / Maint / Mgmt
- −$344
- Net cashflow
- $440
Break-even live
UW: 25.0% down · 7.5% · 30yr · 1.5% tax · 5.0% vac · 8.0% maint · 8.0% mgmt
Financing live
Cash to close
- Down payment
- $35,000
- Closing costs
- $4,200
- Reserves months
- —
- Total cash needed
- —
Loan-product check · same deal, 3 products live
Conventional
25% down · 7.5% · 30yr
- Down + closing
- —
- Monthly P&I
- —
- Monthly cashflow
- —
- DSCR
- —
- Eligible?
- —
Personal DTI + credit; lowest rate.
DSCR
20% down · 8.5% · 30yr
- Down + closing
- —
- Monthly P&I
- —
- Monthly cashflow
- —
- DSCR
- —
- Eligible?
- —
No personal income docs; deal must DSCR.
Hard money
10% down · 12.0% · 12mo
- Down + closing
- —
- Monthly P&I
- —
- Monthly cashflow
- —
- DSCR
- —
- Eligible?
- —
Short-term bridge; refi at stabilization.
Rent comps 31 comps
| Address | Beds | Baths | Sqft | Rent | $/sqft | DOM | Units | Dist |
|---|---|---|---|---|---|---|---|---|
| 3404 Rainbow Ln North Fort Myers, FL | 2.0 | 2.0 | 1056 | $1,800 | $1.70 | 3d | 1 | 0.11mi |
| 28 Nyborg Ave North Fort Myers, FL | 3.0 | 2.0 | 1042 | $1,299 | $1.25 | 14d | 1 | 0.39mi |
| 8791 Littleton Rd North Fort Myers, FL | 2.0 | 2.0 | 1074 | $1,549 | $1.44 | 24d | 1 | 0.68mi |
| 2774 Wedgewood Dr North Fort Myers, FL | 2.0 | 2.0 | 880 | $1,300 | $1.48 | 24d | 1 | 0.71mi |
| 266 Mongoose Ln #266 North Fort Myers, FL | 3.0 | 2.0 | 1372 | $1,499 | $1.09 | 3d | 1 | 0.79mi |
| 571 Sunrise Ln North Fort Myers, FL | 2.0 | 2.0 | 1004 | $1,400 | $1.39 | 24d | 1 | 0.82mi |
| 4120 Pine Drop Ln North Fort Myers, FL | 3.0 | 2.0 | 957 | $1,895 | $1.98 | 24d | 1 | 0.93mi |
| 3260 Stockton St North Fort Myers, FL | 3.0 | 1.0–2.0 | 976 | $2,371 | $2.43 | 2d | 27 | 1.15mi |
| 2095 Eloise Cir North Fort Myers, FL | 2.0 | 1.0 | 840 | $1,295 | $1.54 | 24d | 1 | 1.16mi |
| 535 Zebra Dr #535 North Fort Myers, FL | 3.0 | 2.0 | 1352 | $1,499 | $1.11 | 14d | 1 | 1.18mi |
| 2027 Eloise Cir North Fort Myers, FL | 2.0 | 1.0 | 822 | $1,300 | $1.58 | 3d | 1 | 1.18mi |
| 3957 Pomodoro Cir #301 Cape Coral, FL | 2.0 | 2.0 | 1270 | $1,450 | $1.14 | 16d | 1 | 1.18mi |
| 3953 Pomodoro Cir Cape Coral, FL | 1.0–3.0 | 1.0–2.0 | 1044 | $1,462 | $1.40 | 14d | 9 | 1.20mi |
| 3961 Pomodoro Cir #204 Cape Coral, FL | 2.0 | 2.0 | 1270 | $1,450 | $1.14 | 24d | 1 | 1.22mi |
| 3961 Pomodoro Cir #204 Cape Coral, FL | 2.0 | 2.0 | 1270 | $1,450 | $1.14 | 16d | 1 | 1.22mi |
| 3940 Villa Del Mar CIR Cape Coral, FL | 1.0–3.0 | 1.0–2.0 | 1051 | $2,116 | $2.01 | 2d | 21 | 1.27mi |
| 3944 Pomodoro Cir #202 Cape Coral, FL | 3.0 | 2.0 | 1411 | $2,200 | $1.56 | 24d | 1 | 1.28mi |
| 2904 Tuscan Dr #303 Cape Coral, FL | 2.0 | 2.0 | 1460 | $1,450 | $0.99 | 24d | 1 | 1.30mi |
| 538 State St North Fort Myers, FL | 3.0 | 1.5 | 1000 | $1,199 | $1.20 | 24d | 1 | 1.30mi |
| 16363 Teresa Ln North Fort Myers, FL | 2.0 | 1.0 | 1000 | $1,000 | $1.00 | 24d | 1 | 1.30mi |
| 3940 Pomodoro Cir Cape Coral, FL | 2.0 | 2.0 | 1270 | $1,475 | $1.16 | 3d | 2 | 1.30mi |
| 2700 Diplomat Pkwy E Cape Coral, FL | 1.0–3.0 | 1.0–2.0 | 1116 | $2,382 | $2.13 | 3d | 41 | 1.31mi |
| 3968 Pomodoro Cir #202 Cape Coral, FL | 2.0 | 2.0 | 1469 | $1,475 | $1.00 | 14d | 1 | 1.31mi |
| 3973 Pomodoro Cir Cape Coral, FL | 2.0 | 2.0 | 1469 | $1,498 | $1.02 | 24d | 2 | 1.33mi |
| 3973 Pomodoro Cir Cape Coral, FL | 2.0 | 2.0 | 1534 | $1,575 | $1.03 | 3d | 3 | 1.33mi |
| 2909 Tuscan Dr Cape Coral, FL | 2.0 | 2.0 | 1469 | $1,475 | $1.00 | 24d | 2 | 1.34mi |
| 2913 Tuscan Dr #102 Cape Coral, FL | 2.0 | 2.0 | 1469 | $1,450 | $0.99 | 24d | 1 | 1.34mi |
| 260 Stockton St North Fort Myers, FL | 2.0 | 2.0 | 924 | $1,200 | $1.30 | 3d | 1 | 1.35mi |
| 248 Stockton St North Fort Myers, FL | 3.0 | 2.0 | 924 | $1,300 | $1.41 | 24d | 1 | 1.36mi |
| 247 Stockton St North Fort Myers, FL | 3.0 | 2.0 | 924 | $1,325 | $1.43 | 24d | 1 | 1.38mi |
| 446 San Bernardino St North Fort Myers, FL | 2.0 | 1.0 | 1104 | $1,590 | $1.44 | 10d | 1 | 1.46mi |
Listing history 11 events
-
2026-06-01days on market $140,000 Active 76 DOM
-
2026-06-01days on market $140,000 Active 75 DOM
-
2026-03-17$140,000 Active
-
2024-07-25soldstatus $110,000
-
2022-03-17soldstatus $90,000
-
2022-03-16soldstatus $90,000 Closed 55-char remark
Show marketing remark (55 chars)
Great opportunity to own in this popular 55+ community.
-
2022-02-17status Pending 55-char remark
Show marketing remark (55 chars)
Great opportunity to own in this popular 55+ community.
-
2022-02-16status Active 55-char remark
Show marketing remark (55 chars)
Great opportunity to own in this popular 55+ community.
-
2022-02-16price $95,000 55-char remark
Show marketing remark (55 chars)
Great opportunity to own in this popular 55+ community.
-
2022-01-13status Pending 55-char remark
Show marketing remark (55 chars)
Great opportunity to own in this popular 55+ community.
-
2022-01-11$110,000 Active 55-char remark
Show marketing remark (55 chars)
Great opportunity to own in this popular 55+ community.
ⓘ Source: listings_history table (triggers on properties + properties_extension) + one-shot
backfill from property_details.listing_events for pre-trigger history.
Tax reassessment forecast FL · Resets to sale price
- Current annual tax
- $752 · $63/mo
- Projected year-2 tax
- $1,162 · $97/mo
- Expected delta
- +$410/yr (+$34/mo · 54.6%)
ⓘ Screening estimate from a state-policy table — verify with the county assessor before closing.
Climate risk First Street
- Flood 1/10 Low FEMA zone X (shaded) · 0% chance over 30 yrs
- Wildfire 5/10 Major
- Heat 10/10 Extreme 7 d/yr ≥107°F today · 28 d/yr by 30 yrs out
- Wind 10/10 Extreme 99% chance of damaging wind over 30 yrs
- Air quality 2/10 Low 1 unhealthy d/yr today · 1 by 30 yrs out
Nearby sold comps map
Loading sold comps map…
Walkable amenities ~0.75 mi
Loading nearby amenities…
Taxation est. · year 1
- Rental income
- $19,677
- − Mortgage interest
- −$7,842
- − Property taxes
- −$752
- − Insurance
- −$700
- − Repairs & maintenance
- −$1,574
- − Management
- −$1,574
- − Depreciation
- −$4,073
- Taxable income
- $3,162
- Est. tax owed @ 24.0%
- −$759
- After-tax cash flow
- $4,524/yr
For passive investors: Depreciation is non-cash, so a rental often shows a tax loss while cash-flowing — sheltering income. Rental losses are passive: they offset passive income freely, and up to $25,000/yr can offset ordinary (W-2) income if you actively participate and your MAGI is under $100k (phasing out to $0 by $150k); unused losses carry forward. On sale, claimed depreciation is recaptured at up to 25%, and gains may owe capital-gains tax (a 1031 exchange can defer both). Figures are a year-1 estimate at your 24.0% rate — not tax advice; consult a CPA.
Schools (NCES district)
- District
- Lee
- NCES district ID
- 1201080
- Math proficiency
- 47% ▼ -11.00%
- Reading proficiency
- 50% ▼ -4.00%
- Median HH income
- $49,518
- Composite
- 41.49/100
- National rank
- #3458
- State rank
- #42 of 73 in FL
Livability — North Fort Myers
- Score
- 74/100
- State rank
- #269
- US rank
- #4409
Category grades
Schools grade is shown separately in the Schools card above.
Census & demographics
- Census place
- North Fort Myers, FL
- County
- Lee County · 788,662 people
- City population
- 57,035
- Metro
- Cape Coral-Fort Myers, FL
- Population (ZIP)
- 23,655
- Household income
- $56,993
- Rent vs Own
- Severe rent burden
- 468.0
Population outlook (Lee County) Hauer SSP2
- Today (2025)
- 871,946 people
- By 2030
- 955,468 · +9.6%
- By 2040
- 1,113,587 · +27.7%
- By 2050
- 1,256,891 · +44.1%
- By 2075
- 1,560,270 · +78.9%
- By 2100
- 1,726,848 · +98.0%
Race, ethnicity, and origin ACS 2023
- Neighborhood character
- Predominantly White (81%)
- Race & ethnicity
- White 81% Hispanic / Latino 14% Two or more races 8% Black 2%
- Hispanic origin (detail)
- Mexican 3% Puerto Rican 3% Cuban 3%
- Common ancestry
- Lithuanian 4% Romanian 4% Italian 3%
- Foreign-born
- 11% · Canada
- Languages at home
- 88% English-only · Spanish 9% Other Indo-European 1%
Political lean MEDSL · Lee
- 2024 margin
- Strong R (+28.4) · D 35.5% · R 63.9%
- 2008→2024 swing
- -18.0pp toward R · 2008: -10.4pp · 2024: -28.4pp
- All cycles
- 2024: R+28.4 2020: R+19.2 2016: R+20.4 2012: R+16.6 2008: R+10.4
Not yet ingested
- Civics
- —
Market trends
- HPI YoY
- ▼ -172.26%
- Current HPI
- 256.773
- Rent YoY
- ▼ -1.94%
- Metro
- Cape Coral-Fort Myers, FL
- State GDP YoY
- ▲ 3.28%
- F500 in state
- 36
Industry mix (Fortune 500 HQ in FL)
| Industry | F500 HQs | Revenue |
|---|---|---|
| Industrial Technology | 2 | $29B |
|
||
| Insurance | 2 | $17B |
|
||
| Retail | 1 | $60B |
|
||
| Technology Distribution | 1 | $58B |
|
||
| Homebuilding | 1 | $35B |
|
||
| Technology Manufacturing | 1 | $35B |
|
||
Price history
+27.3% since first listed9 events — show timeline
- 2026-03-17 Listed $140,000 ForSaleByOwner.com
- 2024-07-25 Sold (Public Records) $110,000 Public Records
- 2022-03-17 Sold (Public Records) $90,000 Public Records
- 2022-03-16 Sold (MLS) $90,000 FORTMLS
- 2022-02-17 Pending — FORTMLS
- 2022-02-16 Relisted — FORTMLS
- 2022-02-16 Price Changed $95,000 FORTMLS
- 2022-01-13 Pending — FORTMLS
- 2022-01-11 Listed $110,000 FORTMLS
Property tax history
+13.0%/yrLatest (2025): $752 · -48.0% YoY. Source: county tax records.
Cash-flow waterfall
monthlySold comps — $/sqft
last 12 mo · ≤1 miLoading sold comps…