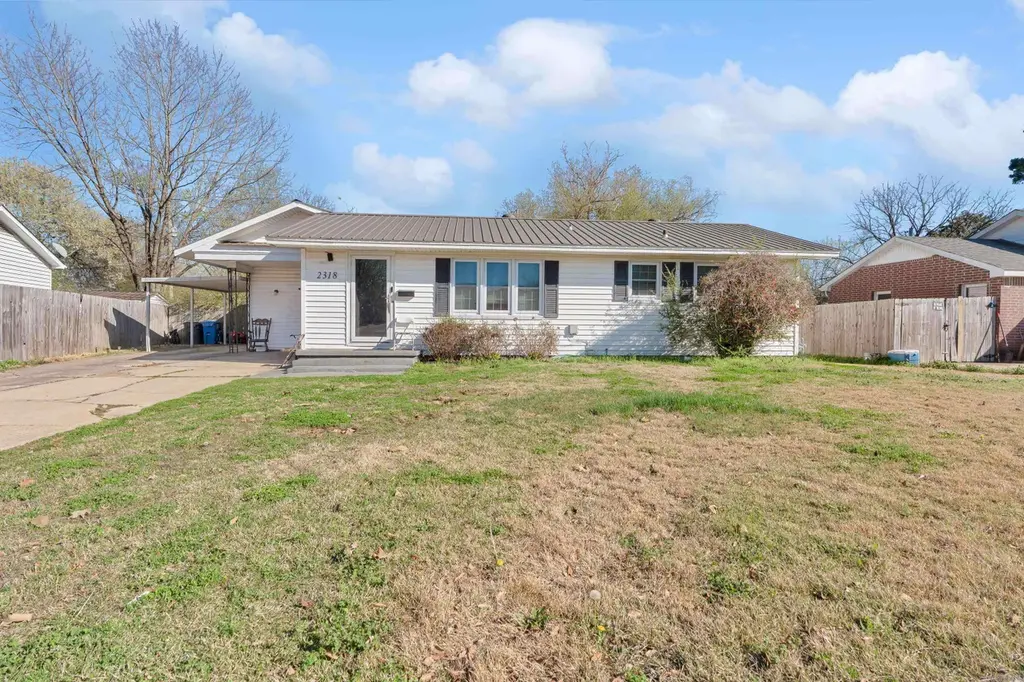
2318 Circle Dr · Jonesboro, AR
Flood risk 1/10 · Minimal
- FEMA flood zone
- X
- Chance of flooding over 30 yrs
- 0.0%
- Est. flood insurance / yr
- $507 – $1,088
Fire risk 3/10 · Minor
- Est. fire insurance / yr
- $1,499 – $2,785
Heat risk 6/10 · Moderate
- Hot days now (above 109°F)
- 7 days/yr
- Hot days in 30 yrs
- 21 days/yr
Wind risk 4/10 · Minor
- Chance of severe wind over 30 yrs
- 8.0%
Air-quality risk 1/10 · Minimal
- Unhealthy air days now
- 0 days/yr
- Unhealthy air days in 30 yrs
- 0 days/yr
Risk factors via First Street. Map © Google.
Why this score? — see what drove the D+ grade
The composite is a weighted blend of 9 inputs, each scored 0–100. Each bar is that input's sub-score; the figure is the points it added to the 100-point composite (weight × sub-score).
- Cash flow +15.6/30.0
- ARV discount +10.8/15.0
- DSCR +4.8/10.0
- 1% rule +4.3/10.0
- Rent growth +3.4/5.0
- Livability +3.2/5.0
- Condition / age +2.5/5.0
- Schools +2.3/10.0
- Appreciation +0.0/10.0
$154,900
🖨 Deal sheet (PDF) 📄 Offer letter ✓ Due diligence
Listing remarks MLS
Welcome to 2318 Circle Dr. in Jonesboro, a well-maintained home offering comfort, space, and great updates in a convenient location. This 3-bedroom, 2-bath home also features a bonus room currently being used as a 4th bedroom, providing flexible space for guests, a home office, or playroom. Inside, you'll find a functional layout with an inviting living area and a kitchen equipped with stainless steel appliances. Major updates include a new HVAC system and a durable metal roof, giving buyers peace of mind for years to come. Step outside to enjoy the fenced backyard, perfect for pets, kids, or relaxing evenings outdoors. Located in the Jonesboro School District, this home offers a great combination of location, space, and value. Don't miss your chance to make this home yoursschedule your private showing today!
Key facts
- Durable metal roof
- Bonus room
- Fenced backyard
Tags
Property features AI
Exterior
- Parking: Carport for 1 car
- Utilities: Public sewer; Public water; Natural gas
- Home design: Single-family property; Approximately 1,505 square feet
- Construction: Crawl space foundation
- Exterior features: Metal/vinyl siding; Metal roof; Paved road access; Located on a cul-de-sac; Inside city limits
Interior
- Kitchen: Microwave; Gas range; Dishwasher
- Flooring: Wood flooring; Laminate flooring
- Bathrooms: 2 full bathrooms
- Heating & cooling: Central electric heating; Central electric cooling
- Interior features: Wood and laminate flooring; Bonus room
Neighborhood map
What this means for you Summary
Snapshot
- This is a 3-bed/1.5-bath single-family listed at $155k.
Deal economics
- At list price, monthly cash flow is $64 ($768/yr) — positive.
- The deal already cash-flows at list — no discount required.
- To meet the 1% rule (rent ≥ 1% of price), the offer needs to be $144k (7.3% below list).
- Recommended offer: $141k (9.0% below list) — sets the bar for market timing.
- Cap rate 6.8% vs local median 4.4% in Jonesboro — top-decile yield for the area; either an underpriced asset or a hidden risk that comps aren't pricing in. Stress-test before assuming the spread holds.
Location & tenants
- Location reads 65/100 on livability (#145 in AR) — a middle-class / working-renter tenant base. Strengths: cost of living A+, housing A+, health & safety A+; Watch: crime F, amenities F, commute F.
- Jonesboro School District (urban): math 28% / reading 28% proficiency, ranked #169 of 238 in AR (top 71%) — low school quality limits family demand, transient renter base, plan for 1-2y turnover; 67% free/reduced lunch — lower-income household profile, screen leases tightly.
- Zoned schools: Kindergarten Center (503 students, 100% FRL); Annie Camp Jr. High School (math 22% / reading 34%, grade F, #150 of 201 statewide, top 76%, 784 students, 100% FRL) — zoned schools average 100% FRL vs 67% district-wide (33 pts higher); higher-poverty schools than district average — tighter screening recommended.
- Market conditions: Rents rising (+3.6%/yr); 301 active listings in the ZIP; 926 units permitted in Craighead County in 2024 (69 in 5+ unit buildings).
- This rent runs 38% of the median local income ($45k/yr) — at the standard rent-burdened threshold; future hikes will face affordability resistance.
Forward outlook
- Local home prices are declining (-3.0%/yr); year-one equity from $1k of loan paydown is wiped out by about $5k of value loss. Plan a longer hold.
- Craighead County population projected at +38% by 2050 — long-run rental-demand tailwind backs the buy-and-hold thesis.
Negotiation context
- It's been on market 97 days — a 9% lower offer ($141k) is reasonable based on typical stale-listing flexibility.
- 3 sale attempts since 6y ago with the ask held roughly flat each time — persistent listings suggest the price (not the market) is what's stuck; bring a comps-based counter.
Risks & watch-outs
- Climate carrying-cost: extreme-heat days projected 7→21/yr by 2055 (HVAC capex compounding) — expect insurance premiums to compound above CPI over the hold.
Questions for the listing agent
- It's been on market 97 days. Have you received any prior offers? Is the seller open to a 9% concession, seller financing, or rate buy-down credit?
- Why hasn't it sold? Are there any deal-killer items the seller is aware of (foundation, flood, title, zoning, code violations)?
- Is there a deadline driving the sale (1031 exchange, divorce, estate, relocation)? That informs how much negotiation room exists.
- Schools are D-rated, which usually means shorter tenancies and higher turnover. Who's the typical renter profile here, and what's been the actual vacancy rate?
- Crime grade is F in this area — have there been break-ins, vandalism, or insurance claims at this property in the last 3 years? What carrier currently insures it and at what premium?
- The area grade is low — what's the realistic commute time and amenity access for the typical tenant pool here? Any planned neighborhood developments (good or bad) we should know about?
- What's the average days-on-market for RENTAL listings here right now (not sales)? A rising rental-DOM trend means longer vacancies and softer asking-rent achievability than the comps imply.
- What's the recent tenant-quality profile in this submarket — average credit score on applications, eviction rate, late-payment / NSF rate, and stable-employment percentage? A property-management company in the area should have these aggregated.
- How much new for-sale + rental construction is in the pipeline within 1–3 miles? Heavy new supply typically softens prices + rents 12–24 months out; constrained supply supports both.
Investment metrics
- 1% rule
- 0.93% ✗
- Cap rate
- 6.79%
- Cash-on-cash
- 1.77%
- DSCR
- 1.08
- GRM
- 9.0
CMA / ARV
- ARV (on-the-fly)
- $167,055
- Comps found
- 12
Show comp detail 12 sales within ~0.75 mi
| Address | Dist | Beds/Ba | Sqft | Sold | Price | $/sf | Match |
|---|---|---|---|---|---|---|---|
| 901 Valley Dr | 0.45mi | 3/1.5 | 1,452 (-4%) | 1mo | $167,000 | $115 | 72 |
| 2305 Anne | 0.35mi | 4/2.0 (+1) | 1,504 (-0%) | 5mo | $145,000 | $96 | 72 |
| 700 Amberwood | 0.50mi | 3/2.0 | 1,487 (-1%) | 3mo | $165,000 | $111 | 70 |
| 703 Valley Dr | 0.11mi | 2/1.0 (-1) | 1,308 (-13%) | 0mo | $174,000 | $133 | 66 |
| 1617 Ethel St | 0.51mi | 3/2.0 | 1,560 (+4%) | 3mo | $169,000 | $108 | 66 |
| 2101 Hampton Dr | 0.25mi | 3/2.0 | 1,645 (+9%) | 7mo | $105,000 | $64 | 65 |
| 1109 Owens Ave | 0.39mi | 3/2.0 | 1,654 (+10%) | 2mo | $165,000 | $100 | 61 |
| 1004 Rosemond Ave | 0.58mi | 3/2.0 | 1,432 (-5%) | 3mo | $185,000 | $129 | 60 |
| 1506 Lamar Place Pl | 0.64mi | 2/1.5 (-1) | 1,502 (-0%) | 8mo | $205,000 | $136 | 58 |
| 1817 Greenwood St | 0.55mi | 3/2.0 | 1,619 (+8%) | 2mo | $110,000 | $68 | 58 |
| 1517 Alonzo St | 0.64mi | 3/1.0 | 1,599 (+6%) | 7mo | $175,000 | $109 | 52 |
| 1809 Crestview St | 0.71mi | 3/1.5 | 1,371 (-9%) | 8mo | $165,000 | $120 | 45 |
Match score weights: distance 35% · size 25% · config 20% · recency 20%. Top-matched comps best support the ARV.
Projected returns pro-forma
-3.0% appreciation · 3.64% rent growth · sell at horizon
- IRR
- -12.8%
- Equity multiple
- 0.54×
- Total profit
- $-20,072
- Equity at exit
- $23,096
- IRR
- -2.8%
- Equity multiple
- 0.81×
- Total profit
- $-8,274
- Equity at exit
- $13,393
Cash invested: $43,372 (down + closing). Projections, not guarantees.
Landlord ↔ Tenant lean methodology
- Overall (STATE)
- 92 Strongly Landlord-Friendly
- State Arkansas
- 92 Strongly Landlord-Friendly · R+14
- County
- — inherits STATE
- City
- — inherits STATE
ZIP-level market 72401
- Home prices YoY
- -34.2%
- Rents YoY
- 3.6%
- Active inventory
- 301
- Price-to-rent
- 9.0×
Monthly cashflow live
- Estimated rent
- $1,436 medium interval (Pro) →
- Mortgage (P&I)
- −$812
- Tax est. 1.5%
- −$194 /mo · $2,324/yr
- Insurance
- −$65
- HOA
- −$0
- Vacancy / Maint / Mgmt
- −$302
- Net cashflow
- $64
Break-even live
Sensitivity live
| Price | -10% $171 | -5% $118 | +0% $64 | +5% $10 | +10% $-43 |
|---|---|---|---|---|---|
| Rent | -10% $-49 | -5% $7 | +0% $64 | +5% $121 | +10% $177 |
| Rate | -1.0pp $142 | -0.5pp $103 | base $64 | +0.5pp $24 | +1.0pp $-17 |
UW: 25.0% down · 7.5% · 30yr · 1.5% tax · 5.0% vac · 8.0% maint · 8.0% mgmt
Financing live
Cash to close
- Down payment
- $38,725
- Closing costs
- $4,647
- Reserves months
- —
- Total cash needed
- —
Loan-product check · same deal, 3 products live
Conventional
25% down · 7.5% · 30yr
- Down + closing
- —
- Monthly P&I
- —
- Monthly cashflow
- —
- DSCR
- —
- Eligible?
- —
Personal DTI + credit; lowest rate.
DSCR
20% down · 8.5% · 30yr
- Down + closing
- —
- Monthly P&I
- —
- Monthly cashflow
- —
- DSCR
- —
- Eligible?
- —
No personal income docs; deal must DSCR.
Hard money
10% down · 12.0% · 12mo
- Down + closing
- —
- Monthly P&I
- —
- Monthly cashflow
- —
- DSCR
- —
- Eligible?
- —
Short-term bridge; refi at stabilization.
Listing history 24 events
-
2026-06-19status $154,900 Under Contract 97 DOM
-
2026-06-18days on market $154,900 Active 97 DOM
-
2026-06-17days on market $154,900 Active 96 DOM
-
2026-06-16days on market $154,900 Active 95 DOM
-
2026-06-15days on market $154,900 Active 94 DOM
-
2026-06-14days on market $154,900 Active 92 DOM
-
2026-06-13days on market $154,900 Active 91 DOM
-
2026-06-10days on market $154,900 Active 89 DOM
-
2026-06-09days on market $154,900 Active 88 DOM
-
2026-06-08days on market $154,900 Active 87 DOM
-
2026-06-07days on market $154,900 Active 86 DOM
-
2026-06-05days on market $154,900 Active 83 DOM
-
2026-06-02days on market $154,900 Active 81 DOM
-
2026-06-01days on market $154,900 Active 80 DOM
-
2026-05-31days on market $154,900 Active 79 DOM
-
2026-05-30days on market $154,900 Active 78 DOM
-
2026-03-13$154,900 New Listing
Show marketing remark (820 chars)
Welcome to 2318 Circle Dr. in Jonesboro, a well-maintained home offering comfort, space, and great updates in a convenient location. This 3-bedroom, 2-bath home also features a bonus room currently being used as a 4th bedroom, providing flexible space for guests, a home office, or playroom. Inside, you'll find a functional layout with an inviting living area and a kitchen equipped with stainless steel appliances. Major updates include a new HVAC system and a durable metal roof, giving buyers peace of mind for years to come. Step outside to enjoy the fenced backyard, perfect for pets, kids, or relaxing evenings outdoors. Located in the Jonesboro School District, this home offers a great combination of location, space, and value. Don't miss your chance to make this home yoursschedule your private showing today!
-
2026-03-13$154,900 Active 820-char remark
Show marketing remark (820 chars)
Welcome to 2318 Circle Dr. in Jonesboro, a well-maintained home offering comfort, space, and great updates in a convenient location. This 3-bedroom, 2-bath home also features a bonus room currently being used as a 4th bedroom, providing flexible space for guests, a home office, or playroom. Inside, you'll find a functional layout with an inviting living area and a kitchen equipped with stainless steel appliances. Major updates include a new HVAC system and a durable metal roof, giving buyers peace of mind for years to come. Step outside to enjoy the fenced backyard, perfect for pets, kids, or relaxing evenings outdoors. Located in the Jonesboro School District, this home offers a great combination of location, space, and value. Don't miss your chance to make this home yoursschedule your private showing today!
-
2020-09-09soldstatus $145,900
-
2020-09-08soldstatus $145,900
-
2020-08-06$145,900
-
2017-10-25soldstatus $115,000
-
2016-06-28soldstatus $70,000
-
1997-03-10soldstatus $50,000
ⓘ Source: listings_history table (triggers on properties + properties_extension) + one-shot
backfill from property_details.listing_events for pre-trigger history.
Climate risk First Street
- Flood 1/10 Low FEMA zone X · 0% chance over 30 yrs
- Wildfire 3/10 Moderate
- Heat 6/10 Major 7 d/yr ≥109°F today · 21 d/yr by 30 yrs out
- Wind 4/10 Moderate 8% chance of damaging wind over 30 yrs
- Air quality 1/10 Low 0 unhealthy d/yr today · 0 by 30 yrs out
Nearby sold comps map
Loading sold comps map…
Walkable amenities ~0.75 mi
Loading nearby amenities…
Taxation est. · year 1
- Rental income
- $17,232
- − Mortgage interest
- −$8,677
- − Property taxes
- −$2,324
- − Insurance
- −$774
- − Repairs & maintenance
- −$1,379
- − Management
- −$1,379
- − Depreciation
- −$4,506
- Taxable loss
- −$1,806
- Est. tax savings @ 24.0%
- +$433
- After-tax cash flow
- $1,201/yr
For passive investors: Depreciation is non-cash, so a rental often shows a tax loss while cash-flowing — sheltering income. Rental losses are passive: they offset passive income freely, and up to $25,000/yr can offset ordinary (W-2) income if you actively participate and your MAGI is under $100k (phasing out to $0 by $150k); unused losses carry forward. On sale, claimed depreciation is recaptured at up to 25%, and gains may owe capital-gains tax (a 1031 exchange can defer both). Figures are a year-1 estimate at your 24.0% rate — not tax advice; consult a CPA.
Schools (NCES district)
- District
- Jonesboro School District
- NCES district ID
- 0508280
- Math proficiency
- 28% ▼ -9.00%
- Reading proficiency
- 28% ▼ -8.00%
- Median HH income
- $34,347
- Composite
- 23.06/100
- National rank
- #7967
- State rank
- #169 of 238 in AR
Livability — Jonesboro
- Score
- 65/100
- State rank
- #145
- US rank
- #12692
Category grades
Schools grade is shown separately in the Schools card above.
Census & demographics
- Census place
- Jonesboro, AR
- County
- Craighead County · 97,185 people
- City population
- 91,245
- Metro
- Jonesboro, AR
- Population (ZIP)
- 42,602
- Household income
- $45,329
- Rent vs Own
- Severe rent burden
- 2606.0
Population outlook (Craighead County) Hauer SSP2
- Today (2025)
- 122,235 people
- By 2030
- 131,338 · +7.4%
- By 2040
- 149,862 · +22.6%
- By 2050
- 168,034 · +37.5%
- By 2075
- 208,094 · +70.2%
- By 2100
- 233,251 · +90.8%
Race, ethnicity, and origin ACS 2023
- Neighborhood character
- Diverse neighborhood (Simpson 0.56)
- Race & ethnicity
- White 60% Black 26% Hispanic / Latino 9% Two or more races 7%
- Hispanic origin (detail)
- Mexican 8%
- Common ancestry
- Slovak 2% Italian 1% Lithuanian 1%
- Foreign-born
- 4% · Canada
- Languages at home
- 92% English-only · Spanish 7%
Political lean MEDSL · Craighead
- 2024 margin
- Solid R (+37.4) · D 30.1% · R 67.5% · Other 2.4%
- 2008→2024 swing
- -12.9pp toward R · 2008: -24.5pp · 2024: -37.4pp
- All cycles
- 2024: R+37.4 2020: R+35.4 2016: R+35.2 2012: R+31.1 2008: R+24.5
Not yet ingested
- Civics
- —
Market trends
- HPI YoY
- ▼ -108.25%
- Current HPI
- 208.2079
- Rent YoY
- ▲ 3.64%
- Metro
- Jonesboro, AR
- State GDP YoY
- ▲ 3.80%
- F500 in state
- 10
Industry mix (Fortune 500 HQ in AR)
| Industry | F500 HQs | Revenue |
|---|---|---|
| Retail | 1 | $681B |
|
||
| Food / Agriculture | 1 | $53B |
|
||
| Retail / Energy | 1 | $22B |
|
||
| Transportation / Logistics | 1 | $12B |
|
||
| Energy | 1 | $4B |
|
||
Price history
+209.8% since first listed8 events — show timeline
- 2026-03-13 Listed $154,900 NEABOR MLS
- 2026-03-13 Listed $154,900 CARMLS
- 2020-09-09 Sold (Public Records) $145,900 Public Records
- 2020-09-08 Sold (MLS) $145,900 NEABOR MLS
- 2020-08-06 Listed $145,900 NEABOR MLS
- 2017-10-25 Sold (Public Records) $115,000 Public Records
- 2016-06-28 Sold (Public Records) $70,000 Public Records
- 1997-03-10 Sold (Public Records) $50,000 Public Records
Property tax history
-8.1%/yrLatest (2025): $86 · -45.5% YoY. Source: county tax records.
Cash-flow waterfall
monthlySold comps — $/sqft
last 12 mo · ≤1 miLoading sold comps…