 Fourplex
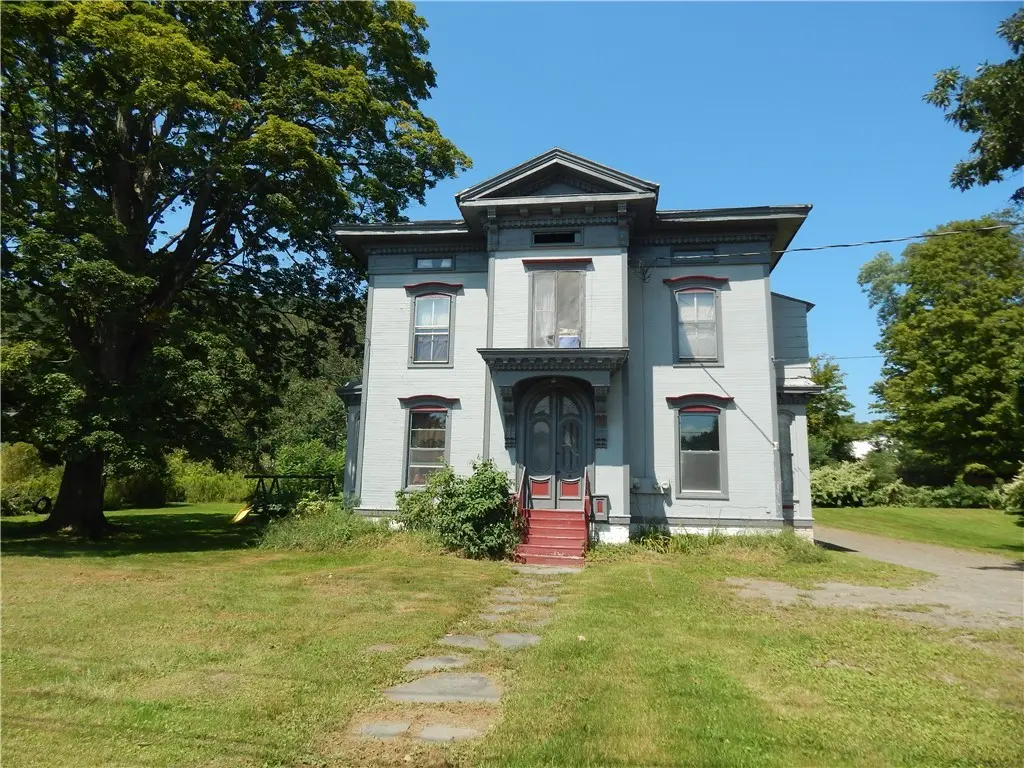
6165 State Highway 7 · Portlandville, NY
Flood risk 1/10 · Minimal
- FEMA flood zone
- X (unshaded)
- Chance of flooding over 30 yrs
- 0.0%
- Est. flood insurance / yr
- $473 – $860
Fire risk 1/10 · Minimal
- Est. fire insurance / yr
- $691 – $1,283
Heat risk 2/10 · Minimal
- Hot days now (above 92°F)
- 8 days/yr
- Hot days in 30 yrs
- 18 days/yr
Wind risk 2/10 · Minimal
- Chance of severe wind over 30 yrs
- 1.0%
Air-quality risk 1/10 · Minimal
- Unhealthy air days now
- 0 days/yr
- Unhealthy air days in 30 yrs
- 0 days/yr
Risk factors via First Street. Map © Google.
Why this score? — see what drove the B+ grade
The composite is a weighted blend of 9 inputs, each scored 0–100. Each bar is that input's sub-score; the figure is the points it added to the 100-point composite (weight × sub-score).
- Cash flow +30.0/30.0
- 1% rule +10.0/10.0
- DSCR +10.0/10.0
- Appreciation +8.9/10.0
- ARV discount +7.5/15.0
- Schools +4.3/10.0
- Rent growth +2.5/5.0
- Livability +2.5/5.0
- Condition / age +2.0/5.0
$249,900
🖨 Deal sheet 📄 Offer letter ✓ Due diligence
Multi-family units
County records classify this as Multi-Family (2-4 Unit). Listing-text estimate: 4 units. confirmed
Listing remarks
4 UNIT MULTI-FAMILY NOW AVAILABLE with 7 Bedrooms and 4 baths. Many NEW upgrades done and Improvements are continuing. Floors were redone, all rooms painted, structural work to the building completed. PRIME LOCATION between Milford and Oneonta on a large 0.61 Acre of land. Plenty of Parking. ONEONTA SCHOOLS. Three apartments have 2 bedrooms, one bath. One apartment with one bedroom, one bath. Three apartments are now vacant, new owner can set the Rental Income. Separate meters. Versatile living options. Live in one and rent the others to offset the mortgage. Or INVESTORS, this 4 unit would make a good Baseball Dream Parks Rental. Also, in a MIXED USE area. Close to Rt 28 for easy access to
Key facts
- Large acre of land
- Plenty of parking
- Floors redone
Tags
Property features AI
Finance
- Other: Four total units (multifamily); Four units in community; Five separate electric meters
- Financial info: Owner pays snow removal, trash collection and water; Operating expenses include insurance and water/sewer
Exterior
- Parking: Unpaved parking with two or more spaces available
- Utilities: Well water; Septic tank; Cable available
- Home design: Two-story building; Resale property
- Construction: Wood siding construction; Stone foundation; Asphalt, membrane and rubber roofing
- Exterior features: Rectangular lot with 108 x 165 dimensions; Main thoroughfare road frontage; Zoned Residential Multi Use
Interior
- Flooring: Carpet; Hardwood; Tile; Varies
- Bathrooms: Four full bathrooms
- Heating & cooling: Electric baseboard heating
- Interior features: Full basement; Varied flooring including carpet, hardwood and tile
- Laundry & utility: Electric water heater
Neighborhood map
What this means for you Summary
Snapshot
- This is a 4 × 7-bed/4.0-bath units multifamily listed at $250k. Condition is rated fair.
Deal economics
- At list price, monthly cash flow is $4k ($43k/yr) — positive. Per door: $892/mo.
- The deal already cash-flows at list — no discount required.
- Meets the 1% rule at list price ($7k rent vs $250k).
Location & tenants
- Location reads: area grade B — affects rentability + tenant quality, not the cash-flow math above.
- Oneonta City School District (town): math 46% / reading 57% proficiency, ranked #374 of 590 in NY (top 63%) — acceptable for families but not a draw, mixed tenant base, ~2y average lease.
- Market conditions: 12 active listings in the ZIP; 133 units permitted in Otsego County in 2024 (10 in 5+ unit buildings).
Forward outlook
- In year one you build about $21k of equity ($2k loan paydown + $19k appreciation (7.8% local appreciation)).
- Otsego County population projected at -21% by 2050 — secular population decline; favor cash flow + early exit over multi-decade hold.
- At projected returns (7.8% appreciation + 3.0% rent growth), your $70k cash investment doubles in ~2 years — after that, you're playing with house money.
- By year 2, paydown + projected appreciation supports a ~$34k cash-out refi (75% LTV) — recoverable capital for the next deal without selling this one.
Negotiation context
- Only 12 days on market — expect competitive offers; lowballing is unlikely to land.
- 2 sale attempts with the ask held roughly flat each time — persistent listings suggest the price (not the market) is what's stuck; bring a comps-based counter.
Risks & watch-outs
- Watch-outs: built in 1920 — expect roof / HVAC / electrical / plumbing capex.
Questions for the listing agent
- Can we see the unit-by-unit rent roll, current vacancy, and any below-market leases? What's the average tenancy length?
- What capital expenditures (roof, boiler, parking lot, exteriors) have been made in the last 5 years, and what's planned in the next 2?
- Have any recent inspections been done? Can we get a copy of the seller's disclosures and any deferred-maintenance estimates?
- Built in 1920 — when were the roof, HVAC, electrical panel, plumbing, and water heater last replaced?
- Is there a deadline driving the sale (1031 exchange, divorce, estate, relocation)? That informs how much negotiation room exists.
- What's the average days-on-market for RENTAL listings here right now (not sales)? A rising rental-DOM trend means longer vacancies and softer asking-rent achievability than the comps imply.
- What's the recent tenant-quality profile in this submarket — average credit score on applications, eviction rate, late-payment / NSF rate, and stable-employment percentage? A property-management company in the area should have these aggregated.
- How much new apartment / multifamily construction is in the pipeline within 1–3 miles? Heavy new supply (>2% of stock underway) typically softens rents 12–24 months out; light construction supports rent growth.
Investment metrics
- 1% rule
- 2.68% ✓
- Cap rate
- 23.44%
- Cash-on-cash
- 61.22%
- DSCR
- 3.72
- GRM
- 3.1
CMA / ARV
No comps found within radius.
Projected returns pro-forma
7.78% appreciation · 3.0% rent growth · sell at horizon
- IRR
- 71.0%
- Equity multiple
- 5.67×
- Total profit
- $326,840
- Equity at exit
- $186,050
- IRR
- 66.6%
- Equity multiple
- 12.14×
- Total profit
- $779,486
- Equity at exit
- $365,734
Cash invested: $69,972 (down + closing). Projections, not guarantees.
Landlord ↔ Tenant lean methodology
- Overall (STATE)
- 15 Strongly Tenant-Friendly
- State New York
- 15 Strongly Tenant-Friendly · D+10
- County
- — inherits STATE
- City
- — inherits STATE
ZIP-level market 13807
- Home prices YoY
- 1.9%
- Active inventory
- 12
- Price-to-rent
- 12.4×
Monthly cashflow live
- Estimated rent
- $6,705 medium interval (Pro) →
- Mortgage (P&I)
- −$1,311
- Tax est. 1.5%
- −$312 /mo · $3,748/yr
- Insurance
- −$104
- HOA
- −$0
- Vacancy / Maint / Mgmt
- −$1,408
- Net cashflow
- $3,570
Break-even live
4-unit breakdown (identical units grouped — click to expand)
| Units | Beds | Baths | Est. rent |
|---|---|---|---|
| 4× units | 7 | 4 | $6,704 |
| #1 | 7 | 4 | $1,676 |
| #2 | 7 | 4 | $1,676 |
| #3 | 7 | 4 | $1,676 |
| #4 | 7 | 4 | $1,676 |
| Total (4 units) | $6,705 | ||
UW: 25.0% down · 7.5% · 30yr · 1.5% tax · 5.0% vac · 8.0% maint · 8.0% mgmt
Financing live
Cash to close
- Down payment
- $62,475
- Closing costs
- $7,497
- Reserves months
- —
- Total cash needed
- —
Loan-product check · same deal, 3 products live
Conventional
25% down · 7.5% · 30yr
- Down + closing
- —
- Monthly P&I
- —
- Monthly cashflow
- —
- DSCR
- —
- Eligible?
- —
Personal DTI + credit; lowest rate.
DSCR
20% down · 8.5% · 30yr
- Down + closing
- —
- Monthly P&I
- —
- Monthly cashflow
- —
- DSCR
- —
- Eligible?
- —
No personal income docs; deal must DSCR.
Hard money
10% down · 12.0% · 12mo
- Down + closing
- —
- Monthly P&I
- —
- Monthly cashflow
- —
- DSCR
- —
- Eligible?
- —
Short-term bridge; refi at stabilization.
Listing history 4 events
-
2026-05-13status Pending
-
2026-05-01$249,900 Active
-
2025-09-24historical
-
2025-03-26$199,900 Active
ⓘ Source: listings_history table (triggers on properties + properties_extension) + one-shot
backfill from property_details.listing_events for pre-trigger history.
Climate risk First Street
- Flood 1/10 Low FEMA zone X (unshaded) · 0% chance over 30 yrs
- Wildfire 1/10 Low
- Heat 2/10 Low 8 d/yr ≥92°F today · 18 d/yr by 30 yrs out
- Wind 2/10 Low 100% chance of damaging wind over 30 yrs
- Air quality 1/10 Low 0 unhealthy d/yr today · 0 by 30 yrs out
Nearby sold comps map
Loading sold comps map…
Walkable amenities ~0.75 mi
Loading nearby amenities…
Taxation est. · year 1
- Rental income
- $80,460
- − Mortgage interest
- −$13,998
- − Property taxes
- −$3,748
- − Insurance
- −$1,250
- − Repairs & maintenance
- −$6,437
- − Management
- −$6,437
- − Depreciation
- −$7,270
- Taxable income
- $41,320
- Est. tax owed @ 24.0%
- −$9,917
- After-tax cash flow
- $32,922/yr
For passive investors: Depreciation is non-cash, so a rental often shows a tax loss while cash-flowing — sheltering income. Rental losses are passive: they offset passive income freely, and up to $25,000/yr can offset ordinary (W-2) income if you actively participate and your MAGI is under $100k (phasing out to $0 by $150k); unused losses carry forward. On sale, claimed depreciation is recaptured at up to 25%, and gains may owe capital-gains tax (a 1031 exchange can defer both). Figures are a year-1 estimate at your 24.0% rate — not tax advice; consult a CPA.
Condition & rehab AI · 1 photo
This 4-unit multi-family property requires moderate rehabilitation, including exterior painting and landscaping, to improve its condition and resale value.
Repairs flagged
- Major exterior walls — Peeling paint and overgrown lawn
- Major landscaping — Overgrown lawn and lack of landscaping
Value-add opportunities
- Both landscaping and exterior painting — Improves curb appeal and resale value
- Both HVAC and mechanicals — Ensures comfort and energy efficiency
- Both interior painting — Enhances interior appearance and resale value
Renovation cost estimate screening
| Repair item | Severity | Est. cost |
|---|---|---|
| exterior walls · Peeling paint and overgrown lawn | Major | $15,000–50,000 |
| landscaping · Overgrown lawn and lack of landscaping | Major | $15,000–50,000 |
| Total estimated repair cost · 2 items | $30,000–100,000 |
Value-add ROI direction
- Both landscaping and exterior painting — Improves curb appeal and resale value ↑
- Both HVAC and mechanicals — Ensures comfort and energy efficiency ↑
- Both interior painting — Enhances interior appearance and resale value ↑
ⓘ Cost ranges are severity-bucket heuristics (US national rule-of-thumb). Get contractor quotes + a written scope before underwriting a rehab budget.
Schools (NCES district)
- District
- Oneonta City School District
- NCES district ID
- 3621780
- Math proficiency
- 46% ▼ -2.00%
- Reading proficiency
- 57% ▲ 14.00%
- Median HH income
- $41,631
- Composite
- 43.19/100
- National rank
- #3066
- State rank
- #374 of 590 in NY
Livability — Portlandville
No livability data for this city. (Only ~50 U.S. cities are tracked.)
Census & demographics
- Population (ZIP)
- 1,260
Population outlook (Otsego County) Hauer SSP2
- Today (2025)
- 57,987 people
- By 2030
- 55,403 · -4.5%
- By 2040
- 50,336 · -13.2%
- By 2050
- 45,715 · -21.2%
- By 2075
- 38,769 · -33.1%
- By 2100
- 33,468 · -42.3%
Race, ethnicity, and origin ACS 2023
- Neighborhood character
- Predominantly White (91%)
- Race & ethnicity
- White 91% Asian 5% Hispanic / Latino 4% Two or more races 2%
- Common ancestry
- Lithuanian 11% Romanian 8% Iranian 5%
- Foreign-born
- 6% · Canada
- Languages at home
- 92% English-only · Tagalog/Filipino 3% Spanish 2% Other Asian/Pacific 1%
Political lean MEDSL · Otsego
- 2024 margin
- Lean R (+7.9) · D 46.1% · R 53.9%
- 2008→2024 swing
- -13.8pp toward R · 2008: 5.9pp · 2024: -7.9pp
- All cycles
- 2024: R+7.9 2020: R+5.0 2016: R+13.0 2012: D+2.0 2008: D+5.9
Not yet ingested
- Civics
- —
Market trends
- HPI YoY
- ▲ 7.78%
- Current HPI
- 421.1413
- Rent YoY
- —
- Metro
- —
- State GDP YoY
- ▲ 2.60%
- F500 in state
- 92
Industry mix (Fortune 500 HQ in NY)
| Industry | F500 HQs | Revenue |
|---|---|---|
| Financial Services | 10 | $950B |
|
||
| Consumer Goods | 9 | $162B |
|
||
| Insurance | 4 | $225B |
|
||
| Telecommunications | 2 | $144B |
|
||
| Pharmaceuticals | 2 | $112B |
|
||
| Media / Entertainment | 2 | $69B |
|
||
Price history
+25.0% since first listed4 events — show timeline
- 2026-05-13 Pending — UNYREIS
- 2026-05-01 Listed $249,900 UNYREIS
- 2025-09-24 Listing Removed — UNYREIS
- 2025-03-26 Listed $199,900 UNYREIS
Cash-flow waterfall
monthlySold comps — $/sqft
last 12 mo · ≤1 miLoading sold comps…