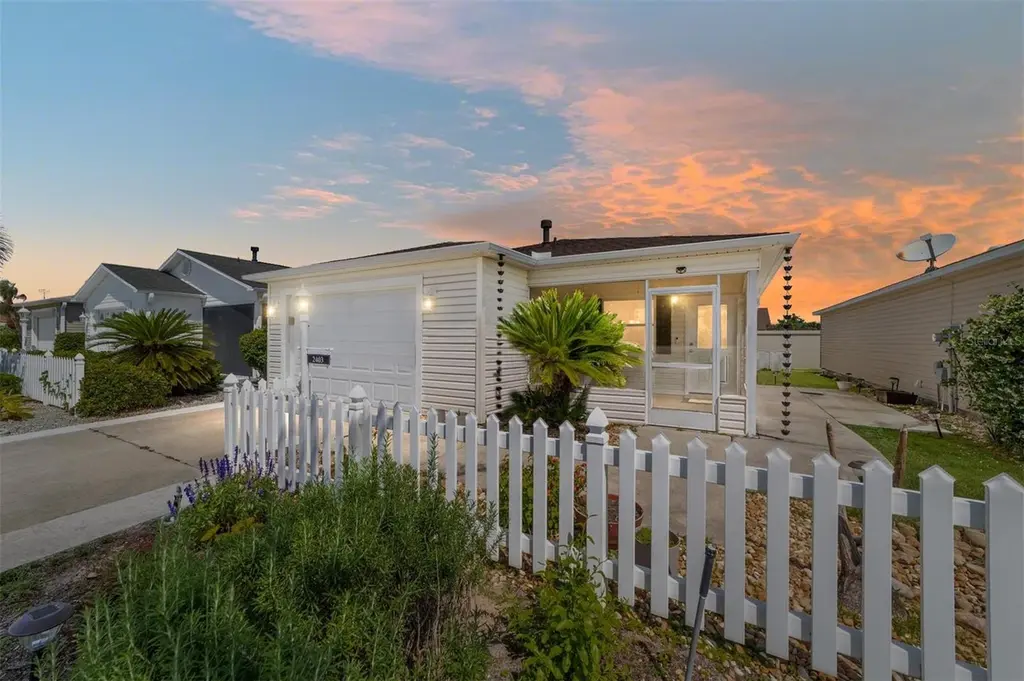
2403 Baton Pl · The Villages, FL
Flood risk 1/10 · Minimal
- FEMA flood zone
- X (unshaded)
- Chance of flooding over 30 yrs
- 0.0%
- Est. flood insurance / yr
- $507 – $1,088
Fire risk 4/10 · Minor
- Est. fire insurance / yr
- $947 – $1,759
Heat risk 8/10 · Major
- Hot days now (above 109°F)
- 4 days/yr
- Hot days in 30 yrs
- 12 days/yr
Wind risk 9/10 · Severe
- Chance of severe wind over 30 yrs
- 99.0%
Air-quality risk 3/10 · Minor
- Unhealthy air days now
- 2 days/yr
- Unhealthy air days in 30 yrs
- 3 days/yr
Risk factors via First Street. Map © Google.
Why this score? — see what drove the D- grade
The composite is a weighted blend of 9 inputs, each scored 0–100. Each bar is that input's sub-score; the figure is the points it added to the 100-point composite (weight × sub-score).
- Cash flow +12.8/30.0
- Schools +5.2/10.0
- DSCR +3.8/10.0
- Rent growth +3.5/5.0
- Livability +3.5/5.0
- 1% rule +2.8/10.0
- Condition / age +2.5/5.0
- ARV discount +1.1/15.0
- Appreciation +0.0/10.0
$305,000
🖨 Deal sheet (PDF) 📄 Offer letter ✓ Due diligence
Listing remarks
Now offered at $305,000!! This charming 2-bed, 2-bath COLONY Patio Villa in the Village of Bonnybrook delivers exceptional value, modern updates, and the low-maintenance lifestyle loved by Villages residents. The villa provides comfort, style, and is close to shopping, recreation, golf and everyday conveniences you've come to expect. Enjoy peace of mind with a 2023 ROOF and NO carpet throughout. The REMODELED KITCHEN features soft-close white cabinetry, expanded counter space and a thoughtful redesign that relocated the refrigerator to the end of the new cabinet run, creating a more open and functional layout. Two GLASS FRONT Cabinets are the perfect place to display your favorite glasses a
Key facts
- Interior laundry
- Above-ground spa
- Remodeled kitchen
Tags
Property features AI
Finance
- Other: Lot approximately 40 x 90 (0.08 acres); Roads are asphalt/paved
- Financial info: Community Development District (CDD) present; Lease restrictions apply
- HOA & community: Clubhouse; Community mailbox; Deed restrictions; Dog park; Golf carts allowed; Golf; Playground; Pool; Tennis courts; Street lights; Irrigation with reclaimed water; Senior community; Pets allowed
Exterior
- Parking: Attached garage (1 car)
- Utilities: Public water; Public sewer; Electricity connected; Natural gas connected; Underground utilities; Water connected
- Home design: Residential villa; One story; South facing; Entry on main level
- Construction: Vinyl siding with frame construction; Shingle roof; Slab foundation; Builder model: COLONY; Built on one level
- Exterior features: Rain gutters; Sliding doors; Sprinkler meter; Irrigation equipment; Sprinkler recycled
Interior
- Kitchen: Dishwasher; Disposal; Microwave; Range; Refrigerator
- Bedrooms: 2 bedrooms
- Flooring: Ceramic tile; Laminate
- Bathrooms: 2 full bathrooms
- Heating & cooling: Central heating (electric and natural gas); Central air conditioning
- Interior features: Ceiling fans; High ceilings; Living room / dining room combo; Thermostat; Vaulted ceilings; Walk-in closets; Window treatments; Skylight(s)
- Laundry & utility: Washer; Dryer; Laundry closet; Laundry in kitchen
Neighborhood map
What this means for you Summary
Snapshot
- This is a 2-bed/2.0-bath single-family listed at $305k.
Deal economics
- At list price, monthly cash flow is $-30 ($-363/yr) — negative.
- To cash-flow at today's rent, offer at most $300k (1.8% below list).
- To meet the 1% rule (rent ≥ 1% of price), the offer needs to be $239k (21.7% below list).
- Recommended offer: $239k (21.7% below list) — sets the bar for 1% rule.
- Cap rate 6.2% vs local median 5.0% in The Villages — meaningfully above typical; check what's discounted (condition, days-on-market, listing class) to confirm the premium yield is real.
Location & tenants
- Location reads 70/100 on livability (#431 in FL) — a middle-class / working-renter tenant base. Strengths: crime A+, housing A, employment B+; Watch: amenities F, commute F, health & safety F.
- Sumter (rural): math 61% / reading 61% proficiency, ranked #11 of 73 in FL (top 15%) — acceptable for families but not a draw, mixed tenant base, ~2y average lease.
- Zoned schools: Wildwood Elementary School (math 49% / reading 52%, grade D+, #1,055 of 2,144 statewide, top 50%, 940 students, 76% FRL); South Sumter Middle School (math 55% / reading 54%, grade B-, #183 of 571 statewide, top 34%, 897 students, 61% FRL) — zoned schools average 68% FRL vs 51% district-wide (18 pts higher); higher-poverty schools than district average — tighter screening recommended.
- Market conditions: Rents rising (+3.9%/yr); 551 active listings in the ZIP; 20 comparable units currently listed for rent nearby; rentals at typical pace (median 23d on market — plan ~3-4 weeks tenant-placement turnaround); 3,961 units permitted in Sumter County in 2024 (248 in 5+ unit buildings).
- This rent runs 39% of the median local income ($74k/yr) — at the standard rent-burdened threshold; future hikes will face affordability resistance.
Forward outlook
- Local home prices are declining (-3.0%/yr); year-one equity from $2k of loan paydown is wiped out by about $9k of value loss. Plan a longer hold.
- Sumter County population projected at +45% by 2050 — long-run rental-demand tailwind backs the buy-and-hold thesis.
Negotiation context
- It's been on market 66 days — a 6% lower offer ($287k) is reasonable based on typical stale-listing flexibility.
- Current owner paid $177k; list at $305k implies a 72% gain — meaningful room to come down on a strong offer.
Risks & watch-outs
- Climate carrying-cost: severe wind risk, 99% chance of damaging wind over 30y; extreme-heat days projected 4→12/yr by 2055 (HVAC capex compounding) — expect insurance premiums to compound above CPI over the hold.
Questions for the listing agent
- What do current leases actually rent for vs. the listed asking? Can we see a recent rent roll and the last 12 months of T-12 income?
- It's been on market 66 days. Have you received any prior offers? Is the seller open to a 22% concession, seller financing, or rate buy-down credit?
- Why hasn't it sold? Are there any deal-killer items the seller is aware of (foundation, flood, title, zoning, code violations)?
- Is there a deadline driving the sale (1031 exchange, divorce, estate, relocation)? That informs how much negotiation room exists.
- Schools are A-rated — typically a magnet for longer-tenancy family renters. What's the average tenant stay here, and is there a school-zone premium baked into asking?
- The area grade is low — what's the realistic commute time and amenity access for the typical tenant pool here? Any planned neighborhood developments (good or bad) we should know about?
- What's the average days-on-market for RENTAL listings here right now (not sales)? A rising rental-DOM trend means longer vacancies and softer asking-rent achievability than the comps imply.
- What's the recent tenant-quality profile in this submarket — average credit score on applications, eviction rate, late-payment / NSF rate, and stable-employment percentage? A property-management company in the area should have these aggregated.
- How much new for-sale + rental construction is in the pipeline within 1–3 miles? Heavy new supply typically softens prices + rents 12–24 months out; constrained supply supports both.
Investment metrics
- 1% rule
- 0.78% ✗
- Cap rate
- 6.17%
- Cash-on-cash
- -0.42%
- DSCR
- 0.98
- GRM
- 10.6
CMA / ARV
- ARV (on-the-fly)
- $267,036
- Comps found
- 12
Show comp detail 12 sales within ~0.75 mi
| Address | Dist | Beds/Ba | Sqft | Sold | Price | $/sf | Match |
|---|---|---|---|---|---|---|---|
| 2351 Pine Ridge St | 0.10mi | 2/2.0 | 1,156 (0%) | 3mo | $282,500 | $244 | 93 |
| 2306 Oak Bend Pl | 0.18mi | 2/2.0 | 1,156 (0%) | 1mo | $265,000 | $229 | 91 |
| 2657 Hastings Ln | 0.41mi | 2/2.0 | 1,156 (0%) | 0mo | $260,000 | $225 | 80 |
| 2369 Five Forks Trl | 0.17mi | 3/2.0 (+1) | 1,240 (+7%) | 0mo | $305,000 | $246 | 75 |
| 3273 Riverton Rd | 0.50mi | 2/2.0 | 1,143 (-1%) | 1mo | $225,000 | $197 | 74 |
| 2169 Smoaks St | 0.42mi | 2/2.0 | 1,196 (+4%) | 3mo | $260,000 | $217 | 72 |
| 392 Rose Croft Ter | 0.47mi | 2/2.0 | 1,188 (+3%) | 3mo | $275,000 | $231 | 71 |
| 3622 Cambria Cir | 0.60mi | 2/2.0 | 1,156 (0%) | 2mo | $254,900 | $221 | 70 |
| 2598 Hialeah Ave | 0.32mi | 1/1.0 (-1) | 1,120 (-3%) | 1mo | $190,000 | $170 | 70 |
| 2757 Plainridge Loop | 0.59mi | 2/2.0 | 1,142 (-1%) | 2mo | $320,000 | $280 | 69 |
| 2858 Leicester Ter | 0.74mi | 2/2.0 | 1,178 (+2%) | 2mo | $374,900 | $318 | 61 |
| 664 Evelynton Loop | 0.57mi | 2/2.0 | 1,248 (+8%) | 2mo | $339,000 | $272 | 58 |
Match score weights: distance 35% · size 25% · config 20% · recency 20%. Top-matched comps best support the ARV.
Projected returns pro-forma
-3.0% appreciation · 3.92% rent growth · sell at horizon
- IRR
- -16.1%
- Equity multiple
- 0.42×
- Total profit
- $-49,198
- Equity at exit
- $45,476
- IRR
- -6.4%
- Equity multiple
- 0.57×
- Total profit
- $-36,318
- Equity at exit
- $26,371
Cash invested: $85,400 (down + closing). Projections, not guarantees.
Landlord ↔ Tenant lean methodology
- Overall (STATE)
- 87 Strongly Landlord-Friendly
- State Florida
- 87 Strongly Landlord-Friendly · R+3
- County
- — inherits STATE
- City
- — inherits STATE
ZIP-level market 32162
- Home prices YoY
- -6.9%
- Rents YoY
- 3.9%
- Active inventory
- 551
- Price-to-rent
- 10.6×
Monthly cashflow live
- Estimated rent
- $2,389 high interval (Pro) →
- Mortgage (P&I)
- −$1,599
- Tax from tax record
- −$191 /mo · $2,292/yr
- Insurance
- −$127
- HOA
- −$0
- Vacancy / Maint / Mgmt
- −$502
- Net cashflow
- $-30
Break-even live
Sensitivity live
| Price | -10% $142 | -5% $56 | +0% $-30 | +5% $-117 | +10% $-203 |
|---|---|---|---|---|---|
| Rent | -10% $-219 | -5% $-125 | +0% $-30 | +5% $64 | +10% $159 |
| Rate | -1.0pp $123 | -0.5pp $47 | base $-30 | +0.5pp $-109 | +1.0pp $-190 |
UW: 25.0% down · 7.5% · 30yr · 1.5% tax · 5.0% vac · 8.0% maint · 8.0% mgmt
Financing live
Cash to close
- Down payment
- $76,250
- Closing costs
- $9,150
- Reserves months
- —
- Total cash needed
- —
Loan-product check · same deal, 3 products live
Conventional
25% down · 7.5% · 30yr
- Down + closing
- —
- Monthly P&I
- —
- Monthly cashflow
- —
- DSCR
- —
- Eligible?
- —
Personal DTI + credit; lowest rate.
DSCR
20% down · 8.5% · 30yr
- Down + closing
- —
- Monthly P&I
- —
- Monthly cashflow
- —
- DSCR
- —
- Eligible?
- —
No personal income docs; deal must DSCR.
Hard money
10% down · 12.0% · 12mo
- Down + closing
- —
- Monthly P&I
- —
- Monthly cashflow
- —
- DSCR
- —
- Eligible?
- —
Short-term bridge; refi at stabilization.
Rent comps 20 comps
| Address | Beds | Baths | Sqft | Rent | $/sqft | DOM | Units | Dist |
|---|---|---|---|---|---|---|---|---|
| 3292 Riverton Rd The Villages, FL | 2.0 | 2.0 | 1143 | $2,100 | $1.84 | 22d | 1 | 0.54mi |
| 3260 Atwell Ave The Villages, FL | 3.0 | 2.0 | 1392 | $2,500 | $1.80 | 22d | 1 | 0.60mi |
| 650 Richland Rd The Villages, FL | 2.0 | 2.0 | 1188 | $4,500 | $3.79 | 22d | 1 | 0.61mi |
| 2111 Thornton Ter The Villages, FL | 2.0 | 2.0 | 1156 | $4,400 | $3.81 | 22d | 1 | 0.64mi |
| 3489 Cambria Cir The Villages, FL | 2.0 | 2.0 | 1188 | $1,745 | $1.47 | 22d | 1 | 0.67mi |
| 2864 Leicester Ter Unit 1525680P The Villages, FL | 2.0 | 2.0 | 1130 | $2,090 | $1.85 | 22d | 1 | 0.74mi |
| 2685 Craven Way The Villages, FL | 2.0 | 2.0 | 1156 | $4,600 | $3.98 | 22d | 1 | 0.78mi |
| 12020 Brush Hill Rd Oxford, FL | 1.0–3.0 | 1.0–2.0 | 947 | $1,835 | $1.94 | 22d | 15 | 0.84mi |
| 2390 Southern Oak St The Villages, FL | 2.0 | 2.0 | 1156 | $5,300 | $4.58 | 22d | 1 | 0.86mi |
| 3207 Woodridge Dr The Villages, FL | 2.0 | 2.0 | 1148 | $4,200 | $3.66 | 22d | 1 | 0.87mi |
| 2340 Pickens Pl The Villages, FL | 2.0 | 2.0 | 1156 | $1,900 | $1.64 | 22d | 1 | 0.87mi |
| 3545 Idlewood Loop The Villages, FL | 2.0 | 2.0 | 1240 | $4,500 | $3.63 | 22d | 1 | 0.92mi |
| 4460 County Road 472 Unit A Oxford, FL | 2.0 | 1.0 | 860 | $1,300 | $1.51 | 22d | 1 | 0.98mi |
| 971 Kingmont Ter The Villages, FL | 3.0 | 2.0 | 1392 | $3,400 | $2.44 | 22d | 1 | 1.04mi |
| 5308 Bowline Ct Oxford, FL | 3.0 | 2.0 | 1402 | $1,800 | $1.28 | 22d | 1 | 1.04mi |
| 888 Radclife Berea Pl The Villages, FL | 2.0 | 2.0 | 1288 | $4,200 | $3.26 | 22d | 1 | 1.04mi |
| 12388 NE 48th Loop Oxford, FL | 3.0 | 2.0 | 1426 | $1,700 | $1.19 | 22d | 1 | 1.08mi |
| 6367 NE 118th Ave The Villages, FL | 3.0–4.0 | 2.0–2.5 | 1645 | $1,925 | $1.17 | 22d | 10 | 1.14mi |
| 5336 Edgewater Way Unit 5336 Oxford, FL | 3.0 | 2.0 | 1291 | $2,000 | $1.55 | 22d | 1 | 1.15mi |
| 10457 Bethel PL Wildwood, FL | 1.0–3.0 | 1.0–2.5 | 1293 | $1,974 | $1.53 | 22d | 41 | 1.27mi |
Listing history 19 events
-
2026-06-22days on market $305,000 Active 66 DOM
-
2026-06-19days on market $305,000 Active 64 DOM
-
2026-06-18days on market $305,000 Active 63 DOM
-
2026-06-17days on market $305,000 Active 62 DOM
-
2026-06-16days on market $305,000 Active 61 DOM
-
2026-06-15days on market $305,000 Active 60 DOM
-
2026-06-14days on market $305,000 Active 58 DOM
-
2026-06-13remarks 699-char remark
-
2026-06-13pricedays on market $305,000 Active 57 DOM
-
2026-06-10days on market $315,000 Active 55 DOM
-
2026-06-09days on market $315,000 Active 54 DOM
-
2026-06-08days on market $315,000 Active 53 DOM
-
2026-06-07days on market $315,000 Active 52 DOM
-
2026-06-02days on market $315,000 Active 47 DOM
-
2026-06-01days on market $315,000 Active 46 DOM
-
2026-05-31days on market $315,000 Active 45 DOM
-
2026-05-30days on market $315,000 Active 44 DOM
-
2026-04-16$315,000 Active
-
2014-09-15soldstatus $177,000
ⓘ Source: listings_history table (triggers on properties + properties_extension) + one-shot
backfill from property_details.listing_events for pre-trigger history.
Tax reassessment forecast FL · Resets to sale price
- Current annual tax
- $2,292 · $191/mo
- Projected year-2 tax
- $2,532 · $211/mo
- Expected delta
- +$239/yr (+$20/mo · 10.4%)
ⓘ Screening estimate from a state-policy table — verify with the county assessor before closing.
Climate risk First Street
- Flood 1/10 Low FEMA zone X (unshaded) · 0% chance over 30 yrs
- Wildfire 4/10 Moderate
- Heat 8/10 Severe 4 d/yr ≥109°F today · 12 d/yr by 30 yrs out
- Wind 9/10 Extreme 99% chance of damaging wind over 30 yrs
- Air quality 3/10 Moderate 2 unhealthy d/yr today · 3 by 30 yrs out
Nearby sold comps map
Loading sold comps map…
Walkable amenities ~0.75 mi
Loading nearby amenities…
Taxation est. · year 1
- Rental income
- $28,668
- − Mortgage interest
- −$17,085
- − Property taxes
- −$2,292
- − Insurance
- −$1,525
- − Repairs & maintenance
- −$2,293
- − Management
- −$2,293
- − Depreciation
- −$8,873
- Taxable loss
- −$5,693
- Est. tax savings @ 24.0%
- +$1,366
- After-tax cash flow
- $1,004/yr
For passive investors: Depreciation is non-cash, so a rental often shows a tax loss while cash-flowing — sheltering income. Rental losses are passive: they offset passive income freely, and up to $25,000/yr can offset ordinary (W-2) income if you actively participate and your MAGI is under $100k (phasing out to $0 by $150k); unused losses carry forward. On sale, claimed depreciation is recaptured at up to 25%, and gains may owe capital-gains tax (a 1031 exchange can defer both). Figures are a year-1 estimate at your 24.0% rate — not tax advice; consult a CPA.
Schools (NCES district)
- District
- Sumter
- NCES district ID
- 1201800
- Math proficiency
- 61% ▼ -4.00%
- Reading proficiency
- 61% ▼ -2.00%
- Median HH income
- $48,240
- Composite
- 51.74/100
- National rank
- #1682
- State rank
- #11 of 73 in FL
Livability — The Villages
- Score
- 70/100
- State rank
- #431
- US rank
- #7363
Category grades
Schools grade is shown separately in the Schools card above.
Census & demographics
- Census place
- The Villages, FL
- County
- Sumter County · 110,591 people
- City population
- 83,973
- Metro
- The Villages, FL
- Population (ZIP)
- 55,424
- Household income
- $74,119
- Rent vs Own
- Severe rent burden
- 987.0
Population outlook (Sumter County) Hauer SSP2
- Today (2025)
- 161,172 people
- By 2030
- 180,083 · +11.7%
- By 2040
- 209,892 · +30.2%
- By 2050
- 234,186 · +45.3%
- By 2075
- 284,602 · +76.6%
- By 2100
- 317,039 · +96.7%
Race, ethnicity, and origin ACS 2023
- Neighborhood character
- Predominantly White (95%)
- Race & ethnicity
- White 95% Two or more races 2% Hispanic / Latino 2% Asian 1% Black 1%
- Common ancestry
- Romanian 7% Slovak 4% Lithuanian 4%
- Foreign-born
- 5% · Canada
- Languages at home
- 96% English-only · Spanish 1% Tagalog/Filipino 1%
Political lean MEDSL · Sumter
- 2024 margin
- Solid R (+37.6) · D 30.9% · R 68.6%
- 2008→2024 swing
- -10.6pp toward R · 2008: -27.0pp · 2024: -37.6pp
- All cycles
- 2024: R+37.6 2020: R+36.1 2016: R+39.2 2012: R+34.9 2008: R+27.0
Not yet ingested
- Civics
- —
Market trends
- HPI YoY
- ▼ -16.16%
- Current HPI
- 218.1956
- Rent YoY
- ▲ 3.92%
- Metro
- The Villages, FL
- State GDP YoY
- ▲ 3.28%
- F500 in state
- 36
Industry mix (Fortune 500 HQ in FL)
| Industry | F500 HQs | Revenue |
|---|---|---|
| Industrial Technology | 2 | $29B |
|
||
| Insurance | 2 | $17B |
|
||
| Retail | 1 | $60B |
|
||
| Technology Distribution | 1 | $58B |
|
||
| Homebuilding | 1 | $35B |
|
||
| Technology Manufacturing | 1 | $35B |
|
||
Price history
+78.0% since first listed2 events — show timeline
- 2026-04-16 Listed $315,000 Stellar MLS as Distributed by MLS Grid
- 2014-09-15 Sold (Public Records) $177,000 Public Records
Property tax history
+0.6%/yrLatest (2025): $2,292 · +1.5% YoY. Source: county tax records.
Cash-flow waterfall
monthlySold comps — $/sqft
last 12 mo · ≤1 miLoading sold comps…