158 Sir Damas Dr · Riverside, CA
Flood risk 1/10 · Minimal
- FEMA flood zone
- X (unshaded)
- Chance of flooding over 30 yrs
- 0.0%
- Est. flood insurance / yr
- $507 – $1,088
Fire risk 7/10 · Major
- Est. fire insurance / yr
- $659 – $1,223
Heat risk 8/10 · Major
- Hot days now (above 101°F)
- 7 days/yr
- Hot days in 30 yrs
- 20 days/yr
Wind risk 1/10 · Minimal
- Chance of severe wind over 30 yrs
- —
Air-quality risk 9/10 · Severe
- Unhealthy air days now
- 22 days/yr
- Unhealthy air days in 30 yrs
- 27 days/yr
Risk factors via First Street. Map © Google.
Why this score? — see what drove the B- grade
The composite is a weighted blend of 9 inputs, each scored 0–100. Each bar is that input's sub-score; the figure is the points it added to the 100-point composite (weight × sub-score).
- Cash flow +30.0/30.0
- 1% rule +10.0/10.0
- DSCR +10.0/10.0
- ARV discount +7.0/15.0
- Schools +4.1/10.0
- Livability +3.3/5.0
- Rent growth +2.6/5.0
- Condition / age +2.5/5.0
- Appreciation +0.0/10.0
$108,000
🖨 Deal sheet (PDF) 📄 Offer letter ✓ Due diligence
Listing remarks MLS
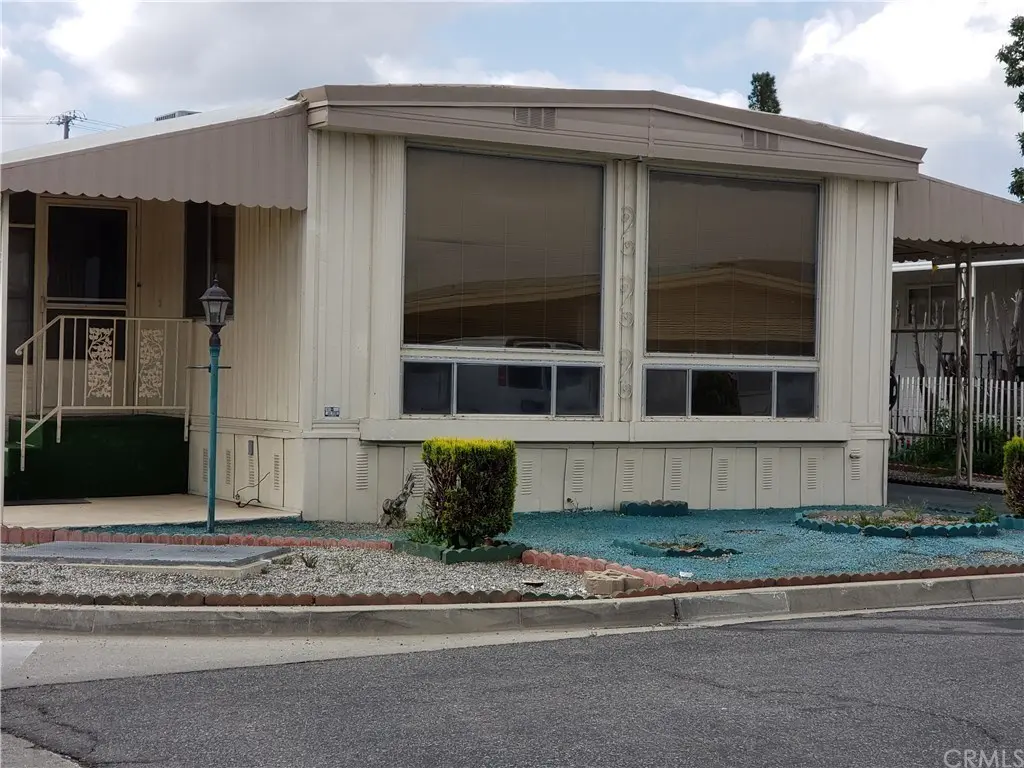
LOVELY 2 BEDROOM 2 BATH MOBILE HOME WITH A VIEW OF THE MOUNTAINS IN KING ARTHUR FAMILY MOBILE HOME PARK. HOME HAS JUST BEEN REFURBISHED. MOVE IN CONDITION. NEW CARPET AND PAINT THRUOUT. LARGE FORMAL LIVING ROOM AND DINING ROOM, CEILING FAN IN DINING ROOM. KITCHEN WITH GAS BUILT IN STOVE TOP AND OVEN, DISHWASHER AND GARBAGE DISPOSAL, FORMICA COUNTERS, LAUNDRY CLOSET THAT INCLUDES WASHER AND DRYER. MASTER BEDROOM WITH MIRRORED CLOSETS, BUILT IN LINEN CLOSET, BATH WITH SHOWER. GUEST BEDROOM AND BATH WITH SHOWER OVER TUB. ENCLOSED PORCH WILL ADD APPROX 150 SQ FT TO THE LIVING SPACE. BIG CORNER LOT WITH COVERED PARKING FOR 2 CARS. STORAGE SHED. CLOSE TO SCHOOLS, SHOPPING, FREEWAYS AND PUBLIC TRANSPORTATION
Key facts
- 2 parking spots
- Community pool
- Built 1966
Property features AI
Finance
- Other: Roads are paved; Elevation measured in feet; Property dimensions of mobile unit approximately 20' x 54'
- Financial info: Land lease of $1,700 per month
- HOA & community: Community features include street lighting and suburban setting; Park name: King Arthur Estates; Manager approval required; Pets allowed with breed restrictions
Exterior
- Parking: Attached carport for 2 vehicles
- Utilities: Water from public/district system; Sewer service paid
- Home design: Single-story mobile home; Entry at main level; Common roof
- Construction: Raised foundation
- Exterior features: Awning; Enclosed, screened patio; Community pool; Aluminum skirt; Corner lot; One shed; Faces east; Mobile home remains on site
Interior
- Kitchen: Gas range and gas oven; Range/stove hood; Dishwasher; Formica counters
- Bedrooms: All bedrooms on ground level
- Bathrooms: One full bathroom; One 3/4 bathroom; Shower in tub and separate shower
- Interior features: Ceiling fan; Community spa
- Laundry & utility: Washer included; Dryer included; Washer hookup; Gas dryer hookup; Laundry in closet
Neighborhood map
What this means for you Summary
Snapshot
- This is a 2-bed/2.0-bath manufactured listed at $108k.
Deal economics
- At list price, monthly cash flow is $1k ($12k/yr) — positive.
- The deal already cash-flows at list — no discount required.
- Meets the 1% rule at list price ($2k rent vs $108k).
- Cap rate 17.6% vs local median 3.0% in Riverside — top-decile yield for the area; either an underpriced asset or a hidden risk that comps aren't pricing in. Stress-test before assuming the spread holds.
Location & tenants
- Location reads 66/100 on livability (#337 in CA) — a middle-class / working-renter tenant base. Strengths: housing A+, employment A-, commute B+; Watch: schools C-, health & safety D, crime F.
- Riverside Unified (urban): math 36% / reading 51% proficiency, ranked #574 of 1,400 in CA (top 41%) — families likely to look elsewhere, expect single-tenant / working-renter base with shorter leases.
- Market conditions: Rents flat; 159 active listings in the ZIP; 40 comparable units currently listed for rent nearby; rentals at typical pace (median 18d on market — plan ~3-4 weeks tenant-placement turnaround); solid renter incomes; 9,195 units permitted in Riverside County in 2024 (1,512 in 5+ unit buildings).
- This rent runs 36% of the median local income ($75k/yr) — at the standard rent-burdened threshold; future hikes will face affordability resistance.
Forward outlook
- Local home prices are declining (-3.0%/yr); year-one equity from $747 of loan paydown is wiped out by about $3k of value loss. Plan a longer hold.
- Riverside County population projected at +22% by 2050 — long-run rental-demand tailwind backs the buy-and-hold thesis.
- At projected returns (-3.0% appreciation + 0.5% rent growth), your $30k cash investment doubles in ~4 years — after that, you're playing with house money.
Negotiation context
- Only 8 days on market — expect competitive offers; lowballing is unlikely to land.
- Current owner paid $35k; list at $108k implies a 209% gain — meaningful room to come down on a strong offer.
Risks & watch-outs
- Climate carrying-cost: major wildfire risk; extreme-heat days projected 7→20/yr by 2055 (HVAC capex compounding) — expect insurance premiums to compound above CPI over the hold.
Questions for the listing agent
- Built in 1966 — when were the roof, HVAC, electrical panel, plumbing, and water heater last replaced?
- Is there a deadline driving the sale (1031 exchange, divorce, estate, relocation)? That informs how much negotiation room exists.
- Crime grade is F in this area — have there been break-ins, vandalism, or insurance claims at this property in the last 3 years? What carrier currently insures it and at what premium?
- What's the average days-on-market for RENTAL listings here right now (not sales)? A rising rental-DOM trend means longer vacancies and softer asking-rent achievability than the comps imply.
- What's the recent tenant-quality profile in this submarket — average credit score on applications, eviction rate, late-payment / NSF rate, and stable-employment percentage? A property-management company in the area should have these aggregated.
- How much new for-sale + rental construction is in the pipeline within 1–3 miles? Heavy new supply typically softens prices + rents 12–24 months out; constrained supply supports both.
Investment metrics
- 1% rule
- 2.07% ✓
- Cap rate
- 17.60%
- Cash-on-cash
- 40.37%
- DSCR
- 2.80
- GRM
- 4.0
CMA / ARV
- ARV (on-the-fly)
- $106,920
- Comps found
- 3
Show comp detail 3 sales within ~0.75 mi
| Address | Dist | Beds/Ba | Sqft | Sold | Price | $/sf | Match |
|---|---|---|---|---|---|---|---|
| 2595 Atlanta Ave #44 | 0.07mi | 2/2.0 | 960 (-11%) | 20mo | $147,000 | $153 | 62 |
| 1560 Massachusetts Ave #113 | 0.19mi | 2/2.0 | 960 (-11%) | 16mo | $67,000 | $70 | 59 |
| 2 Round Table Dr | 0.13mi | 2/2.0 | 1,224 (+13%) | 19mo | $121,000 | $99 | 56 |
Match score weights: distance 35% · size 25% · config 20% · recency 20%. Top-matched comps best support the ARV.
Projected returns pro-forma
-3.0% appreciation · 0.53% rent growth · sell at horizon
- IRR
- 34.0%
- Equity multiple
- 2.39×
- Total profit
- $41,905
- Equity at exit
- $16,103
- IRR
- 39.5%
- Equity multiple
- 4.27×
- Total profit
- $98,905
- Equity at exit
- $9,338
Cash invested: $30,240 (down + closing). Projections, not guarantees.
Landlord ↔ Tenant lean methodology
- Overall (STATE)
- 18 Strongly Tenant-Friendly
- State California
- 18 Strongly Tenant-Friendly · D+13
- County
- — inherits STATE
- City
- — inherits STATE
ZIP-level market 92507
- Rents YoY
- 0.5%
- Active inventory
- 159
- Price-to-rent
- 4.0×
Monthly cashflow live
- Estimated rent
- $2,232 high interval (Pro) →
- Mortgage (P&I)
- −$566
- Tax est. 1.5%
- −$135 /mo · $1,620/yr
- Insurance
- −$45
- HOA
- −$0
- Vacancy / Maint / Mgmt
- −$469
- Net cashflow
- $1,017
Break-even live
Sensitivity live
| Price | -10% $1,092 | -5% $1,055 | +0% $1,017 | +5% $980 | +10% $943 |
|---|---|---|---|---|---|
| Rent | -10% $841 | -5% $929 | +0% $1,017 | +5% $1,105 | +10% $1,194 |
| Rate | -1.0pp $1,072 | -0.5pp $1,045 | base $1,017 | +0.5pp $989 | +1.0pp $961 |
UW: 25.0% down · 7.5% · 30yr · 1.5% tax · 5.0% vac · 8.0% maint · 8.0% mgmt
Financing live
Cash to close
- Down payment
- $27,000
- Closing costs
- $3,240
- Reserves months
- —
- Total cash needed
- —
Loan-product check · same deal, 3 products live
Conventional
25% down · 7.5% · 30yr
- Down + closing
- —
- Monthly P&I
- —
- Monthly cashflow
- —
- DSCR
- —
- Eligible?
- —
Personal DTI + credit; lowest rate.
DSCR
20% down · 8.5% · 30yr
- Down + closing
- —
- Monthly P&I
- —
- Monthly cashflow
- —
- DSCR
- —
- Eligible?
- —
No personal income docs; deal must DSCR.
Hard money
10% down · 12.0% · 12mo
- Down + closing
- —
- Monthly P&I
- —
- Monthly cashflow
- —
- DSCR
- —
- Eligible?
- —
Short-term bridge; refi at stabilization.
Rent comps 40 comps
| Address | Beds | Baths | Sqft | Rent | $/sqft | DOM | Units | Dist |
|---|---|---|---|---|---|---|---|---|
| 2770 Atlanta Ave Riverside, CA | 2.0 | 1.0 | 910 | $2,030 | $2.23 | 3d | 1 | 0.13mi |
| 1370 Wheaton Way Riverside, CA | 3.0 | 2.0 | 1170 | $2,595 | $2.22 | 44d | 1 | 0.28mi |
| 1305 Massachusetts Ave #103 Riverside, CA | 2.0 | 1.0 | 860 | $1,950 | $2.27 | 44d | 1 | 0.33mi |
| 1301 Wheaton Way Riverside, CA | 3.0 | 2.0 | 1152 | $2,750 | $2.39 | 2d | 1 | 0.36mi |
| 2442 Iowa Ave Riverside, CA | 2.0 | 1.0–1.5 | 743 | $2,551 | $3.43 | 0d | 17 | 0.43mi |
| 1251 Massachusetts Ave Riverside, CA | 1.0–2.0 | 1.0–2.0 | 785 | $2,300 | $2.93 | 44d | 7 | 0.47mi |
| 1201 W Blaine St Riverside, CA | 1.0–2.0 | 1.0 | 921 | $2,160 | $2.35 | 2d | 7 | 0.51mi |
| 1234 W Blaine St Riverside, CA | 2.0 | 1.0 | 564 | $2,450 | $4.34 | 0d | 13 | 0.59mi |
| 1175 W Blaine St Riverside, CA | 1.0–2.0 | 1.0–2.0 | 790 | $2,220 | $2.81 | 0d | 5 | 0.59mi |
| 3439 Anderson Ave Riverside, CA | 1.0 | 1.0 | 715 | $1,800 | $2.52 | 44d | 1 | 0.61mi |
| 3472 Anderson Ave Unit 02N Riverside, CA | 2.0 | 1.5 | 925 | $1,950 | $2.11 | 4d | 1 | 0.62mi |
| 3461 Anderson Ave Riverside, CA | 1.0 | 1.0 | 770 | $1,675 | $2.18 | 4d | 1 | 0.63mi |
| 3486 Anderson Ave Riverside, CA | 1.0 | 1.0 | 800 | $1,800 | $2.25 | 44d | 1 | 0.64mi |
| 1046 Spruce St Riverside, CA | 1.0–2.0 | 1.0–2.0 | 780 | $2,400 | $3.08 | 44d | 1 | 0.65mi |
| 3603 Chicago Ave Riverside, CA | 2.0 | 1.0 | 825 | $2,195 | $2.66 | 44d | 1 | 0.72mi |
| 1114 W Blaine St #205 Riverside, CA | 2.0 | 1.0 | 810 | $2,200 | $2.72 | 6d | 1 | 0.72mi |
| 1170 Tripoli St Riverside, CA | 2.0–3.0 | 1.0–2.0 | 837 | $545 | $0.65 | 44d | 1 | 0.74mi |
| 3429 Rustin Ave Riverside, CA | 2.0–3.0 | 2.0 | 1080 | $2,225 | $2.06 | 0d | 4 | 0.76mi |
| 1966 W Linden St Riverside, CA | 2.0 | 1.5 | 1000 | $2,100 | $2.10 | 13d | 1 | 0.78mi |
| 1966 W Linden St Unit 1960 Riverside, CA | 2.0 | 1.5 | 1000 | $2,100 | $2.10 | 25d | 1 | 0.78mi |
| 1147 W Linden St Riverside, CA | 2.0 | 2.0 | 830 | $963 | $1.16 | 11d | 1 | 0.79mi |
| 1436 Seventh St Unit C Riverside, CA | 2.0 | 2.0 | 850 | $1,850 | $2.18 | 25d | 1 | 0.80mi |
| 1120 W Linden St Riverside, CA | 1.0–2.0 | 1.0–2.0 | 750 | $2,260 | $3.01 | 0d | 11 | 0.87mi |
| 3307 Spruce St Riverside, CA | 2.0 | 1.0 | 848 | $2,700 | $3.18 | 21d | 1 | 0.92mi |
| 1471 Everton Pl Riverside, CA | 3.0 | 2.0 | 1152 | $2,400 | $2.08 | 44d | 1 | 0.94mi |
| 850 Prescott Way Unit D Riverside, CA | 2.0 | 1.0 | 750 | $1,795 | $2.39 | 6d | 1 | 0.95mi |
| 1415 Everton Pl Riverside, CA | 3.0 | 2.0 | 1152 | $1,000 | $0.87 | 44d | 1 | 0.95mi |
| 1424 Everton Pl Riverside, CA | 3.0 | 2.0 | 1152 | $2,700 | $2.34 | 19d | 1 | 0.97mi |
| 3170 Canyon Crest Dr Riverside, CA | 1.0–2.0 | 1.0–1.5 | 575 | $2,502 | $4.35 | 44d | 1 | 0.97mi |
| 807 W Blaine St Riverside, CA | 2.0 | 2.0 | 912 | $2,275 | $2.49 | 44d | 1 | 0.99mi |
| 3993 Iowa Ave Riverside, CA | 1.0–2.0 | 1.0 | 575 | $2,150 | $3.74 | 5d | 6 | 1.02mi |
| 3735 Kansas Ave Riverside, CA | 1.0–2.0 | 1.0 | 610 | $2,050 | $3.36 | 6d | 2 | 1.02mi |
| 2618 4th St Riverside, CA | 2.0 | 1.0 | 725 | $1,850 | $2.55 | 44d | 1 | 1.02mi |
| 3996 Iowa Ave Riverside, CA | 3.0 | 1.0–8.0 | 687 | $1,462 | $2.13 | 13d | 1 | 1.03mi |
| 3523 Strong St Riverside, CA | 3.0 | 2.0 | 1126 | $3,200 | $2.84 | 11d | 1 | 1.10mi |
| 3516 Tyco Dr Riverside, CA | 2.0 | 2.0 | 1037 | $2,600 | $2.51 | 44d | 1 | 1.15mi |
| 1864 12th St Unit 19 Riverside, CA | 1.0 | 1.0 | 700 | $1,725 | $2.46 | 17d | 1 | 1.18mi |
| 1864 12th St Riverside, CA | 1.0 | 1.0 | 720 | $1,745 | $2.42 | 25d | 1 | 1.19mi |
| 1864 12th St Riverside, CA | 1.0 | 1.0 | 700 | $1,725 | $2.46 | 13d | 1 | 1.19mi |
| 3077 Wendell Way Riverside, CA | 3.0 | 2.0 | 1078 | $2,950 | $2.74 | 4d | 1 | 1.21mi |
Listing history 7 events
-
2026-06-21days on market $108,000 Coming Soon 8 DOM
-
2026-06-18days on market $108,000 Coming Soon 5 DOM
-
2026-06-17days on market $108,000 Coming Soon 4 DOM
-
2026-06-16days on market $108,000 Coming Soon 3 DOM
-
2026-06-15days on market $108,000 Coming Soon 2 DOM
-
2026-06-13remarks 119-char remark
-
2026-06-13$108,000 Coming Soon 1 DOM
ⓘ Source: listings_history table (triggers on properties + properties_extension) + one-shot
backfill from property_details.listing_events for pre-trigger history.
Climate risk First Street
- Flood 1/10 Low FEMA zone X (unshaded) · 0% chance over 30 yrs
- Wildfire 7/10 Severe
- Heat 8/10 Severe 7 d/yr ≥101°F today · 20 d/yr by 30 yrs out
- Wind 1/10 Low
- Air quality 9/10 Extreme 22 unhealthy d/yr today · 27 by 30 yrs out
Nearby sold comps map
Loading sold comps map…
Walkable amenities ~0.75 mi
Loading nearby amenities…
Taxation est. · year 1
- Rental income
- $26,789
- − Mortgage interest
- −$6,050
- − Property taxes
- −$1,620
- − Insurance
- −$540
- − Repairs & maintenance
- −$2,143
- − Management
- −$2,143
- − Depreciation
- −$3,142
- Taxable income
- $11,151
- Est. tax owed @ 24.0%
- −$2,676
- After-tax cash flow
- $9,530/yr
For passive investors: Depreciation is non-cash, so a rental often shows a tax loss while cash-flowing — sheltering income. Rental losses are passive: they offset passive income freely, and up to $25,000/yr can offset ordinary (W-2) income if you actively participate and your MAGI is under $100k (phasing out to $0 by $150k); unused losses carry forward. On sale, claimed depreciation is recaptured at up to 25%, and gains may owe capital-gains tax (a 1031 exchange can defer both). Figures are a year-1 estimate at your 24.0% rate — not tax advice; consult a CPA.
Schools (NCES district)
- District
- Riverside Unified
- NCES district ID
- 0633150
- Math proficiency
- 36% ▲ 1.00%
- Reading proficiency
- 51% ▲ 2.00%
- Median HH income
- $62,038
- Composite
- 40.8/100
- National rank
- #7563
- State rank
- #574 of 1400 in CA
Livability — Riverside
- Score
- 66/100
- State rank
- #337
- US rank
- #11613
Category grades
Schools grade is shown separately in the Schools card above.
Census & demographics
- Census place
- Riverside, CA
- County
- Riverside County · 2,287,001 people
- City population
- 367,890
- Metro
- Riverside-San Bernardino-Ontario, CA
- Population (ZIP)
- 64,015
- Household income
- $75,303
- Rent vs Own
- Severe rent burden
- 3590.0
Population outlook (Riverside County) Hauer SSP2
- Today (2025)
- 2,664,475 people
- By 2030
- 2,802,692 · +5.2%
- By 2040
- 3,050,904 · +14.5%
- By 2050
- 3,256,783 · +22.2%
- By 2075
- 3,655,058 · +37.2%
- By 2100
- 3,766,594 · +41.4%
Race, ethnicity, and origin ACS 2023
- Neighborhood character
- Diverse neighborhood (Simpson 0.66)
- Race & ethnicity
- Hispanic / Latino 52% White 21% Asian 14% Two or more races 13% Black 9% Native American 1%
- Hispanic origin (detail)
- Mexican 44%
- Common ancestry
- Italian 2% Lithuanian 1% Ukrainian 1%
- Foreign-born
- 23% · Canada, China, South Korea
- Languages at home
- 52% English-only · Spanish 36% Chinese 4% Other Indo-European 3%
Political lean MEDSL · Riverside
- 2024 margin
- Toss-up / Even · D 48.0% · R 49.3% · Other 2.6%
- 2008→2024 swing
- -3.6pp toward R · 2008: 2.3pp · 2024: -1.3pp
- All cycles
- 2024: R+1.3 2020: D+8.0 2016: D+4.3 2012: R+0.4 2008: D+2.3
Not yet ingested
- Civics
- —
Market trends
- HPI YoY
- ▼ -401.54%
- Current HPI
- 442.9617
- Rent YoY
- ▲ 0.53%
- Metro
- Riverside-San Bernardino-Ontario, CA
- State GDP YoY
- ▲ 3.21%
- F500 in state
- 116
Industry mix (Fortune 500 HQ in CA)
| Industry | F500 HQs | Revenue |
|---|---|---|
| Technology | 27 | $1,492B |
|
||
| Financial Services | 3 | $174B |
|
||
| Retail | 3 | $44B |
|
||
| Insurance | 3 | $26B |
|
||
| Media / Entertainment | 2 | $115B |
|
||
| Pharmaceuticals / Biotech | 2 | $62B |
|
||
Price history
+2985.7% since first listed5 events — show timeline
- 2026-06-13 Coming Soon $108,000 CRMLS
- 2020-05-15 Sold (MLS) $35,000 CRMLS
- 2020-04-12 Contingent — CRMLS
- 2020-04-07 Price Changed $35,000 CRMLS
- 2020-04-07 Listed $3,500 CRMLS
Cash-flow waterfall
monthlySold comps — $/sqft
last 12 mo · ≤1 miLoading sold comps…