4533 Maughn Dr · Riverside, OH
Flood risk 1/10 · Minimal
- FEMA flood zone
- X (unshaded)
- Chance of flooding over 30 yrs
- 0.0%
- Est. flood insurance / yr
- $473 – $860
Fire risk 1/10 · Minimal
- Est. fire insurance / yr
- $713 – $1,323
Heat risk 3/10 · Minor
- Hot days now (above 101°F)
- 7 days/yr
- Hot days in 30 yrs
- 18 days/yr
Wind risk 2/10 · Minimal
- Chance of severe wind over 30 yrs
- 0.0%
Air-quality risk 4/10 · Minor
- Unhealthy air days now
- 4 days/yr
- Unhealthy air days in 30 yrs
- 5 days/yr
Risk factors via First Street. Map © Google.
Why this score? — see what drove the C+ grade
The composite is a weighted blend of 9 inputs, each scored 0–100. Each bar is that input's sub-score; the figure is the points it added to the 100-point composite (weight × sub-score).
- Cash flow +20.5/30.0
- ARV discount +15.0/15.0
- DSCR +6.5/10.0
- 1% rule +5.6/10.0
- Rent growth +3.9/5.0
- Schools +3.5/10.0
- Livability +3.2/5.0
- Condition / age +2.5/5.0
- Appreciation +0.0/10.0
$119,900
🖨 Deal sheet (PDF) 📄 Offer letter ✓ Due diligence
Listing remarks MLS
Lots of potential for your next home or investment. Located in a secluded street, closed to E. 4th and Smithville. Some previous updates included oak kitchen, Laminated flooring in the dining room, kitchen and a lower mid-level family room. Remodeled bathroom in the lower level. 3rd bd and 1 more rooms are in the lower level. Private yard. Lots of enjoyment! This is a Fannie Mae Property. Purchase this property witha s little as 3% down. This property is approved for Home Path Renovation Mortgage Financing. Purchase of this property will be for cash or terms acceptable to the seller. For the First 15 days Owner Occupant only.
Key facts
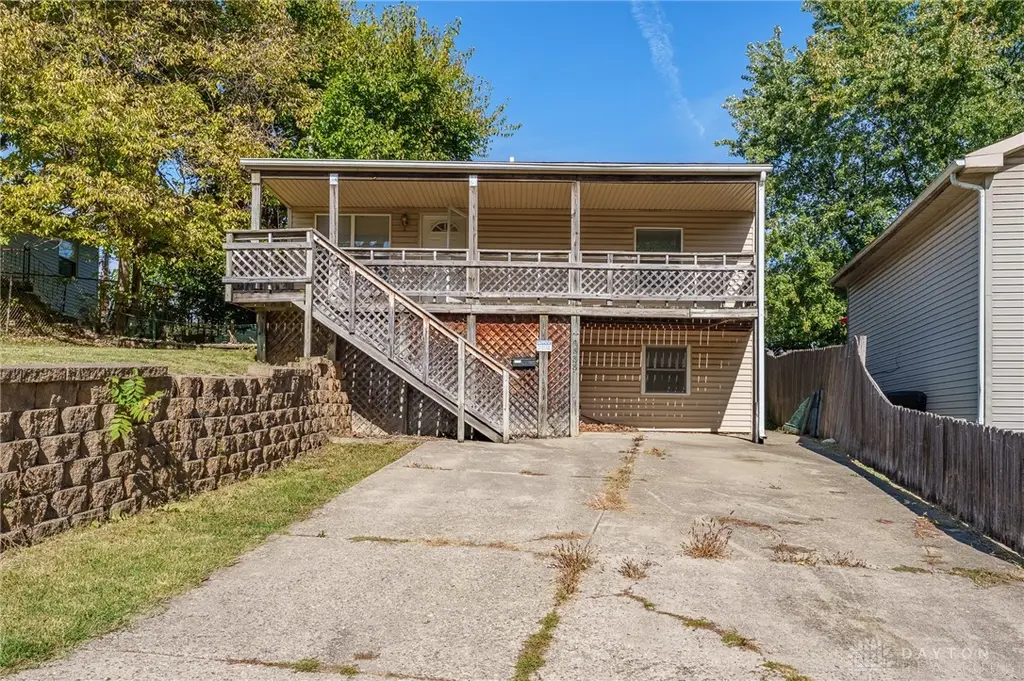
- Covered back patio
- Large front deck
- 6,342 sq ft lot
Tags
Neighborhood map
What this means for you Summary
Snapshot
- This is a 3-bed/1.0-bath single-family listed at $120k.
Deal economics
- At list price, monthly cash flow is $159 ($2k/yr) — positive.
- The deal already cash-flows at list — no discount required.
- Meets the 1% rule at list price ($1k rent vs $120k).
- Cap rate 7.9% vs local median 4.9% in Riverside — top-decile yield for the area; either an underpriced asset or a hidden risk that comps aren't pricing in. Stress-test before assuming the spread holds.
Location & tenants
- Location reads 64/100 on livability (#775 in OH) — a middle-class / working-renter tenant base. Strengths: cost of living A+, housing A+; Watch: crime D+, employment D+, amenities D.
- Mad River Local (suburban): math 34% / reading 50% proficiency, ranked #531 of 656 in OH (top 81%) — families likely to look elsewhere, expect single-tenant / working-renter base with shorter leases.
- Zoned schools: Stebbins High School (math 9% / reading 56%, grade F, #604 of 781 statewide, top 77%, 1,091 students, 51% FRL) — zoned schools at 51% FRL track the district average.
- Market conditions: Rents rising fast (+5.8%/yr); 129 active listings in the ZIP; 32 comparable units currently listed for rent nearby; rentals at typical pace (median 16d on market — plan ~3-4 weeks tenant-placement turnaround); solid renter incomes; 907 units permitted in Montgomery County in 2024 (416 in 5+ unit buildings).
Forward outlook
- Local home prices are declining (-3.0%/yr); year-one equity from $829 of loan paydown is wiped out by about $4k of value loss. Plan a longer hold.
- Montgomery County population projected at -10% by 2050 — secular population decline; favor cash flow + early exit over multi-decade hold.
Negotiation context
- Only 4 days on market — expect competitive offers; lowballing is unlikely to land.
- 3 sale attempts since 15y ago with the ask held roughly flat each time — persistent listings suggest the price (not the market) is what's stuck; bring a comps-based counter.
- Current owner paid $50k; list at $120k implies a 140% gain — meaningful room to come down on a strong offer.
Risks & watch-outs
- Watch-outs: built in 1953 — expect roof / HVAC / electrical / plumbing capex.
Questions for the listing agent
- Built in 1953 — when were the roof, HVAC, electrical panel, plumbing, and water heater last replaced?
- Is there a deadline driving the sale (1031 exchange, divorce, estate, relocation)? That informs how much negotiation room exists.
- Schools are D-rated, which usually means shorter tenancies and higher turnover. Who's the typical renter profile here, and what's been the actual vacancy rate?
- Crime grade is D in this area — have there been break-ins, vandalism, or insurance claims at this property in the last 3 years? What carrier currently insures it and at what premium?
- What's the average days-on-market for RENTAL listings here right now (not sales)? A rising rental-DOM trend means longer vacancies and softer asking-rent achievability than the comps imply.
- What's the recent tenant-quality profile in this submarket — average credit score on applications, eviction rate, late-payment / NSF rate, and stable-employment percentage? A property-management company in the area should have these aggregated.
- How much new for-sale + rental construction is in the pipeline within 1–3 miles? Heavy new supply typically softens prices + rents 12–24 months out; constrained supply supports both.
Investment metrics
- 1% rule
- 1.06% ✓
- Cap rate
- 7.88%
- Cash-on-cash
- 5.68%
- DSCR
- 1.25
- GRM
- 7.9
CMA / ARV
- ARV (on-the-fly)
- $145,800
- Comps found
- 12
Show comp detail 12 sales within ~0.75 mi
| Address | Dist | Beds/Ba | Sqft | Sold | Price | $/sf | Match |
|---|---|---|---|---|---|---|---|
| 4533 Maughn Dr | 0.00mi | 3/2.0 | 900 (0%) | 1mo | $127,900 | $142 | 95 |
| 4516 Glen Martin Dr | 0.03mi | 3/1.0 | 1,015 (+13%) | 1mo | $147,000 | $145 | 77 |
| 2230 Hazelton Ave | 0.52mi | 3/1.0 | 925 (+3%) | 1mo | $175,000 | $189 | 70 |
| 312 Dawnview Ave | 0.16mi | 3/1.0 | 1,023 (+14%) | 1mo | $199,900 | $195 | 69 |
| 41 N Westview Ave | 0.56mi | 3/2.0 | 858 (-5%) | 0mo | $150,000 | $175 | 62 |
| 231 N Westview Ave | 0.66mi | 3/1.0 | 960 (+7%) | 0mo | $160,000 | $167 | 58 |
| 421 Alexander Dr | 0.51mi | 2/1.0 (-1) | 831 (-8%) | 1mo | $135,000 | $162 | 58 |
| 3509 E 2nd St | 0.70mi | 2/1.0 (-1) | 930 (+3%) | 2mo | $105,000 | $113 | 55 |
| 2400 Longview Ave | 0.47mi | 3/1.0 | 1,025 (+14%) | 1mo | $125,000 | $122 | 54 |
| 1762 Suman Ave | 0.56mi | 2/1.0 (-1) | 804 (-11%) | 2mo | $110,000 | $137 | 49 |
| 525 Blue Bell Rd | 0.72mi | 2/1.0 (-1) | 816 (-9%) | 1mo | $110,000 | $135 | 46 |
| 1333 Radio Rd | 0.74mi | 3/1.0 | 768 (-15%) | 0mo | $133,000 | $173 | 40 |
Match score weights: distance 35% · size 25% · config 20% · recency 20%. Top-matched comps best support the ARV.
Projected returns pro-forma
-3.0% appreciation · 5.79% rent growth · sell at horizon
- IRR
- -4.3%
- Equity multiple
- 0.83×
- Total profit
- $-5,600
- Equity at exit
- $17,877
- IRR
- 8.4%
- Equity multiple
- 1.72×
- Total profit
- $24,243
- Equity at exit
- $10,367
Cash invested: $33,572 (down + closing). Projections, not guarantees.
Landlord ↔ Tenant lean methodology
- Overall (STATE)
- 73 Landlord-Friendly
- State Ohio
- 73 Landlord-Friendly · R+6
- County
- — inherits STATE
- City
- — inherits STATE
ZIP-level market 45431
- Home prices YoY
- -35.0%
- Rents YoY
- 5.8%
- Active inventory
- 129
- Price-to-rent
- 7.9×
Monthly cashflow live
- Estimated rent
- $1,273 high interval (Pro) →
- Mortgage (P&I)
- −$629
- Tax from tax record
- −$168 /mo · $2,013/yr
- Insurance
- −$50
- HOA
- −$0
- Vacancy / Maint / Mgmt
- −$267
- Net cashflow
- $159
Break-even live
Sensitivity live
| Price | -10% $227 | -5% $193 | +0% $159 | +5% $125 | +10% $91 |
|---|---|---|---|---|---|
| Rent | -10% $58 | -5% $109 | +0% $159 | +5% $209 | +10% $260 |
| Rate | -1.0pp $219 | -0.5pp $189 | base $159 | +0.5pp $128 | +1.0pp $96 |
UW: 25.0% down · 7.5% · 30yr · 1.5% tax · 5.0% vac · 8.0% maint · 8.0% mgmt
Financing live
Cash to close
- Down payment
- $29,975
- Closing costs
- $3,597
- Reserves months
- —
- Total cash needed
- —
Loan-product check · same deal, 3 products live
Conventional
25% down · 7.5% · 30yr
- Down + closing
- —
- Monthly P&I
- —
- Monthly cashflow
- —
- DSCR
- —
- Eligible?
- —
Personal DTI + credit; lowest rate.
DSCR
20% down · 8.5% · 30yr
- Down + closing
- —
- Monthly P&I
- —
- Monthly cashflow
- —
- DSCR
- —
- Eligible?
- —
No personal income docs; deal must DSCR.
Hard money
10% down · 12.0% · 12mo
- Down + closing
- —
- Monthly P&I
- —
- Monthly cashflow
- —
- DSCR
- —
- Eligible?
- —
Short-term bridge; refi at stabilization.
Rent comps 32 comps
| Address | Beds | Baths | Sqft | Rent | $/sqft | DOM | Units | Dist |
|---|---|---|---|---|---|---|---|---|
| 4403 Burkhardt Ave Dayton, OH | 3.0 | 1.0–2.0 | 800 | $1,100 | $1.38 | 4d | 1 | 0.24mi |
| 4644 Burkhardt Ave Dayton, OH | 1.0–2.0 | 1.0 | 725 | $1,095 | $1.51 | 4d | 9 | 0.29mi |
| 515 Mertland Ave Dayton, OH | 2.0 | 1.0 | 876 | $950 | $1.08 | 25d | 1 | 0.44mi |
| 517 Mertland Ave Dayton, OH | 2.0 | 1.0 | 876 | $875 | $1.00 | 16d | 1 | 0.44mi |
| 1704 Huffman Ave Unit 1706 Huffman Dayton, OH | 2.0 | 1.0 | 896 | $900 | $1.00 | 5d | 1 | 0.48mi |
| 144 N Quentin Ave Dayton, OH | 3.0 | 1.0 | 1038 | $1,600 | $1.54 | 45d | 1 | 0.53mi |
| 1762 Suman Ave Dayton, OH | 2.0 | 1.0 | 804 | $1,150 | $1.43 | 23d | 1 | 0.53mi |
| 1770 Suman Ave Dayton, OH | 2.0 | 1.0 | 904 | $1,145 | $1.27 | 45d | 1 | 0.54mi |
| 211 N Cherrywood Ave Unit 2 Dayton, OH | 2.0 | 1.0 | 950 | $795 | $0.84 | 5d | 1 | 0.55mi |
| 3719 E 3rd St Unit 3717 Dayton, OH | 3.0 | 1.0 | 1092 | $1,100 | $1.01 | 4d | 1 | 0.56mi |
| 1671 Gummer Ave Dayton, OH | 2.0 | 1.0 | 704 | $1,100 | $1.56 | 4d | 1 | 0.58mi |
| 1620 Gummer Ave Dayton, OH | 2.0 | 1.0 | 875 | $950 | $1.09 | 5d | 1 | 0.62mi |
| 334 Blackwood Ave Unit 2 Dayton, OH | 2.0 | 1.0 | 1000 | $850 | $0.85 | 25d | 1 | 0.67mi |
| 334 Blackwood Ave Unit 3 Dayton, OH | 2.0 | 1.0 | 1000 | $850 | $0.85 | 5d | 1 | 0.67mi |
| 1356 Huffman Ave Unit 1356 Dayton, OH | 2.0 | 1.0 | 864 | $975 | $1.13 | 45d | 1 | 0.71mi |
| 210 S Hedges St Dayton, OH | 2.0 | 1.5 | 1048 | $1,045 | $1.00 | 23d | 1 | 0.73mi |
| 1029 Blakley Dr Dayton, OH | 3.0 | 1.0 | 947 | $1,300 | $1.37 | 4d | 1 | 0.75mi |
| 1371 Florence St Dayton, OH | 2.0 | 1.0 | 850 | $800 | $0.94 | 5d | 1 | 0.80mi |
| 1300 Chardon Ct Dayton, OH | 2.0 | 1.0 | 970 | $1,200 | $1.24 | 4d | 1 | 0.83mi |
| 224 S Irwin St Unit 226 Dayton, OH | 2.0 | 1.0 | 992 | $900 | $0.91 | 5d | 1 | 0.86mi |
| 1143 Blakley Dr Dayton, OH | 3.0 | 1.0 | 947 | $1,195 | $1.26 | 16d | 1 | 0.88mi |
| 101 N Irwin St Dayton, OH | 2.0 | 1.0 | 900 | $1,100 | $1.22 | 5d | 1 | 0.98mi |
| 222 Klee Ave Unit 222B Dayton, OH | 2.0 | 1.0 | 650 | $750 | $1.15 | 45d | 1 | 1.02mi |
| 120 S Monmouth St Dayton, OH | 2.0 | 1.0 | 1000 | $950 | $0.95 | 45d | 1 | 1.05mi |
| 1354 Ohmer St Unit 1354C Dayton, OH | 2.0 | 1.0 | 900 | $700 | $0.78 | 45d | 1 | 1.11mi |
| 1354 Ohmer St Unit 1354A Dayton, OH | 2.0 | 1.0 | 900 | $675 | $0.75 | 25d | 1 | 1.11mi |
| 3100 Linden Ave Unit 3102 Dayton, OH | 2.0 | 1.0 | 1035 | $995 | $0.96 | 45d | 1 | 1.14mi |
| 1430 Coventry Rd Dayton, OH | 2.0 | 1.0 | 1106 | $1,125 | $1.02 | 16d | 1 | 1.24mi |
| 1659 Hearthstone Dr Dayton, OH | 3.0 | 1.0 | 1102 | $1,195 | $1.08 | 4d | 1 | 1.37mi |
| 854 Santa Cruz Ave Dayton, OH | 3.0 | 1.0 | 1060 | $1,300 | $1.23 | 45d | 1 | 1.40mi |
| 2012 Saint Charles Ave Dayton, OH | 2.0 | 1.0 | 945 | $1,250 | $1.32 | 45d | 1 | 1.42mi |
| 29 N Garfield St Dayton, OH | 3.0 | 1.0 | 1092 | $1,000 | $0.92 | 25d | 1 | 1.45mi |
Listing history 12 events
-
2026-04-14status Pending
-
2026-04-10$119,900 Active
-
2025-11-18historical
-
2025-10-25price $148,900
-
2025-10-17$149,900 Active
-
2025-10-15soldstatus $50,000
-
2011-09-23soldstatus $34,900 Closed 636-char remark
Show marketing remark (636 chars)
Lots of potential for your next home or investment. Located in a secluded street, closed to E. 4th and Smithville. Some previous updates included oak kitchen, Laminated flooring in the dining room, kitchen and a lower mid-level family room. Remodeled bathroom in the lower level. 3rd bd and 1 more rooms are in the lower level. Private yard. Lots of enjoyment! This is a Fannie Mae Property. Purchase this property witha s little as 3% down. This property is approved for Home Path Renovation Mortgage Financing. Purchase of this property will be for cash or terms acceptable to the seller. For the First 15 days Owner Occupant only.
-
2011-09-23soldstatus $34,900 636-char remark
Show marketing remark (636 chars)
Lots of potential for your next home or investment. Located in a secluded street, closed to E. 4th and Smithville. Some previous updates included oak kitchen, Laminated flooring in the dining room, kitchen and a lower mid-level family room. Remodeled bathroom in the lower level. 3rd bd and 1 more rooms are in the lower level. Private yard. Lots of enjoyment! This is a Fannie Mae Property. Purchase this property witha s little as 3% down. This property is approved for Home Path Renovation Mortgage Financing. Purchase of this property will be for cash or terms acceptable to the seller. For the First 15 days Owner Occupant only.
-
2011-09-19historical 636-char remark
Show marketing remark (636 chars)
Lots of potential for your next home or investment. Located in a secluded street, closed to E. 4th and Smithville. Some previous updates included oak kitchen, Laminated flooring in the dining room, kitchen and a lower mid-level family room. Remodeled bathroom in the lower level. 3rd bd and 1 more rooms are in the lower level. Private yard. Lots of enjoyment! This is a Fannie Mae Property. Purchase this property witha s little as 3% down. This property is approved for Home Path Renovation Mortgage Financing. Purchase of this property will be for cash or terms acceptable to the seller. For the First 15 days Owner Occupant only.
-
2011-07-13$34,900 636-char remark
Show marketing remark (636 chars)
Lots of potential for your next home or investment. Located in a secluded street, closed to E. 4th and Smithville. Some previous updates included oak kitchen, Laminated flooring in the dining room, kitchen and a lower mid-level family room. Remodeled bathroom in the lower level. 3rd bd and 1 more rooms are in the lower level. Private yard. Lots of enjoyment! This is a Fannie Mae Property. Purchase this property witha s little as 3% down. This property is approved for Home Path Renovation Mortgage Financing. Purchase of this property will be for cash or terms acceptable to the seller. For the First 15 days Owner Occupant only.
-
2003-04-18soldstatus $70,000
-
1994-12-02soldstatus $6,450
ⓘ Source: listings_history table (triggers on properties + properties_extension) + one-shot
backfill from property_details.listing_events for pre-trigger history.
Tax reassessment forecast OH · Partial reset (capped growth)
- Current annual tax
- $2,013 · $168/mo
- Projected year-2 tax
- $2,013 · $168/mo
- Expected delta
- $0/yr ($0/mo · 0.0%)
ⓘ Screening estimate from a state-policy table — verify with the county assessor before closing.
Climate risk First Street
- Flood 1/10 Low FEMA zone X (unshaded) · 0% chance over 30 yrs
- Wildfire 1/10 Low
- Heat 3/10 Moderate 7 d/yr ≥101°F today · 18 d/yr by 30 yrs out
- Wind 2/10 Low 0% chance of damaging wind over 30 yrs
- Air quality 4/10 Moderate 4 unhealthy d/yr today · 5 by 30 yrs out
Nearby sold comps map
Loading sold comps map…
Walkable amenities ~0.75 mi
Loading nearby amenities…
Taxation est. · year 1
- Rental income
- $15,273
- − Mortgage interest
- −$6,716
- − Property taxes
- −$2,013
- − Insurance
- −$600
- − Repairs & maintenance
- −$1,222
- − Management
- −$1,222
- − Depreciation
- −$3,488
- Taxable income
- $13
- Est. tax owed @ 24.0%
- −$3
- After-tax cash flow
- $1,905/yr
For passive investors: Depreciation is non-cash, so a rental often shows a tax loss while cash-flowing — sheltering income. Rental losses are passive: they offset passive income freely, and up to $25,000/yr can offset ordinary (W-2) income if you actively participate and your MAGI is under $100k (phasing out to $0 by $150k); unused losses carry forward. On sale, claimed depreciation is recaptured at up to 25%, and gains may owe capital-gains tax (a 1031 exchange can defer both). Figures are a year-1 estimate at your 24.0% rate — not tax advice; consult a CPA.
Schools (NCES district)
- District
- Mad River Local
- NCES district ID
- 3904870
- Math proficiency
- 34% ▼ -23.00%
- Reading proficiency
- 50% ▼ -8.00%
- Median HH income
- $41,560
- Composite
- 35.28/100
- National rank
- #4972
- State rank
- #531 of 656 in OH
Livability — Riverside
- Score
- 64/100
- State rank
- #775
- US rank
- #14045
Category grades
Schools grade is shown separately in the Schools card above.
Census & demographics
- Census place
- Riverside, OH
- County
- Greene County · 132,120 people
- Metro
- Dayton-Kettering, OH
- Population (ZIP)
- 27,951
- Household income
- $83,175
- Rent vs Own
- Severe rent burden
- 622.0
Population outlook (Montgomery County) Hauer SSP2
- Today (2025)
- 523,241 people
- By 2030
- 514,948 · -1.6%
- By 2040
- 493,378 · -5.7%
- By 2050
- 469,639 · -10.2%
- By 2075
- 418,360 · -20.0%
- By 2100
- 353,315 · -32.5%
Race, ethnicity, and origin ACS 2023
- Neighborhood character
- Predominantly White (78%)
- Race & ethnicity
- White 78% Two or more races 8% Hispanic / Latino 6% Asian 5% Black 4%
- Hispanic origin (detail)
- Mexican 1% Puerto Rican 2%
- Common ancestry
- Italian 3% Slovak 2% Lithuanian 2%
- Foreign-born
- 6% · South Korea, Canada, Jamaica
- Languages at home
- 92% English-only · Spanish 3% Other Indo-European 2% Korean 1%
Political lean MEDSL · Montgomery
- 2024 margin
- Toss-up / Even · D 49.8% · R 49.3%
- 2008→2024 swing
- -5.8pp toward R · 2008: 6.2pp · 2024: 0.5pp
- All cycles
- 2024: D+0.5 2020: D+2.2 2016: R+1.2 2012: D+3.1 2008: D+6.2
Not yet ingested
- Civics
- —
Market trends
- HPI YoY
- ▼ -148.58%
- Current HPI
- 276.444
- Rent YoY
- ▲ 5.79%
- Metro
- Dayton-Kettering, OH
- State GDP YoY
- ▲ 1.98%
- F500 in state
- 48
Industry mix (Fortune 500 HQ in OH)
| Industry | F500 HQs | Revenue |
|---|---|---|
| Insurance | 3 | $145B |
|
||
| Industrial Machinery | 3 | $49B |
|
||
| Financial Services | 3 | $24B |
|
||
| Consumer Goods | 2 | $93B |
|
||
| Aerospace / Defense | 2 | $47B |
|
||
| Utilities | 2 | $33B |
|
||
Price history
+1758.9% since first listed12 events — show timeline
- 2026-04-14 Pending — Dayton MLS
- 2026-04-10 Listed $119,900 Dayton MLS
- 2025-11-18 Listing Removed — Dayton MLS
- 2025-10-25 Price Changed $148,900 Dayton MLS
- 2025-10-17 Listed $149,900 Dayton MLS
- 2025-10-15 Sold (Public Records) $50,000 Public Records
- 2011-09-23 Sold (MLS) $34,900 Dayton MLS
- 2011-09-23 Sold (MLS) $34,900 Dayton MLS
- 2011-09-19 Listing Removed — Dayton MLS
- 2011-07-13 Listed $34,900 Dayton MLS
- 2003-04-18 Sold (Public Records) $70,000 Public Records
- 1994-12-02 Sold (Public Records) $6,450 Public Records
Property tax history
+0.4%/yrLatest (2025): $2,013 · +8.2% YoY. Source: county tax records.
Cash-flow waterfall
monthlySold comps — $/sqft
last 12 mo · ≤1 miLoading sold comps…