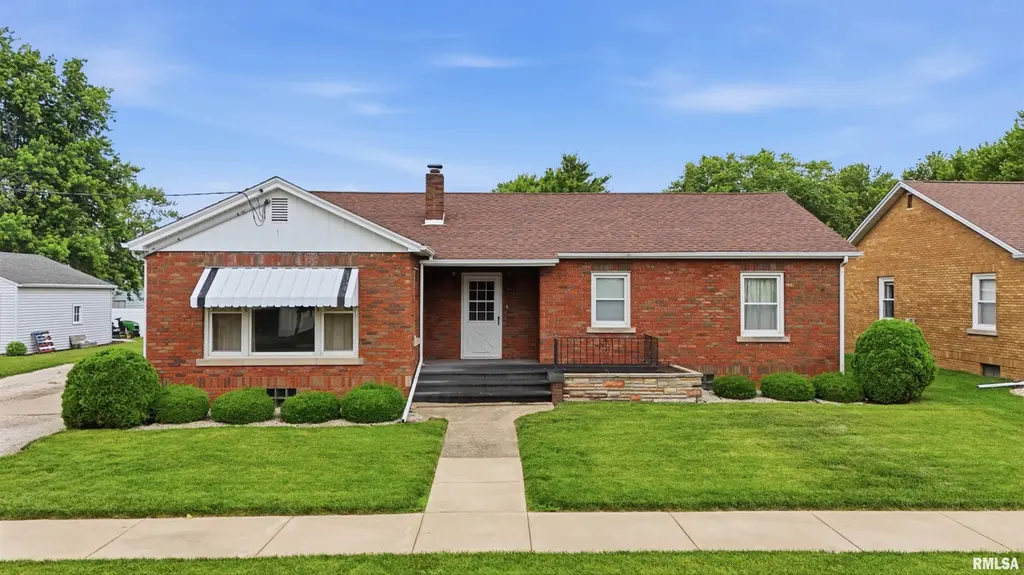
507 W Partridge St · Metamora, IL
Flood risk 1/10 · Minimal
- FEMA flood zone
- X (unshaded)
- Chance of flooding over 30 yrs
- 0.0%
- Est. flood insurance / yr
- $473 – $860
Fire risk 1/10 · Minimal
- Est. fire insurance / yr
- $804 – $1,492
Heat risk 3/10 · Minor
- Hot days now (above 105°F)
- 7 days/yr
- Hot days in 30 yrs
- 18 days/yr
Wind risk 2/10 · Minimal
- Chance of severe wind over 30 yrs
- 1.0%
Air-quality risk 2/10 · Minimal
- Unhealthy air days now
- 1 days/yr
- Unhealthy air days in 30 yrs
- 1 days/yr
Risk factors via First Street. Map © Google.
Why this score? — see what drove the F grade
The composite is a weighted blend of 9 inputs, each scored 0–100. Each bar is that input's sub-score; the figure is the points it added to the 100-point composite (weight × sub-score).
- Cash flow +8.0/30.0
- Appreciation +7.6/10.0
- Schools +4.1/10.0
- Livability +4.0/5.0
- 1% rule +3.3/10.0
- Rent growth +2.5/5.0
- Condition / age +2.5/5.0
- DSCR +2.0/10.0
- ARV discount +0.0/15.0
$229,000
🖨 Deal sheet (PDF) 📄 Offer letter ✓ Due diligence
Listing remarks
Looking for the perfect place to plant your roots? Check out this quality built 3 bedroom brick ranch that blends classic charm with completely modern, worry-free updates. Big ticket items are already done for you: a newer roof (2013), updated windows, and high efficiency furnace (2019). Unwind in your private 3 season porch--the perfect spot for morning coffee or bug free summer nights. Immediate possession. Walking distance to parochial grade school, community pool, and golf course.
Key facts
- Newer roof
- Updated windows
- 6,800 sq ft lot
Tags
Property features AI
Finance
- Other: Zoned R
- HOA & community: No association fee
Exterior
- Parking: Attached 1-car garage
- Utilities: Public water; Public sewer
- Home design: Single-family residence; Built in 1951
- Construction: Shingle roof; Full unfinished basement
- Exterior features: Replacement windows; Lean-to; Level lot
Interior
- Kitchen: Kitchen with vinyl flooring; Microwave; Refrigerator
- Bedrooms: Three bedrooms (all on the main level)
- Flooring: Carpet in living areas and bedrooms; Vinyl in the kitchen
- Bathrooms: One full bathroom
- Heating & cooling: Forced air heating; High-efficiency heating; Central air conditioning
- Interior features: Ceiling fans; Three-season porch
- Laundry & utility: Washer; Dryer; Gas water heater
Neighborhood map
What this means for you Summary
Snapshot
- This is a 3-bed/1.0-bath single-family listed at $229k.
Deal economics
- At list price, monthly cash flow is $-237 ($-3k/yr) — negative.
- To cash-flow at today's rent, offer at most $187k (18.3% below list).
- To meet the 1% rule (rent ≥ 1% of price), the offer needs to be $191k (16.7% below list).
- Recommended offer: $187k (18.3% below list) — sets the bar for cash-flow.
Location & tenants
- Location reads 81/100 on livability (#98 in IL, #1,582 nationally) — a professional / high-income tenant draw. Strengths: crime A+, employment A+, cost of living A+; Watch: amenities F, commute F.
- County Of Woodford School (town): math 47% / reading 44% proficiency, ranked #75 of 620 in IL (top 12%) — families likely to look elsewhere, expect single-tenant / working-renter base with shorter leases.
- Zoned schools: Metamora High School (math 47% / reading 44%, grade D-, #58 of 693 statewide, top 8%, 915 students, 0% FRL).
- Market conditions: 99 active listings in the ZIP; 35 units permitted in Woodford County in 2024 (0 in 5+ unit buildings).
Forward outlook
- In year one you build about $13k of equity ($2k loan paydown + $12k appreciation (5.2% local appreciation)).
- Woodford County population projected to shrink 3% by 2050 — rents likely to lag national; underwrite the cash flow, not the appreciation.
- By year 3, paydown + projected appreciation supports a ~$33k cash-out refi (75% LTV) — recoverable capital for the next deal without selling this one.
Negotiation context
- Only 9 days on market — expect competitive offers; lowballing is unlikely to land.
Risks & watch-outs
- Watch-outs: built in 1951 — expect roof / HVAC / electrical / plumbing capex.
Questions for the listing agent
- What do current leases actually rent for vs. the listed asking? Can we see a recent rent roll and the last 12 months of T-12 income?
- Built in 1951 — when were the roof, HVAC, electrical panel, plumbing, and water heater last replaced?
- Is there a deadline driving the sale (1031 exchange, divorce, estate, relocation)? That informs how much negotiation room exists.
- Schools are A-rated — typically a magnet for longer-tenancy family renters. What's the average tenant stay here, and is there a school-zone premium baked into asking?
- The area grade is low — what's the realistic commute time and amenity access for the typical tenant pool here? Any planned neighborhood developments (good or bad) we should know about?
- What's the average days-on-market for RENTAL listings here right now (not sales)? A rising rental-DOM trend means longer vacancies and softer asking-rent achievability than the comps imply.
- What's the recent tenant-quality profile in this submarket — average credit score on applications, eviction rate, late-payment / NSF rate, and stable-employment percentage? A property-management company in the area should have these aggregated.
- How much new for-sale + rental construction is in the pipeline within 1–3 miles? Heavy new supply typically softens prices + rents 12–24 months out; constrained supply supports both.
Investment metrics
- 1% rule
- 0.83% ✗
- Cap rate
- 5.05%
- Cash-on-cash
- -4.44%
- DSCR
- 0.80
- GRM
- 10.0
CMA / ARV
- ARV (on-the-fly)
- $168,630
- Comps found
- 12
Show comp detail 12 sales within ~0.75 mi
| Address | Dist | Beds/Ba | Sqft | Sold | Price | $/sf | Match |
|---|---|---|---|---|---|---|---|
| 417 W Monroe St | 0.14mi | 3/2.0 | 1,561 (+2%) | 1mo | $239,900 | $154 | 86 |
| 320 W Michigan Ave | 0.26mi | 3/2.0 | 1,590 (+4%) | 1mo | $245,000 | $154 | 77 |
| 503 W Mount Vernon St | 0.07mi | 4/1.5 (+1) | 1,588 (+4%) | 13mo | $175,000 | $110 | 73 |
| 216 W Partridge St | 0.19mi | 2/1.0 (-1) | 1,538 (+0%) | 16mo | $161,000 | $105 | 73 |
| 414 S Menard St | 0.46mi | 3/1.5 | 1,567 (+2%) | 7mo | $158,000 | $101 | 68 |
| 121 N Tazewell St | 0.09mi | 3/2.0 | 1,732 (+13%) | 6mo | $90,000 | $52 | 65 |
| 404 N Washington St | 0.14mi | 4/2.0 (+1) | 1,600 (+4%) | 17mo | $168,000 | $105 | 63 |
| 705 N Crestview Dr | 0.38mi | 3/2.5 | 1,666 (+9%) | 4mo | $260,000 | $156 | 58 |
| 511 S Davenport St | 0.53mi | 2/2.0 (-1) | 1,560 (+2%) | 10mo | $200,500 | $129 | 56 |
| 200 W Bertram St | 0.48mi | 3/2.0 | 1,585 (+3%) | 16mo | $175,000 | $110 | 55 |
| 306 S Davenport St | 0.46mi | 3/2.0 | 1,470 (-4%) | 20mo | $169,000 | $115 | 52 |
| 306 W Bertram St | 0.46mi | 3/1.5 | 1,617 (+6%) | 21mo | $149,900 | $93 | 50 |
Match score weights: distance 35% · size 25% · config 20% · recency 20%. Top-matched comps best support the ARV.
Projected returns pro-forma
5.15% appreciation · 3.0% rent growth · sell at horizon
- IRR
- 9.6%
- Equity multiple
- 1.62×
- Total profit
- $39,768
- Equity at exit
- $131,857
- IRR
- 11.1%
- Equity multiple
- 3.07×
- Total profit
- $132,662
- Equity at exit
- $229,310
Cash invested: $64,120 (down + closing). Projections, not guarantees.
Landlord ↔ Tenant lean methodology
- Overall (STATE)
- 43 Moderately Tenant-Leaning
- State Illinois
- 43 Moderately Tenant-Leaning · D+7
- County
- — inherits STATE
- City
- — inherits STATE
ZIP-level market 61548
- Home prices YoY
- 1.5%
- Active inventory
- 99
- Price-to-rent
- 10.0×
Monthly cashflow live
- Estimated rent
- $1,907 medium interval (Pro) →
- Mortgage (P&I)
- −$1,201
- Tax from tax record
- −$448 /mo · $5,371/yr
- Insurance
- −$95
- HOA
- −$0
- Vacancy / Maint / Mgmt
- −$401
- Net cashflow
- $-237
Break-even live
Sensitivity live
| Price | -10% $-107 | -5% $-172 | +0% $-237 | +5% $-302 | +10% $-367 |
|---|---|---|---|---|---|
| Rent | -10% $-388 | -5% $-312 | +0% $-237 | +5% $-162 | +10% $-86 |
| Rate | -1.0pp $-122 | -0.5pp $-179 | base $-237 | +0.5pp $-296 | +1.0pp $-357 |
UW: 25.0% down · 7.5% · 30yr · 1.5% tax · 5.0% vac · 8.0% maint · 8.0% mgmt
Financing live
Cash to close
- Down payment
- $57,250
- Closing costs
- $6,870
- Reserves months
- —
- Total cash needed
- —
Loan-product check · same deal, 3 products live
Conventional
25% down · 7.5% · 30yr
- Down + closing
- —
- Monthly P&I
- —
- Monthly cashflow
- —
- DSCR
- —
- Eligible?
- —
Personal DTI + credit; lowest rate.
DSCR
20% down · 8.5% · 30yr
- Down + closing
- —
- Monthly P&I
- —
- Monthly cashflow
- —
- DSCR
- —
- Eligible?
- —
No personal income docs; deal must DSCR.
Hard money
10% down · 12.0% · 12mo
- Down + closing
- —
- Monthly P&I
- —
- Monthly cashflow
- —
- DSCR
- —
- Eligible?
- —
Short-term bridge; refi at stabilization.
Listing history 8 events
-
2026-06-21days on market $229,000 Active 9 DOM
-
2026-06-19days on market $229,000 Active 7 DOM
-
2026-06-18days on market $229,000 Active 6 DOM
-
2026-06-17days on market $229,000 Active 5 DOM
-
2026-06-16days on market $229,000 Active 4 DOM
-
2026-06-15days on market $229,000 Active 3 DOM
-
2026-06-13remarks 489-char remark
-
2026-06-13$229,000 Active 1 DOM
ⓘ Source: listings_history table (triggers on properties + properties_extension) + one-shot
backfill from property_details.listing_events for pre-trigger history.
Tax reassessment forecast IL · Partial reset (capped growth)
- Current annual tax
- $5,371 · $448/mo
- Projected year-2 tax
- $5,371 · $448/mo
- Expected delta
- $0/yr ($0/mo · 0.0%)
ⓘ Screening estimate from a state-policy table — verify with the county assessor before closing.
Climate risk First Street
- Flood 1/10 Low FEMA zone X (unshaded) · 0% chance over 30 yrs
- Wildfire 1/10 Low
- Heat 3/10 Moderate 7 d/yr ≥105°F today · 18 d/yr by 30 yrs out
- Wind 2/10 Low 100% chance of damaging wind over 30 yrs
- Air quality 2/10 Low 1 unhealthy d/yr today · 1 by 30 yrs out
Nearby sold comps map
Loading sold comps map…
Walkable amenities ~0.75 mi
Loading nearby amenities…
Taxation est. · year 1
- Rental income
- $22,888
- − Mortgage interest
- −$12,828
- − Property taxes
- −$5,371
- − Insurance
- −$1,145
- − Repairs & maintenance
- −$1,831
- − Management
- −$1,831
- − Depreciation
- −$6,662
- Taxable loss
- −$6,779
- Est. tax savings @ 24.0%
- +$1,627
- After-tax cash flow
- $-1,218/yr
For passive investors: Depreciation is non-cash, so a rental often shows a tax loss while cash-flowing — sheltering income. Rental losses are passive: they offset passive income freely, and up to $25,000/yr can offset ordinary (W-2) income if you actively participate and your MAGI is under $100k (phasing out to $0 by $150k); unused losses carry forward. On sale, claimed depreciation is recaptured at up to 25%, and gains may owe capital-gains tax (a 1031 exchange can defer both). Figures are a year-1 estimate at your 24.0% rate — not tax advice; consult a CPA.
Schools (NCES district)
- District
- County Of Woodford School
- NCES district ID
- 1725770
- Math proficiency
- 47% ▼ -5.00%
- Reading proficiency
- 44% ▼ -6.00%
- Median HH income
- $72,248
- Composite
- 41.2/100
- National rank
- #3540
- State rank
- #75 of 620 in IL
Livability — Metamora
- Score
- 81/100
- State rank
- #98
- US rank
- #1582
Category grades
Schools grade is shown separately in the Schools card above.
Census & demographics
- Census place
- Metamora, IL
- Population (ZIP)
- 12,165
Population outlook (Woodford County) Hauer SSP2
- Today (2025)
- 39,897 people
- By 2030
- 40,038 · +0.4%
- By 2040
- 39,745 · -0.4%
- By 2050
- 38,585 · -3.3%
- By 2075
- 34,769 · -12.9%
- By 2100
- 27,616 · -30.8%
Race, ethnicity, and origin ACS 2023
- Neighborhood character
- Predominantly White (96%)
- Race & ethnicity
- White 96% Two or more races 3% Hispanic / Latino 2%
- Common ancestry
- Romanian 4% Slovak 3% Portuguese 2%
- Foreign-born
- 2% · Canada, South Korea
- Languages at home
- 98% English-only · Spanish 1%
Political lean MEDSL · Woodford
- 2024 margin
- Solid R (+42.0) · D 28.2% · R 70.3% · Other 1.5%
- 2008→2024 swing
- -15.4pp toward R · 2008: -26.6pp · 2024: -42.0pp
- All cycles
- 2024: R+42.0 2020: R+40.2 2016: R+41.8 2012: R+39.2 2008: R+26.6
Not yet ingested
- Civics
- —
Market trends
- HPI YoY
- ▲ 5.15%
- Current HPI
- 345.14
- Rent YoY
- —
- Metro
- —
- State GDP YoY
- ▲ 1.59%
- F500 in state
- 60
Industry mix (Fortune 500 HQ in IL)
| Industry | F500 HQs | Revenue |
|---|---|---|
| Insurance | 4 | $201B |
|
||
| Consumer Goods | 4 | $87B |
|
||
| Industrial Machinery | 3 | $64B |
|
||
| Healthcare | 2 | $55B |
|
||
| Retail / Pharmacy | 1 | $148B |
|
||
| Agriculture / Food | 1 | $86B |
|
||
Price history
1 event — show timeline
- 2026-06-11 Listed $229,000 RMLSA as Distributed by MLS Grid
Property tax history
+3.0%/yrLatest (2025): $5,371 · +6.3% YoY. Source: county tax records.
Cash-flow waterfall
monthlySold comps — $/sqft
last 12 mo · ≤1 miLoading sold comps…