135 Jura Pass · Kyle, TX
Flood risk No data
- FEMA flood zone
- —
- Chance of flooding over 30 yrs
- —
- Est. flood insurance / yr
- —
Fire risk No data
- Est. fire insurance / yr
- —
Heat risk No data
- Hot days now (above threshold)
- —
- Hot days in 30 yrs
- —
Wind risk No data
- Chance of severe wind over 30 yrs
- —
Air-quality risk No data
- Unhealthy air days now
- —
- Unhealthy air days in 30 yrs
- —
Risk factors via First Street. Map © Google.
Why this score? — see what drove the D+ grade
The composite is a weighted blend of 9 inputs, each scored 0–100. Each bar is that input's sub-score; the figure is the points it added to the 100-point composite (weight × sub-score).
- Cash flow +16.9/30.0
- ARV discount +7.5/15.0
- DSCR +5.3/10.0
- 1% rule +4.1/10.0
- Condition / age +4.0/5.0
- Livability +3.8/5.0
- Schools +3.5/10.0
- Rent growth +2.4/5.0
- Appreciation +0.0/10.0
$204,999
🖨 Deal sheet (PDF) 📄 Offer letter ✓ Due diligence
Listing remarks MLS
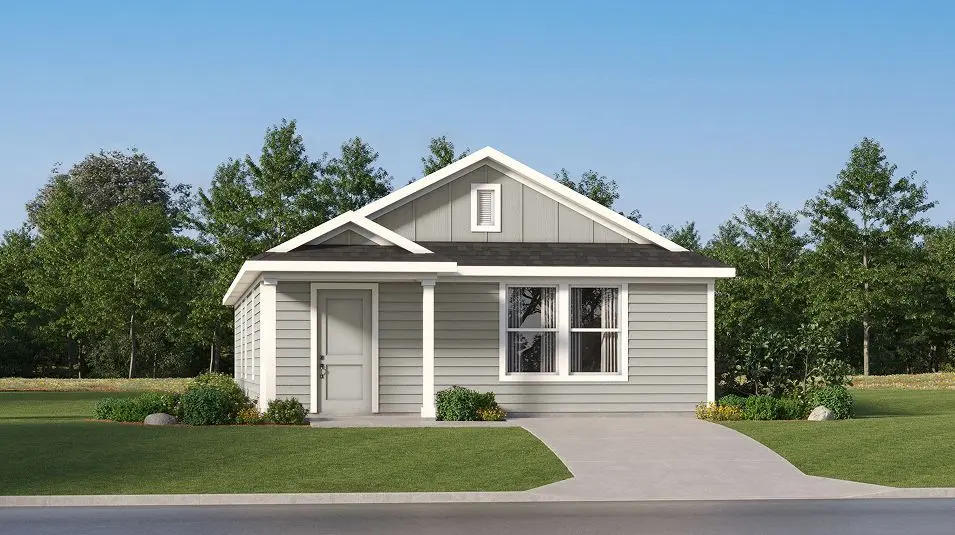
This single-level home showcases a spacious open floorplan shared between the kitchen, dining area and family room for easy entertaining. An owner's suite enjoys a private location in a rear corner of the home, complemented by an en-suite bathroom and walk-in closet. There are two secondary bedrooms at the front of the home, which are comfortable spaces for household members and overnight guests.
Key facts
- Walk-in closet
- Open floorplan
- Secondary bedrooms
Tags
Property features AI
Finance
- HOA & community: Homeowners association (Waterstone) with a $60 monthly fee covering common area and grounds maintenance; Community amenities include clubhouse, fitness center, lake, playground, park, pool, trails/paths, and community mailbox
Exterior
- Utilities: Electricity available; Public water; Public sewer (connected)
- Home design: Single-story home; Faces southwest; Currently under construction
- Construction: Built by Lennar; HardiPlank and masonry exterior; Composition roof; Slab foundation
- Exterior features: Private yard; Front and back yard; Community pool
Interior
- Kitchen: Dishwasher; Range
- Bedrooms: 3 main-level bedrooms
- Flooring: Carpet; Vinyl
- Bathrooms: 2 full bathrooms
- Heating & cooling: Central heating; Central air conditioning
- Interior features: Kitchen island; Open floorplan; Main-level primary bedroom; Walk-in closets; Blinds
- Laundry & utility: Dedicated laundry room
Neighborhood map
What this means for you Summary
Snapshot
- This is a 3-bed/2.0-bath land listed at $205k. Condition is rated good.
Deal economics
- At list price, monthly cash flow is $135 ($2k/yr) — positive.
- The deal already cash-flows at list — no discount required.
- To meet the 1% rule (rent ≥ 1% of price), the offer needs to be $186k (9.4% below list).
- Recommended offer: $186k (9.4% below list) — sets the bar for 1% rule.
- Cap rate 7.1% vs local median 3.3% in Kyle — top-decile yield for the area; either an underpriced asset or a hidden risk that comps aren't pricing in. Stress-test before assuming the spread holds.
Location & tenants
- Location reads 75/100 on livability (#138 in TX, #3,993 nationally) — a middle-class / working-renter tenant base. Strengths: housing A+, health & safety A+, employment A; Watch: amenities F, commute F.
- Hays CISD (rural): math 35% / reading 41% proficiency, ranked #390 of 826 in TX (top 47%) — families likely to look elsewhere, expect single-tenant / working-renter base with shorter leases.
- Zoned schools: Blanco Vista El (math 33% / reading 42%, grade F, #1,744 of 4,322 statewide, top 41%, 731 students, 58% FRL); Laura B Wallace Middle (math 31% / reading 34%, grade F, #947 of 1,662 statewide, top 58%, 789 students, 53% FRL); Lehman H S (math 20% / reading 32%, grade F, #1,234 of 1,632 statewide, top 76%, 2,120 students, 59% FRL).
- Market conditions: Rents soft (-0.3%/yr); 1820 active listings in the ZIP; 34 comparable units currently listed for rent nearby; rentals at typical pace (median 19d on market — plan ~3-4 weeks tenant-placement turnaround); solid renter incomes; 5,270 units permitted in Hays County in 2024 (1,464 in 5+ unit buildings).
Forward outlook
- Local home prices are declining (-3.0%/yr); year-one equity from $1k of loan paydown is wiped out by about $6k of value loss. Plan a longer hold.
- Hays County population projected at +93% by 2050 — long-run rental-demand tailwind backs the buy-and-hold thesis.
Negotiation context
- Only 10 days on market — expect competitive offers; lowballing is unlikely to land.
- 2 sale attempts with the ask held roughly flat each time — persistent listings suggest the price (not the market) is what's stuck; bring a comps-based counter.
Questions for the listing agent
- What does the HOA fee cover, when was the last increase, and are there any pending special assessments or reserve-fund shortfalls?
- Is there a deadline driving the sale (1031 exchange, divorce, estate, relocation)? That informs how much negotiation room exists.
- Schools are D-rated, which usually means shorter tenancies and higher turnover. Who's the typical renter profile here, and what's been the actual vacancy rate?
- The area grade is low — what's the realistic commute time and amenity access for the typical tenant pool here? Any planned neighborhood developments (good or bad) we should know about?
- What's the average days-on-market for RENTAL listings here right now (not sales)? A rising rental-DOM trend means longer vacancies and softer asking-rent achievability than the comps imply.
- What's the recent tenant-quality profile in this submarket — average credit score on applications, eviction rate, late-payment / NSF rate, and stable-employment percentage? A property-management company in the area should have these aggregated.
- How much new for-sale + rental construction is in the pipeline within 1–3 miles? Heavy new supply typically softens prices + rents 12–24 months out; constrained supply supports both.
Investment metrics
- 1% rule
- 0.91% ✗
- Cap rate
- 7.08%
- Cash-on-cash
- 2.82%
- DSCR
- 1.13
- GRM
- 9.2
CMA / ARV
No comps found within radius.
Projected returns pro-forma
-3.0% appreciation · 0.0% rent growth · sell at horizon
- IRR
- -15.1%
- Equity multiple
- 0.48×
- Total profit
- $-30,107
- Equity at exit
- $30,566
- IRR
- -12.3%
- Equity multiple
- 0.37×
- Total profit
- $-36,297
- Equity at exit
- $17,725
Cash invested: $57,400 (down + closing). Projections, not guarantees.
Landlord ↔ Tenant lean methodology
- Overall (STATE)
- 87 Strongly Landlord-Friendly
- State Texas
- 87 Strongly Landlord-Friendly · R+5
- County
- — inherits STATE
- City
- — inherits STATE
ZIP-level market 78640
- Home prices YoY
- -33.8%
- Rents YoY
- -0.3%
- Active inventory
- 1820
- Price-to-rent
- 9.2×
Monthly cashflow live
- Estimated rent
- $1,857 high interval (Pro) →
- Mortgage (P&I)
- −$1,075
- Tax from tax record
- −$112 /mo · $1,339/yr
- Insurance
- −$85
- HOA
- −$60
- Vacancy / Maint / Mgmt
- −$390
- Net cashflow
- $135
Break-even live
Sensitivity live
| Price | -10% $251 | -5% $193 | +0% $135 | +5% $77 | +10% $19 |
|---|---|---|---|---|---|
| Rent | -10% $-12 | -5% $61 | +0% $135 | +5% $208 | +10% $281 |
| Rate | -1.0pp $238 | -0.5pp $187 | base $135 | +0.5pp $82 | +1.0pp $27 |
UW: 25.0% down · 7.5% · 30yr · 1.5% tax · 5.0% vac · 8.0% maint · 8.0% mgmt
Financing live
Cash to close
- Down payment
- $51,250
- Closing costs
- $6,150
- Reserves months
- —
- Total cash needed
- —
Loan-product check · same deal, 3 products live
Conventional
25% down · 7.5% · 30yr
- Down + closing
- —
- Monthly P&I
- —
- Monthly cashflow
- —
- DSCR
- —
- Eligible?
- —
Personal DTI + credit; lowest rate.
DSCR
20% down · 8.5% · 30yr
- Down + closing
- —
- Monthly P&I
- —
- Monthly cashflow
- —
- DSCR
- —
- Eligible?
- —
No personal income docs; deal must DSCR.
Hard money
10% down · 12.0% · 12mo
- Down + closing
- —
- Monthly P&I
- —
- Monthly cashflow
- —
- DSCR
- —
- Eligible?
- —
Short-term bridge; refi at stabilization.
Rent comps 34 comps
| Address | Beds | Baths | Sqft | Rent | $/sqft | DOM | Units | Dist |
|---|---|---|---|---|---|---|---|---|
| 190 Sormonne Loop Kyle, TX | 3.0 | 2.0 | 1450 | $1,650 | $1.14 | 26d | 1 | 0.08mi |
| 147 Otter Rd Kyle, TX | 3.0 | 2.0 | 1622 | $1,850 | $1.14 | 14d | 1 | 0.22mi |
| 148 River Rise Rd Kyle, TX | 4.0 | 2.0 | 1622 | $1,800 | $1.11 | 45d | 1 | 0.31mi |
| 149 Red Sun Dr Kyle, TX | 3.0 | 2.0 | 1421 | $1,850 | $1.30 | 13d | 1 | 0.39mi |
| 126 Avre Loop Kyle, TX | 3.0 | 2.0 | 1230 | $1,700 | $1.38 | 45d | 1 | 0.40mi |
| 195 Salt Springs Rd Kyle, TX | 4.0 | 2.0 | 1818 | $2,100 | $1.16 | 19d | 1 | 0.44mi |
| 1689 Woodlands Dr Kyle, TX | 4.0 | 2.0 | 1515 | $1,850 | $1.22 | 45d | 1 | 0.46mi |
| 310 Fossil Dr Kyle, TX | 3.0 | 2.0 | 1602 | $2,000 | $1.25 | 6d | 1 | 0.53mi |
| 224 Blooming Trl Kyle, TX | 4.0 | 2.0 | 1515 | $2,200 | $1.45 | 19d | 1 | 0.53mi |
| 1441 Star Mdw Kyle, TX | 3.0 | 2.0 | 1607 | $1,900 | $1.18 | 0d | 1 | 0.56mi |
| 160 Night Sky Dr Kyle, TX | 3.0 | 2.0 | 1410 | $1,800 | $1.28 | 6d | 1 | 0.69mi |
| 185 Voss Kyle, TX | 3.0 | 2.0 | 1371 | $1,800 | $1.31 | 13d | 1 | 0.95mi |
| 232 Voss Kyle, TX | 3.0 | 2.0 | 1467 | $1,895 | $1.29 | 6d | 1 | 1.00mi |
| 261 New Bridge Dr Kyle, TX | 4.0 | 2.0 | 1368 | $1,849 | $1.35 | 45d | 1 | 1.02mi |
| 240 New Country Rd Kyle, TX | 3.0 | 2.0 | 1106 | $1,650 | $1.49 | 4d | 1 | 1.02mi |
| 240 New Country Rd Kyle, TX | 3.0 | 2.0 | 1106 | $1,650 | $1.49 | 13d | 1 | 1.02mi |
| 125 Voyager Cv Kyle, TX | 3.0 | 2.0 | 1476 | $1,800 | $1.22 | 45d | 1 | 1.06mi |
| 187 Rummel Dr Kyle, TX | 3.0 | 2.0 | 1240 | $1,795 | $1.45 | 45d | 1 | 1.08mi |
| 376 Musgrav Kyle, TX | 3.0 | 2.0 | 1476 | $1,890 | $1.28 | 0d | 1 | 1.12mi |
| 376 Musgrav Kyle, TX | 3.0 | 2.0 | 1476 | $1,988 | $1.35 | 18d | 1 | 1.12mi |
| 510 New Bridge Dr Kyle, TX | 4.0 | 2.0 | 1359 | $1,695 | $1.25 | 45d | 1 | 1.23mi |
| 185 Creekside Villa Dr Kyle, TX | 3.0 | 2.5 | 1463 | $1,700 | $1.16 | 17d | 1 | 1.25mi |
| 273 Tower Dr Kyle, TX | 3.0 | 2.0 | 1252 | $1,795 | $1.43 | 19d | 1 | 1.27mi |
| 155 Creekside Villa Dr Kyle, TX | 3.0 | 2.0 | 1266 | $1,695 | $1.34 | 6d | 1 | 1.27mi |
| 155 Creekside Villa Dr Kyle, TX | 3.0 | 2.0 | 1266 | $1,495 | $1.18 | 17d | 1 | 1.27mi |
| 155 Creekside Villa Dr Kyle, TX | 3.0 | 2.0 | 1266 | $1,695 | $1.34 | 26d | 1 | 1.27mi |
| 149 Creekside Villa Dr Kyle, TX | 3.0 | 2.0 | 1266 | $1,495 | $1.18 | 17d | 1 | 1.28mi |
| 106 Lakeview Ct Kyle, TX | 3.0 | 2.5 | 1765 | $1,795 | $1.02 | 19d | 1 | 1.29mi |
| 112 Lakeview Ct Kyle, TX | 3.0 | 2.5 | 1765 | $1,795 | $1.02 | 6d | 1 | 1.30mi |
| 270 Sheep Trail Dr Kyle, TX | 3.0 | 2.0 | 1584 | $1,785 | $1.13 | 45d | 1 | 1.30mi |
| 526 Harvest Moon Pkwy Kyle, TX | 3.0–4.0 | 2.0–3.0 | 1624 | $1,399 | $0.86 | 4d | 1 | 1.35mi |
| 410 Tower Dr Kyle, TX | 3.0 | 2.5 | 1665 | $1,795 | $1.08 | 45d | 1 | 1.37mi |
| 184 Unity Kyle, TX | 4.0 | 2.5 | 1704 | $2,000 | $1.17 | 45d | 1 | 1.37mi |
| 141 Opal Ln Kyle, TX | 3.0 | 1.0–2.0 | 886 | $2,000 | $2.26 | 0d | 92 | 1.44mi |
HOA detail
- Monthly dues
- $60 · $720/yr
Listing history 15 events
-
2026-06-21days on market $204,999 Active 10 DOM
-
2026-06-18days on market $204,999 Active 7 DOM
Show marketing remark (399 chars)
This single-level home showcases a spacious open floorplan shared between the kitchen, dining area and family room for easy entertaining. An owner's suite enjoys a private location in a rear corner of the home, complemented by an en-suite bathroom and walk-in closet. There are two secondary bedrooms at the front of the home, which are comfortable spaces for household members and overnight guests.
-
2026-06-17pricedays on market $204,999 Active 6 DOM
-
2026-06-16days on market $214,999 Active 5 DOM
-
2026-06-15days on market $214,999 Active 4 DOM
-
2026-06-13remarks 603-char remark
-
2026-06-13days on market $214,999 Active 2 DOM
-
2026-06-09days on market $214,999 Active 19 DOM
-
2026-06-08days on market $214,999 Active 18 DOM
-
2026-06-07days on market $214,999 Active 17 DOM
-
2026-06-05days on market $214,999 Active 14 DOM
-
2026-06-03days on market $214,999 Active 13 DOM
-
2026-06-02days on market $214,999 Active 12 DOM
-
2026-06-01days on market $214,999 Active 11 DOM
-
2026-05-31days on market $214,999 Active 10 DOM
ⓘ Source: listings_history table (triggers on properties + properties_extension) + one-shot
backfill from property_details.listing_events for pre-trigger history.
Tax reassessment forecast TX · Resets to sale price
- Current annual tax
- $1,339 · $112/mo
- Projected year-2 tax
- $3,751 · $313/mo
- Expected delta
- +$2,413/yr (+$201/mo · 180.3%)
ⓘ Screening estimate from a state-policy table — verify with the county assessor before closing.
Nearby sold comps map
Loading sold comps map…
Walkable amenities ~0.75 mi
Loading nearby amenities…
Taxation est. · year 1
- Rental income
- $22,278
- − Mortgage interest
- −$11,483
- − Property taxes
- −$1,339
- − Insurance
- −$1,025
- − Repairs & maintenance
- −$1,782
- − Management
- −$1,782
- − HOA
- −$720
- − Depreciation
- −$5,964
- Taxable loss
- −$1,816
- Est. tax savings @ 24.0%
- +$436
- After-tax cash flow
- $2,052/yr
For passive investors: Depreciation is non-cash, so a rental often shows a tax loss while cash-flowing — sheltering income. Rental losses are passive: they offset passive income freely, and up to $25,000/yr can offset ordinary (W-2) income if you actively participate and your MAGI is under $100k (phasing out to $0 by $150k); unused losses carry forward. On sale, claimed depreciation is recaptured at up to 25%, and gains may owe capital-gains tax (a 1031 exchange can defer both). Figures are a year-1 estimate at your 24.0% rate — not tax advice; consult a CPA.
Condition & rehab AI · 1 photo
This single-level home is in excellent condition with a spacious floorplan and well-maintained exterior. Minor updates to paint, landscaping, and flooring would significantly enhance its resale and rental value.
Value-add opportunities
- Both Painting exterior and interior — Fresh paint enhances curb appeal and interior aesthetics
- Both Landscaping improvements — Enhances curb appeal and adds value
- Both New flooring in bathrooms and kitchen — Modern flooring improves aesthetics and functionality
- Both New window treatments — Enhances curb appeal and interior aesthetics
- Rental HVAC system maintenance — Ensures comfort and energy efficiency
Renovation cost estimate screening
Value-add ROI direction
- Both Painting exterior and interior — Fresh paint enhances curb appeal and interior aesthetics ↑
- Both Landscaping improvements — Enhances curb appeal and adds value ↑
- Both New flooring in bathrooms and kitchen — Modern flooring improves aesthetics and functionality ↑
- Both New window treatments — Enhances curb appeal and interior aesthetics ↑
- Rental HVAC system maintenance — Ensures comfort and energy efficiency ↑
ⓘ Cost ranges are severity-bucket heuristics (US national rule-of-thumb). Get contractor quotes + a written scope before underwriting a rehab budget.
Schools (NCES district)
- District
- Hays CISD
- NCES district ID
- 4800010
- Math proficiency
- 35% ▼ -15.00%
- Reading proficiency
- 41% ▼ -5.00%
- Median HH income
- $70,570
- Composite
- 34.78/100
- National rank
- #5118
- State rank
- #390 of 826 in TX
Livability — Kyle
- Score
- 75/100
- State rank
- #138
- US rank
- #3993
Category grades
Schools grade is shown separately in the Schools card above.
Census & demographics
- County
- Hays County · 280,138 people
- City population
- 77,531
- Metro
- Austin-Round Rock-Georgetown, TX
- Population (ZIP)
- 77,531
- Household income
- $90,075
- Rent vs Own
- Severe rent burden
- 2552.0
Population outlook (Hays County) Hauer SSP2
- Today (2025)
- 286,948 people
- By 2030
- 336,923 · +17.4%
- By 2040
- 441,894 · +54.0%
- By 2050
- 553,462 · +92.9%
- By 2075
- 838,261 · +192.1%
- By 2100
- 1,063,658 · +270.7%
Race, ethnicity, and origin ACS 2023
- Neighborhood character
- Diverse neighborhood (Simpson 0.56)
- Race & ethnicity
- Hispanic / Latino 55% White 36% Two or more races 29% Black 5% Native American 1%
- Hispanic origin (detail)
- Mexican 47% Puerto Rican 1%
- Common ancestry
- Italian 2% Slovak 2% Lithuanian 1%
- Foreign-born
- 13% · Canada
- Languages at home
- 63% English-only · Spanish 35%
Political lean MEDSL · Hays
- 2024 margin
- Lean D (+5.7) · D 52.1% · R 46.5% · Other 1.4%
- 2008→2024 swing
- +7.7pp toward D · 2008: -2.0pp · 2024: 5.7pp
- All cycles
- 2024: D+5.7 2020: D+10.8 2016: R+0.9 2012: R+10.4 2008: R+2.0
Not yet ingested
- Civics
- —
Market trends
- HPI YoY
- ▼ -92.64%
- Current HPI
- 181.7969
- Rent YoY
- ▼ -0.34%
- Metro
- Austin-Round Rock-Georgetown, TX
- State GDP YoY
- ▲ 3.95%
- F500 in state
- 110
Industry mix (Fortune 500 HQ in TX)
| Industry | F500 HQs | Revenue |
|---|---|---|
| Energy | 16 | $1,198B |
|
||
| Technology | 5 | $198B |
|
||
| Engineering / Construction | 4 | $72B |
|
||
| Energy Services | 3 | $60B |
|
||
| Utilities | 3 | $41B |
|
||
| Healthcare | 2 | $330B |
|
||
Price history
-1.4% since first listed5 events — show timeline
- 2026-06-18 Price Changed $204,999 Zillow
- 2026-06-16 Price Changed $204,999 Unlock MLS
- 2026-06-11 Listed $214,999 Unlock MLS
- 2026-05-24 Price Changed $214,999 Zillow
- 2026-05-21 Listed $207,999 Zillow
Property tax history
+41.1%/yrLatest (2025): $1,339 · +41.1% YoY. Source: county tax records.
Cash-flow waterfall
monthlySold comps — $/sqft
last 12 mo · ≤1 miLoading sold comps…