514 Hemingway Ter · Indian River Estates, FL
Flood risk 1/10 · Minimal
- FEMA flood zone
- X (unshaded)
- Chance of flooding over 30 yrs
- 0.0%
- Est. flood insurance / yr
- $507 – $1,088
Fire risk 3/10 · Minor
- Est. fire insurance / yr
- $947 – $1,759
Heat risk 10/10 · Severe
- Hot days now (above 106°F)
- 7 days/yr
- Hot days in 30 yrs
- 24 days/yr
Wind risk 10/10 · Severe
- Chance of severe wind over 30 yrs
- 99.0%
Air-quality risk 2/10 · Minimal
- Unhealthy air days now
- 1 days/yr
- Unhealthy air days in 30 yrs
- 1 days/yr
Risk factors via First Street. Map © Google.
Why this score? — see what drove the B+ grade
The composite is a weighted blend of 9 inputs, each scored 0–100. Each bar is that input's sub-score; the figure is the points it added to the 100-point composite (weight × sub-score).
- Cash flow +30.0/30.0
- ARV discount +15.0/15.0
- 1% rule +10.0/10.0
- DSCR +10.0/10.0
- Rent growth +4.4/5.0
- Schools +3.7/10.0
- Livability +3.2/5.0
- Condition / age +2.5/5.0
- Appreciation +0.0/10.0
$120,900
🖨 Deal sheet (PDF) 📄 Offer letter ✓ Due diligence
Listing remarks
This is a must see! Recently installed luxury vinyl plank flooring throughout the home. High end upgrades in master bath and kitchen. Roomy island kitchen with seating boasts granite counters and stainless appliances. Recently remodeled master bath with high end features including Cambria quartz counters, comfort high rise toilet, tiled shower with marble bench seating. Added bathroom cabinets for linens, Handicap accessible in shower and bathroom. Large screened-in porch perfect for entertaining or to catch the breezes off the pond across the street. Dining room and Living room and large family room off kitchen. Inside Laundry area, Jack and Jill bathroom attached to second bedroom/craft r
Key facts
- Laminate flooring
- Updated bath
- Inside laundry area
Tags
Property features AI
Finance
- Financial info: Monthly land lease of $594
- HOA & community: Senior community; Pets allowed with restrictions (breed, number, size)
Exterior
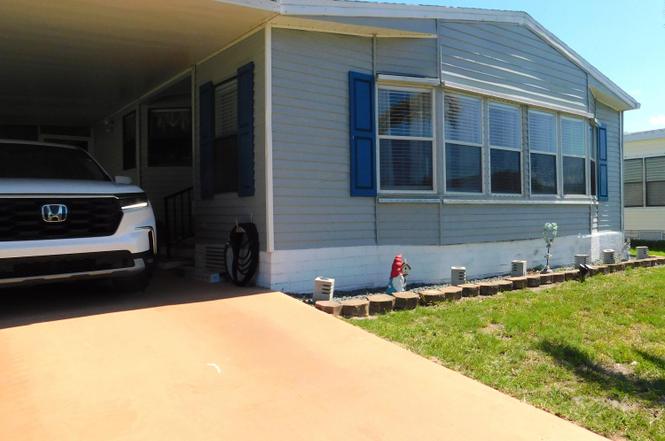
- Parking: Carport (1 covered space)
- Utilities: Public water; Public sewer; Water and sewer available
- Home design: Manufactured home (Skyline model); Single-story; Faces north; Resale condition
- Construction: Modular construction; Composition/shingle roof; Living area approximately 1,582
- Exterior features: Screened patio; Patio; Not waterfront
Interior
- Kitchen: Dishwasher; Electric range; Refrigerator
- Bedrooms: 2 bedrooms on the main level
- Flooring: Laminate flooring; Vinyl flooring
- Bathrooms: 2 full bathrooms (main level)
- Heating & cooling: Central electric heating; Central air conditioning; Ceiling fans
- Interior features: Kitchen island; Stacked bedroom layout; Partially furnished
- Laundry & utility: Laundry inside
Neighborhood map
What this means for you Summary
Snapshot
- This is a 2-bed/2.0-bath manufactured listed at $121k.
Deal economics
- At list price, monthly cash flow is $951 ($11k/yr) — positive.
- The deal already cash-flows at list — no discount required.
- Meets the 1% rule at list price ($2k rent vs $121k).
- Recommended offer: $106k (12.0% below list) — sets the bar for market timing.
- Cap rate 15.7% vs local median 5.3% in Indian River Estates — top-decile yield for the area; either an underpriced asset or a hidden risk that comps aren't pricing in. Stress-test before assuming the spread holds.
Location & tenants
- Location reads 65/100 on livability (#653 in FL) — a middle-class / working-renter tenant base. Strengths: cost of living A+, housing A+, crime B+; Watch: employment D+, amenities F, commute F.
- St. Lucie (urban): math 40% / reading 48% proficiency, ranked #51 of 73 in FL (top 70%) — families likely to look elsewhere, expect single-tenant / working-renter base with shorter leases.
- Zoned schools: Manatee Academy K-8 (math 53% / reading 51%, grade C-, #990 of 2,144 statewide, top 48%, 1,664 students, 65% FRL); Southern Oaks Middle School (math 39% / reading 43%, grade F, #353 of 571 statewide, top 63%, 894 students, 76% FRL); Fort Pierce Central High School (math 15% / reading 45%, grade F, #441 of 667 statewide, top 67%, 3,091 students, 62% FRL).
- Market conditions: Rents rising fast (+7.4%/yr); 336 active listings in the ZIP; 14 comparable units currently listed for rent nearby; rentals at typical pace (median 25d on market — plan ~3-4 weeks tenant-placement turnaround); 4,868 units permitted in St. Lucie County in 2024 (268 in 5+ unit buildings).
- At $2,261/mo this rent would consume 50% of the median local household income ($54k/yr) (locally 1086% of renters already pay >50% of income on rent) — very limited rent-growth headroom before tenants either downsize or default.
Forward outlook
- Local home prices are declining (-3.0%/yr); year-one equity from $836 of loan paydown is wiped out by about $4k of value loss. Plan a longer hold.
- St. Lucie County population projected at +20% by 2050 — long-run rental-demand tailwind backs the buy-and-hold thesis.
- At projected returns (-3.0% appreciation + 7.4% rent growth), your $34k cash investment doubles in ~4 years — after that, you're playing with house money.
Negotiation context
- It's been on market 368 days — a 12% lower offer ($106k) is reasonable based on typical stale-listing flexibility.
Risks & watch-outs
- Climate carrying-cost: severe wind risk, 99% chance of damaging wind over 30y; extreme-heat days projected 7→24/yr by 2055 (HVAC capex compounding) — expect insurance premiums to compound above CPI over the hold.
Questions for the listing agent
- It's been on market 368 days. Have you received any prior offers? Is the seller open to a 12% concession, seller financing, or rate buy-down credit?
- Why hasn't it sold? Are there any deal-killer items the seller is aware of (foundation, flood, title, zoning, code violations)?
- Is there a deadline driving the sale (1031 exchange, divorce, estate, relocation)? That informs how much negotiation room exists.
- Schools are F-rated, which usually means shorter tenancies and higher turnover. Who's the typical renter profile here, and what's been the actual vacancy rate?
- What's the average days-on-market for RENTAL listings here right now (not sales)? A rising rental-DOM trend means longer vacancies and softer asking-rent achievability than the comps imply.
- What's the recent tenant-quality profile in this submarket — average credit score on applications, eviction rate, late-payment / NSF rate, and stable-employment percentage? A property-management company in the area should have these aggregated.
- How much new for-sale + rental construction is in the pipeline within 1–3 miles? Heavy new supply typically softens prices + rents 12–24 months out; constrained supply supports both.
Investment metrics
- 1% rule
- 1.87% ✓
- Cap rate
- 15.73%
- Cash-on-cash
- 33.71%
- DSCR
- 2.50
- GRM
- 4.5
CMA / ARV
- ARV (on-the-fly)
- $235,718
- Comps found
- 2
Show comp detail 2 sales within ~0.75 mi
| Address | Dist | Beds/Ba | Sqft | Sold | Price | $/sf | Match |
|---|---|---|---|---|---|---|---|
| 243 Sea Conch | 0.13mi | 2/2.0 | 1,411 (-11%) | 6mo | $150,000 | $106 | 70 |
| 331 Seahorse Ter | 0.14mi | 2/2.0 | 1,484 (-6%) | 24mo | $220,900 | $149 | 63 |
Match score weights: distance 35% · size 25% · config 20% · recency 20%. Top-matched comps best support the ARV.
Projected returns pro-forma
-3.0% appreciation · 7.42% rent growth · sell at horizon
- IRR
- 34.0%
- Equity multiple
- 2.52×
- Total profit
- $51,520
- Equity at exit
- $18,027
- IRR
- 43.2%
- Equity multiple
- 6.03×
- Total profit
- $170,228
- Equity at exit
- $10,453
Cash invested: $33,852 (down + closing). Projections, not guarantees.
Landlord ↔ Tenant lean methodology
- Overall (STATE)
- 87 Strongly Landlord-Friendly
- State Florida
- 87 Strongly Landlord-Friendly · R+3
- County
- — inherits STATE
- City
- — inherits STATE
ZIP-level market 34982
- Home prices YoY
- -33.4%
- Rents YoY
- 7.4%
- Active inventory
- 336
- Price-to-rent
- 4.5×
Monthly cashflow live
- Estimated rent
- $2,261 high interval (Pro) →
- Mortgage (P&I)
- −$634
- Tax est. 1.5%
- −$151 /mo · $1,814/yr
- Insurance
- −$50
- HOA
- −$0
- Vacancy / Maint / Mgmt
- −$475
- Net cashflow
- $951
Break-even live
Sensitivity live
| Price | -10% $1,035 | -5% $993 | +0% $951 | +5% $909 | +10% $867 |
|---|---|---|---|---|---|
| Rent | -10% $772 | -5% $862 | +0% $951 | +5% $1,040 | +10% $1,130 |
| Rate | -1.0pp $1,012 | -0.5pp $982 | base $951 | +0.5pp $920 | +1.0pp $888 |
UW: 25.0% down · 7.5% · 30yr · 1.5% tax · 5.0% vac · 8.0% maint · 8.0% mgmt
Financing live
Cash to close
- Down payment
- $30,225
- Closing costs
- $3,627
- Reserves months
- —
- Total cash needed
- —
Loan-product check · same deal, 3 products live
Conventional
25% down · 7.5% · 30yr
- Down + closing
- —
- Monthly P&I
- —
- Monthly cashflow
- —
- DSCR
- —
- Eligible?
- —
Personal DTI + credit; lowest rate.
DSCR
20% down · 8.5% · 30yr
- Down + closing
- —
- Monthly P&I
- —
- Monthly cashflow
- —
- DSCR
- —
- Eligible?
- —
No personal income docs; deal must DSCR.
Hard money
10% down · 12.0% · 12mo
- Down + closing
- —
- Monthly P&I
- —
- Monthly cashflow
- —
- DSCR
- —
- Eligible?
- —
Short-term bridge; refi at stabilization.
Rent comps 14 comps
| Address | Beds | Baths | Sqft | Rent | $/sqft | DOM | Units | Dist |
|---|---|---|---|---|---|---|---|---|
| 203 Melton Dr Unit B Fort Pierce, FL | 2.0 | 1.0 | 1200 | $1,800 | $1.50 | 25d | 1 | 0.37mi |
| 341 Ashley St Fort Pierce, FL | 3.0 | 2.0 | 1128 | $2,460 | $2.18 | 25d | 1 | 0.55mi |
| 355 Johnston St Fort Pierce, FL | 3.0 | 1.5 | 1118 | $2,500 | $2.24 | 25d | 1 | 0.59mi |
| 394 Salisbury Cir Fort Pierce, FL | 3.0 | 2.5 | 1808 | $2,500 | $1.38 | 15d | 1 | 0.66mi |
| 389 Salisbury Cir Fort Pierce, FL | 3.0 | 2.5 | 1808 | $3,200 | $1.77 | 25d | 1 | 0.67mi |
| 330 Borraclough St Fort Pierce, FL | 3.0 | 2.0 | 1404 | $2,175 | $1.55 | 15d | 1 | 0.68mi |
| 423 Salisbury Cir Fort Pierce, FL | 3.0 | 2.5 | 1808 | $2,500 | $1.38 | 25d | 1 | 0.70mi |
| 587 Salisbury Cir Fort Pierce, FL | 3.0 | 2.5 | 1808 | $2,350 | $1.30 | 15d | 1 | 0.70mi |
| 492 Salisbury Cir Fort Pierce, FL | 3.0 | 2.5 | 1486 | $2,395 | $1.61 | 25d | 1 | 0.74mi |
| 526 Salisbury Cir Fort Pierce, FL | 3.0 | 2.5 | 1486 | $2,399 | $1.61 | 15d | 1 | 0.77mi |
| 5300 Seagrape Dr Fort Pierce, FL | 3.0 | 2.0 | 1300 | $2,450 | $1.88 | 25d | 1 | 0.81mi |
| 5315 Hickory Dr Fort Pierce, FL | 3.0 | 2.0 | 1400 | $2,045 | $1.46 | 25d | 1 | 0.98mi |
| 4916 Silver Oak Dr Fort Pierce, FL | 3.0 | 2.5 | 2016 | $2,600 | $1.29 | 25d | 1 | 0.99mi |
| 699 W Weatherbee Rd Fort Pierce, FL | 2.0 | 1.5 | 1100 | $1,875 | $1.70 | 25d | 1 | 1.29mi |
Listing history 22 events
-
2026-06-21days on market $120,900 Active 368 DOM
-
2026-06-18days on market $120,900 Active 365 DOM
-
2026-06-17days on market $120,900 Active 364 DOM
-
2026-06-16days on market $120,900 Active 363 DOM
-
2026-06-15days on market $120,900 Active 362 DOM
-
2026-06-14days on market $120,900 Active 360 DOM
-
2026-06-13days on market $120,900 Active 359 DOM
-
2026-06-10days on market $120,900 Active 357 DOM
-
2026-06-09days on market $120,900 Active 356 DOM
-
2026-06-08days on market $120,900 Active 355 DOM
-
2026-06-07days on market $120,900 Active 354 DOM
-
2026-06-05days on market $120,900 Active 351 DOM
-
2026-06-03days on market $120,900 Active 350 DOM
-
2026-06-02days on market $120,900 Active 349 DOM
-
2026-06-01days on market $120,900 Active 348 DOM
-
2026-05-31days on market $120,900 Active 347 DOM
-
2026-05-30days on market $120,900 Active 346 DOM
-
2026-05-06price $120,900
-
2025-10-27price $125,900
-
2025-09-12price $119,900
-
2025-08-14price $134,900
-
2025-06-17$145,900 Active
ⓘ Source: listings_history table (triggers on properties + properties_extension) + one-shot
backfill from property_details.listing_events for pre-trigger history.
Climate risk First Street
- Flood 1/10 Low FEMA zone X (unshaded) · 0% chance over 30 yrs
- Wildfire 3/10 Moderate
- Heat 10/10 Extreme 7 d/yr ≥106°F today · 24 d/yr by 30 yrs out
- Wind 10/10 Extreme 99% chance of damaging wind over 30 yrs
- Air quality 2/10 Low 1 unhealthy d/yr today · 1 by 30 yrs out
Nearby sold comps map
Loading sold comps map…
Walkable amenities ~0.75 mi
Loading nearby amenities…
Taxation est. · year 1
- Rental income
- $27,138
- − Mortgage interest
- −$6,772
- − Property taxes
- −$1,814
- − Insurance
- −$604
- − Repairs & maintenance
- −$2,171
- − Management
- −$2,171
- − Depreciation
- −$3,517
- Taxable income
- $10,088
- Est. tax owed @ 24.0%
- −$2,421
- After-tax cash flow
- $8,991/yr
For passive investors: Depreciation is non-cash, so a rental often shows a tax loss while cash-flowing — sheltering income. Rental losses are passive: they offset passive income freely, and up to $25,000/yr can offset ordinary (W-2) income if you actively participate and your MAGI is under $100k (phasing out to $0 by $150k); unused losses carry forward. On sale, claimed depreciation is recaptured at up to 25%, and gains may owe capital-gains tax (a 1031 exchange can defer both). Figures are a year-1 estimate at your 24.0% rate — not tax advice; consult a CPA.
Schools (NCES district)
- District
- St. Lucie
- NCES district ID
- 1201770
- Math proficiency
- 40% ▼ -11.00%
- Reading proficiency
- 48% ▼ -4.00%
- Median HH income
- $44,737
- Composite
- 37.28/100
- National rank
- #4449
- State rank
- #51 of 73 in FL
Livability — Indian River Estates
- Score
- 65/100
- State rank
- #653
- US rank
- #12946
Category grades
Schools grade is shown separately in the Schools card above.
Census & demographics
- Census place
- Indian River Estates, FL
- County
- Saint Lucie County · 337,150 people
- City population
- 27,447
- Metro
- Port St. Lucie, FL
- Population (ZIP)
- 31,143
- Household income
- $54,082
- Rent vs Own
- Severe rent burden
- 1086.0
Population outlook (St. Lucie County) Hauer SSP2
- Today (2025)
- 338,016 people
- By 2030
- 355,687 · +5.2%
- By 2040
- 385,521 · +14.1%
- By 2050
- 406,106 · +20.1%
- By 2075
- 441,054 · +30.5%
- By 2100
- 436,885 · +29.2%
Race, ethnicity, and origin ACS 2023
- Neighborhood character
- Majority White (62%)
- Race & ethnicity
- White 62% Hispanic / Latino 22% Two or more races 12% Black 12%
- Hispanic origin (detail)
- Mexican 10% Puerto Rican 3% Cuban 3%
- Common ancestry
- Italian 7% Hispanic 2% Lithuanian 1%
- Foreign-born
- 12% · Canada
- Languages at home
- 80% English-only · Spanish 16% French/Haitian/Cajun 3%
Political lean MEDSL · St. Lucie
- 2024 margin
- Lean R (+9.1) · D 45.1% · R 54.2%
- 2008→2024 swing
- -21.2pp toward R · 2008: 12.1pp · 2024: -9.1pp
- All cycles
- 2024: R+9.1 2020: R+1.6 2016: R+2.5 2012: D+7.9 2008: D+12.1
Not yet ingested
- Civics
- —
Market trends
- HPI YoY
- ▼ -199.47%
- Current HPI
- 397.2649
- Rent YoY
- ▲ 7.42%
- Metro
- Port St. Lucie, FL
- State GDP YoY
- ▲ 3.28%
- F500 in state
- 36
Industry mix (Fortune 500 HQ in FL)
| Industry | F500 HQs | Revenue |
|---|---|---|
| Industrial Technology | 2 | $29B |
|
||
| Insurance | 2 | $17B |
|
||
| Retail | 1 | $60B |
|
||
| Technology Distribution | 1 | $58B |
|
||
| Homebuilding | 1 | $35B |
|
||
| Technology Manufacturing | 1 | $35B |
|
||
Price history
-17.1% since first listed5 events — show timeline
- 2026-05-06 Price Changed $120,900 Beaches MLS
- 2025-10-27 Price Changed $125,900 Beaches MLS
- 2025-09-12 Price Changed $119,900 Beaches MLS
- 2025-08-14 Price Changed $134,900 Beaches MLS
- 2025-06-17 Listed $145,900 Beaches MLS
Cash-flow waterfall
monthlySold comps — $/sqft
last 12 mo · ≤1 miLoading sold comps…