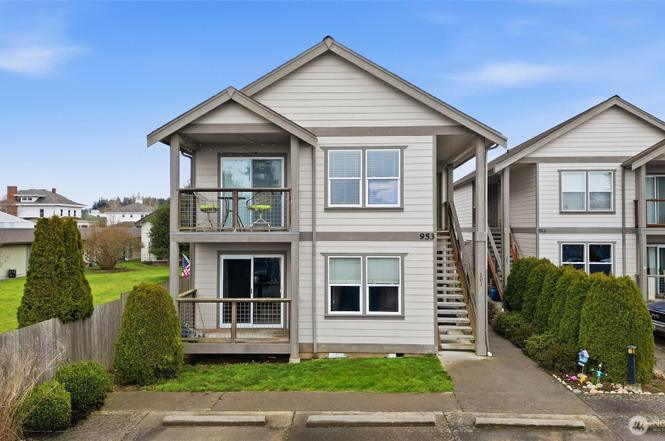
953 Third St #101 · Blaine, WA
Flood risk 1/10 · Minimal
- FEMA flood zone
- X (unshaded)
- Chance of flooding over 30 yrs
- 0.0%
- Est. flood insurance / yr
- $507 – $1,088
Fire risk 1/10 · Minimal
- Est. fire insurance / yr
- $604 – $1,122
Heat risk 3/10 · Minor
- Hot days now (above 81°F)
- 7 days/yr
- Hot days in 30 yrs
- 18 days/yr
Wind risk 1/10 · Minimal
- Chance of severe wind over 30 yrs
- —
Air-quality risk 7/10 · Major
- Unhealthy air days now
- 11 days/yr
- Unhealthy air days in 30 yrs
- 11 days/yr
Risk factors via First Street. Map © Google.
Why this score? — see what drove the D- grade
The composite is a weighted blend of 9 inputs, each scored 0–100. Each bar is that input's sub-score; the figure is the points it added to the 100-point composite (weight × sub-score).
- Appreciation +10.0/10.0
- ARV discount +7.5/15.0
- Cash flow +5.9/30.0
- Schools +4.7/10.0
- Livability +3.9/5.0
- Rent growth +3.3/5.0
- Condition / age +2.5/5.0
- 1% rule +1.2/10.0
- DSCR +0.3/10.0
$315,000
🖨 Deal sheet (PDF) 📄 Offer letter ✓ Due diligence
Listing remarks
One block from the Blaine waterfront, this ground-floor end unit is downtown living at its finest. Wake up to a peekaboo harbor views from your granite kitchen, complete with stainless appliances and filtered water. The open-concept layout flows beautifully — bright, airy, and designed to feel bigger than you'd expect. Primary suite with walk-in closet and private en-suite bathroom. Second bedroom, second bath, private patio, in-unit washer/dryer, and two dedicated parking spots. Low HOA dues ($200) and no rental restrictions. Walk to Starbucks, the waterfront, local dining, boutique shops, and Blaine's marina. Come tour your your new home today!
Key facts
- Stainless appliances
- Private patio
- In-unit washer dryer
Tags
Neighborhood map
What this means for you Summary
Snapshot
- This is a 2-bed/2.0-bath condo listed at $315k.
Deal economics
- At list price, monthly cash flow is $-616 ($-7k/yr) — negative.
- To cash-flow at today's rent, offer at most $206k (34.6% below list).
- To meet the 1% rule (rent ≥ 1% of price), the offer needs to be $195k (38.2% below list).
- Recommended offer: $195k (38.2% below list) — sets the bar for 1% rule.
- Cap rate 3.9% vs local median 2.2% in Blaine — top-decile yield for the area; either an underpriced asset or a hidden risk that comps aren't pricing in. Stress-test before assuming the spread holds.
Location & tenants
- Location reads 78/100 on livability (#125 in WA, #2,491 nationally) — a middle-class / working-renter tenant base. Strengths: commute A+, health & safety A+, housing A; Watch: amenities F, cost of living F.
- Blaine School District (town): math 49% / reading 55% proficiency, ranked #120 of 291 in WA (top 41%) — acceptable for families but not a draw, mixed tenant base, ~2y average lease.
- Zoned schools: Blaine Elementary School (463 students, 54% FRL); Blaine Middle School (459 students, 54% FRL); Blaine High School (609 students, 46% FRL) — zoned schools average 51% FRL vs 33% district-wide (18 pts higher); higher-poverty schools than district average — tighter screening recommended.
- Market conditions: Rents rising (+3.1%/yr); 461 active listings in the ZIP; 3 comparable units currently listed for rent nearby; rentals at typical pace (median 15d on market — plan ~3-4 weeks tenant-placement turnaround); solid renter incomes; 1,190 units permitted in Whatcom County in 2024 (327 in 5+ unit buildings).
Forward outlook
- In year one you build about $34k of equity ($2k loan paydown + $32k appreciation (10.0% local appreciation)).
- Whatcom County population projected at +28% by 2050 — long-run rental-demand tailwind backs the buy-and-hold thesis.
- By year 2, paydown + projected appreciation supports a ~$54k cash-out refi (75% LTV) — recoverable capital for the next deal without selling this one.
Negotiation context
- It's been on market 25 days — a 2% lower offer ($310k) is reasonable based on typical stale-listing flexibility.
- 5 sale attempts since 9y ago with the ask held roughly flat each time — persistent listings suggest the price (not the market) is what's stuck; bring a comps-based counter.
Questions for the listing agent
- What do current leases actually rent for vs. the listed asking? Can we see a recent rent roll and the last 12 months of T-12 income?
- What does the HOA fee cover, when was the last increase, and are there any pending special assessments or reserve-fund shortfalls?
- Any open or pending special assessments — roof, HVAC, plumbing, elevator, façade? What's the per-unit balance and payoff schedule, and is the seller paying it off at close or rolling it to the buyer?
- Is there a deadline driving the sale (1031 exchange, divorce, estate, relocation)? That informs how much negotiation room exists.
- Schools are B-rated — typically a magnet for longer-tenancy family renters. What's the average tenant stay here, and is there a school-zone premium baked into asking?
- The area grade is low — what's the realistic commute time and amenity access for the typical tenant pool here? Any planned neighborhood developments (good or bad) we should know about?
- What's the average days-on-market for RENTAL listings here right now (not sales)? A rising rental-DOM trend means longer vacancies and softer asking-rent achievability than the comps imply.
- What's the recent tenant-quality profile in this submarket — average credit score on applications, eviction rate, late-payment / NSF rate, and stable-employment percentage? A property-management company in the area should have these aggregated.
- How much new apartment / multifamily construction is in the pipeline within 1–3 miles? Heavy new supply (>2% of stock underway) typically softens rents 12–24 months out; light construction supports rent growth.
Investment metrics
- 1% rule
- 0.62% ✗
- Cap rate
- 3.94%
- Cash-on-cash
- -8.39%
- DSCR
- 0.63
- GRM
- 13.5
CMA / ARV
No comps found within radius.
Projected returns pro-forma
10.0% appreciation · 3.1% rent growth · sell at horizon
- IRR
- 18.4%
- Equity multiple
- 2.50×
- Total profit
- $132,511
- Equity at exit
- $283,777
- IRR
- 17.1%
- Equity multiple
- 5.78×
- Total profit
- $421,525
- Equity at exit
- $611,976
Cash invested: $88,200 (down + closing). Projections, not guarantees.
Landlord ↔ Tenant lean methodology
- Overall (STATE)
- 28 Tenant-Leaning
- State Washington
- 28 Tenant-Leaning · D+8
- County
- — inherits STATE
- City
- — inherits STATE
ZIP-level market 98230
- Home prices YoY
- 14.0%
- Rents YoY
- 3.1%
- Active inventory
- 461
- Price-to-rent
- 13.5×
Monthly cashflow live
- Estimated rent
- $1,946 medium interval (Pro) →
- Mortgage (P&I)
- −$1,652
- Tax from tax record
- −$170 /mo · $2,046/yr
- Insurance
- −$131
- HOA
- −$200
- Vacancy / Maint / Mgmt
- −$409
- Net cashflow
- $-616
Break-even live
Sensitivity live
| Price | -10% $-438 | -5% $-527 | +0% $-616 | +5% $-706 | +10% $-795 |
|---|---|---|---|---|---|
| Rent | -10% $-770 | -5% $-693 | +0% $-616 | +5% $-540 | +10% $-463 |
| Rate | -1.0pp $-458 | -0.5pp $-536 | base $-616 | +0.5pp $-698 | +1.0pp $-781 |
UW: 25.0% down · 7.5% · 30yr · 1.5% tax · 5.0% vac · 8.0% maint · 8.0% mgmt
Financing live
Cash to close
- Down payment
- $78,750
- Closing costs
- $9,450
- Reserves months
- —
- Total cash needed
- —
Loan-product check · same deal, 3 products live
Conventional
25% down · 7.5% · 30yr
- Down + closing
- —
- Monthly P&I
- —
- Monthly cashflow
- —
- DSCR
- —
- Eligible?
- —
Personal DTI + credit; lowest rate.
DSCR
20% down · 8.5% · 30yr
- Down + closing
- —
- Monthly P&I
- —
- Monthly cashflow
- —
- DSCR
- —
- Eligible?
- —
No personal income docs; deal must DSCR.
Hard money
10% down · 12.0% · 12mo
- Down + closing
- —
- Monthly P&I
- —
- Monthly cashflow
- —
- DSCR
- —
- Eligible?
- —
Short-term bridge; refi at stabilization.
Rent comps 3 comps
| Address | Beds | Baths | Sqft | Rent | $/sqft | DOM | Units | Dist |
|---|---|---|---|---|---|---|---|---|
| 399 H St #7 Blaine, WA | 1.0 | 1.0 | 653 | $1,595 | $2.44 | 15d | 1 | 0.23mi |
| 399 H St Unit 3D Blaine, WA | 2.0 | 1.5 | 929 | $1,895 | $2.04 | 15d | 1 | 0.23mi |
| 756 F St Unit 3 Blaine, WA | 2.0 | 1.0 | 800 | $1,525 | $1.91 | 45d | 1 | 0.60mi |
HOA detail condo
- Monthly dues
- $200 · $2,400/yr
- Likely covers
- water
- Assessments
- None detected in remarks — confirm with the listing agent.
Listing history 16 events
-
2026-04-06status Pending
-
2026-03-12$315,000 Active
-
2023-05-19soldstatus $315,000 Closed
-
2023-04-20status Pending
-
2023-04-19price $315,000
-
2023-03-24$320,000 Active
-
2020-02-28soldstatus $220,000 Sold
-
2020-02-06status Pending
-
2020-01-29status Pending Inspection
-
2020-01-23$220,000 Active
-
2017-12-22soldstatus $155,000 Sold
-
2017-12-22soldstatus $155,100
-
2017-11-13status Pending Inspection
-
2017-08-21status Active
-
2017-07-24status Pending Inspection
-
2017-07-15$150,000 Active
ⓘ Source: listings_history table (triggers on properties + properties_extension) + one-shot
backfill from property_details.listing_events for pre-trigger history.
Tax reassessment forecast WA · Resets to sale price
- Current annual tax
- $2,046 · $170/mo
- Projected year-2 tax
- $3,087 · $257/mo
- Expected delta
- +$1,041/yr (+$87/mo · 50.9%)
ⓘ Screening estimate from a state-policy table — verify with the county assessor before closing.
Climate risk First Street
- Flood 1/10 Low FEMA zone X (unshaded) · 0% chance over 30 yrs
- Wildfire 1/10 Low
- Heat 3/10 Moderate 7 d/yr ≥81°F today · 18 d/yr by 30 yrs out
- Wind 1/10 Low
- Air quality 7/10 Severe 11 unhealthy d/yr today · 11 by 30 yrs out
Nearby sold comps map
Loading sold comps map…
Walkable amenities ~0.75 mi
Loading nearby amenities…
Taxation est. · year 1
- Rental income
- $23,351
- − Mortgage interest
- −$17,645
- − Property taxes
- −$2,046
- − Insurance
- −$1,575
- − Repairs & maintenance
- −$1,868
- − Management
- −$1,868
- − HOA
- −$2,400
- − Depreciation
- −$9,164
- Taxable loss
- −$13,215
- Est. tax savings @ 24.0%
- +$3,172
- After-tax cash flow
- $-4,225/yr
For passive investors: Depreciation is non-cash, so a rental often shows a tax loss while cash-flowing — sheltering income. Rental losses are passive: they offset passive income freely, and up to $25,000/yr can offset ordinary (W-2) income if you actively participate and your MAGI is under $100k (phasing out to $0 by $150k); unused losses carry forward. On sale, claimed depreciation is recaptured at up to 25%, and gains may owe capital-gains tax (a 1031 exchange can defer both). Figures are a year-1 estimate at your 24.0% rate — not tax advice; consult a CPA.
Schools (NCES district)
- District
- Blaine School District
- NCES district ID
- 5300570
- Math proficiency
- 49% ▼ -1.00%
- Reading proficiency
- 55% ▼ -2.00%
- Median HH income
- $57,085
- Composite
- 47.05/100
- National rank
- #5128
- State rank
- #120 of 291 in WA
Livability — Blaine
- Score
- 78/100
- State rank
- #125
- US rank
- #2491
Category grades
Schools grade is shown separately in the Schools card above.
Census & demographics
- Census place
- Blaine, WA
- County
- Whatcom County · 209,776 people
- Metro
- Bellingham, WA
- Population (ZIP)
- 18,744
- Household income
- $86,623
- Rent vs Own
- Severe rent burden
- 454.0
Population outlook (Whatcom County) Hauer SSP2
- Today (2025)
- 240,408 people
- By 2030
- 254,667 · +5.9%
- By 2040
- 281,365 · +17.0%
- By 2050
- 307,592 · +27.9%
- By 2075
- 375,576 · +56.2%
- By 2100
- 421,637 · +75.4%
Race, ethnicity, and origin ACS 2023
- Neighborhood character
- Predominantly White (77%)
- Race & ethnicity
- White 77% Two or more races 11% Hispanic / Latino 9% Asian 3% Pacific Islander 2% Black 1%
- Hispanic origin (detail)
- Mexican 5%
- Common ancestry
- Portuguese 6% Iranian 4% Lithuanian 3%
- Foreign-born
- 13% · Canada, China
- Languages at home
- 89% English-only · Spanish 4% Russian/Polish/Slavic 1% Other Indo-European 1%
Political lean MEDSL · Whatcom
- 2024 margin
- Strong D (+24.9) · D 60.8% · R 35.9% · Other 3.3%
- 2008→2024 swing
- +6.9pp toward D · 2008: 18.0pp · 2024: 24.9pp
- All cycles
- 2024: D+24.9 2020: D+23.9 2016: D+17.7 2012: D+12.1 2008: D+18.0
Not yet ingested
- Civics
- —
Market trends
- HPI YoY
- ▲ 106.58%
- Current HPI
- 868.68
- Rent YoY
- ▲ 3.10%
- Metro
- Bellingham, WA
- State GDP YoY
- ▲ 4.65%
- F500 in state
- 22
Industry mix (Fortune 500 HQ in WA)
| Industry | F500 HQs | Revenue |
|---|---|---|
| Retail | 2 | $269B |
|
||
| Technology / Retail | 1 | $638B |
|
||
| Technology | 1 | $245B |
|
||
| Telecommunications | 1 | $38B |
|
||
| Food / Beverage | 1 | $36B |
|
||
| Automotive / Trucks | 1 | $34B |
|
||
Price history
+110.0% since first listed16 events — show timeline
- 2026-04-06 Pending — NWMLS as Distributed by MLS Grid
- 2026-03-12 Listed $315,000 NWMLS as Distributed by MLS Grid
- 2023-05-19 Sold (MLS) $315,000 NWMLS as Distributed by MLS Grid
- 2023-04-20 Pending — NWMLS as Distributed by MLS Grid
- 2023-04-19 Price Changed $315,000 NWMLS as Distributed by MLS Grid
- 2023-03-24 Listed $320,000 NWMLS as Distributed by MLS Grid
- 2020-02-28 Sold (MLS) $220,000 NWMLS as Distributed by MLS Grid
- 2020-02-06 Pending — NWMLS as Distributed by MLS Grid
- 2020-01-29 Pending — NWMLS as Distributed by MLS Grid
- 2020-01-23 Listed $220,000 NWMLS as Distributed by MLS Grid
- 2017-12-22 Sold (Public Records) $155,100 Public Records
- 2017-12-22 Sold (MLS) $155,000 NWMLS as Distributed by MLS Grid
- 2017-11-13 Pending — NWMLS as Distributed by MLS Grid
- 2017-08-21 Relisted — NWMLS as Distributed by MLS Grid
- 2017-07-24 Pending — NWMLS as Distributed by MLS Grid
- 2017-07-15 Listed $150,000 NWMLS as Distributed by MLS Grid
Property tax history
+14.1%/yrLatest (2026): $2,046 · +7.1% YoY. Source: county tax records.
Cash-flow waterfall
monthlySold comps — $/sqft
last 12 mo · ≤1 miLoading sold comps…