84-01 Main St #410 · New York, NY
Flood risk 1/10 · Minimal
- FEMA flood zone
- X (unshaded)
- Chance of flooding over 30 yrs
- 0.0%
- Est. flood insurance / yr
- $507 – $1,088
Fire risk 1/10 · Minimal
- Est. fire insurance / yr
- $691 – $1,283
Heat risk 6/10 · Moderate
- Hot days now (above 99°F)
- 7 days/yr
- Hot days in 30 yrs
- 15 days/yr
Wind risk 6/10 · Moderate
- Chance of severe wind over 30 yrs
- 53.0%
Air-quality risk 4/10 · Minor
- Unhealthy air days now
- 6 days/yr
- Unhealthy air days in 30 yrs
- 6 days/yr
Risk factors via First Street. Map © Google.
Why this score? — see what drove the F grade
The composite is a weighted blend of 9 inputs, each scored 0–100. Each bar is that input's sub-score; the figure is the points it added to the 100-point composite (weight × sub-score).
- ARV discount +7.5/15.0
- 1% rule +5.0/10.0
- Schools +5.0/10.0
- Livability +3.8/5.0
- Cash flow +3.3/30.0
- Rent growth +3.0/5.0
- Condition / age +2.5/5.0
- DSCR +0.0/10.0
- Appreciation +0.0/10.0
$249,000
🖨 Deal sheet (PDF) 📄 Offer letter ✓ Due diligence
Listing remarks MLS
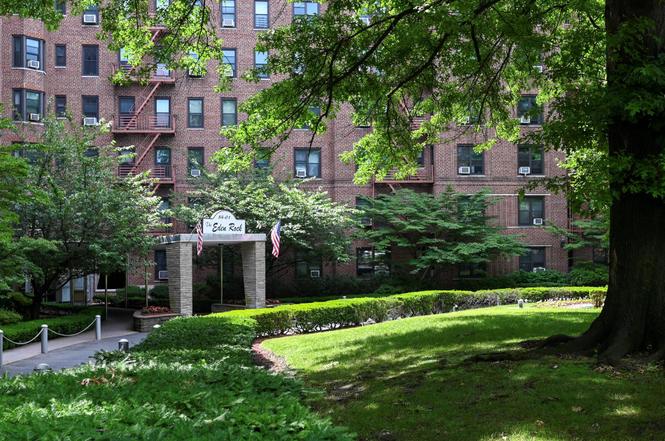
Large 1 Bedroom Corner Unit, Fully Renovated Top To Bottom In Prestigious Eden Rock. Hand-Carved Hardwood Floors, Dining Area, Kitchen With Marble Floors, Granite Counter-Tops, Stainless Steel Appliances, Marble Tiled Bathroom. All Beautifully Renovated. Close To All Public Transportation, Short Walk To E & F Train Station. Doorman, 24/7 Gym, Pet Friendly Building., Additional information: Interior Features:Efficiency Kitchen
Key facts
- Renovated bathroom
- Dining area
- Natural light
Tags
Neighborhood map
What this means for you Summary
Snapshot
- This is a 1-bed/1.0-bath condo listed at $249k.
Deal economics
- At list price, monthly cash flow is $-778 ($-9k/yr) — negative.
- The deal already cash-flows at list — no discount required.
- Meets the 1% rule at list price ($3k rent vs $249k).
- Recommended offer: $219k (12.0% below list) — sets the bar for market timing.
Location & tenants
- Location reads 75/100 on livability (#268 in NY, #4,188 nationally) — a middle-class / working-renter tenant base. Strengths: amenities A+, commute A+, health & safety A; Watch: crime F, cost of living F.
- Zoned schools: Elm Tree Elementary School (math 27% / reading 52%, grade F, #1,444 of 2,108 statewide, top 71%, 806 students, 94% FRL); Is 227 Louis Armstrong (math 52% / reading 69%, grade B+, #153 of 729 statewide, top 21%, 1,528 students, 68% FRL); Midwood High School (math 94% / reading 96%, grade A+, #83 of 1,100 statewide, top 8%, 4,062 students, 73% FRL).
- Market conditions: Rents rising (+2.0%/yr); 171 active listings in the ZIP; 40 comparable units currently listed for rent nearby; rentals at typical pace (median 27d on market — plan ~3-4 weeks tenant-placement turnaround); solid renter incomes; 5,302 units permitted in Queens County in 2024 (4,918 in 5+ unit buildings).
- This rent runs 38% of the median local income ($80k/yr) — at the standard rent-burdened threshold; future hikes will face affordability resistance.
Forward outlook
- Local home prices are declining (-3.0%/yr); year-one equity from $2k of loan paydown is wiped out by about $7k of value loss. Plan a longer hold.
- Queens County population projected at +16% by 2050 — long-run rental-demand tailwind backs the buy-and-hold thesis.
Negotiation context
- It's been on market 163 days — a 12% lower offer ($219k) is reasonable based on typical stale-listing flexibility.
- 6 sale attempts since 8y ago with the ask held roughly flat each time — persistent listings suggest the price (not the market) is what's stuck; bring a comps-based counter.
Risks & watch-outs
- Watch-outs: HOA is 41% of rent; built in 1956 — expect roof / HVAC / electrical / plumbing capex.
- Climate carrying-cost: major wind risk, 53% chance of damaging wind over 30y; extreme-heat days projected 7→15/yr by 2055 (HVAC capex compounding) — expect insurance premiums to compound above CPI over the hold.
Questions for the listing agent
- What do current leases actually rent for vs. the listed asking? Can we see a recent rent roll and the last 12 months of T-12 income?
- It's been on market 163 days. Have you received any prior offers? Is the seller open to a 12% concession, seller financing, or rate buy-down credit?
- Built in 1956 — when were the roof, HVAC, electrical panel, plumbing, and water heater last replaced?
- What does the HOA fee cover, when was the last increase, and are there any pending special assessments or reserve-fund shortfalls?
- Any open or pending special assessments — roof, HVAC, plumbing, elevator, façade? What's the per-unit balance and payoff schedule, and is the seller paying it off at close or rolling it to the buyer?
- Why hasn't it sold? Are there any deal-killer items the seller is aware of (foundation, flood, title, zoning, code violations)?
- Is there a deadline driving the sale (1031 exchange, divorce, estate, relocation)? That informs how much negotiation room exists.
- Schools are B-rated — typically a magnet for longer-tenancy family renters. What's the average tenant stay here, and is there a school-zone premium baked into asking?
- Crime grade is F in this area — have there been break-ins, vandalism, or insurance claims at this property in the last 3 years? What carrier currently insures it and at what premium?
- The area grade is low — what's the realistic commute time and amenity access for the typical tenant pool here? Any planned neighborhood developments (good or bad) we should know about?
- What's the average days-on-market for RENTAL listings here right now (not sales)? A rising rental-DOM trend means longer vacancies and softer asking-rent achievability than the comps imply.
- What's the recent tenant-quality profile in this submarket — average credit score on applications, eviction rate, late-payment / NSF rate, and stable-employment percentage? A property-management company in the area should have these aggregated.
- How much new apartment / multifamily construction is in the pipeline within 1–3 miles? Heavy new supply (>2% of stock underway) typically softens rents 12–24 months out; light construction supports rent growth.
Investment metrics
- 1% rule
- 1.00% ✓
- Cap rate
- 2.55%
- Cash-on-cash
- -13.38%
- DSCR
- 0.40
- GRM
- 8.3
CMA / ARV
No comps found within radius.
Projected returns pro-forma
-3.0% appreciation · 1.97% rent growth · sell at horizon
- IRR
- -43.1%
- Equity multiple
- -0.32×
- Total profit
- $-91,770
- Equity at exit
- $37,127
- IRR
- -86.6%
- Equity multiple
- -1.17×
- Total profit
- $-151,269
- Equity at exit
- $21,529
Cash invested: $69,720 (down + closing). Projections, not guarantees.
Landlord ↔ Tenant lean methodology
- Overall (CITY)
- 0 Strongly Tenant-Friendly
- State New York
- 15 Strongly Tenant-Friendly · D+10
- County
- — inherits STATE
- City New York
- 0 Strongly Tenant-Friendly · D+34
ZIP-level market 11435
- Rents YoY
- 2.0%
- Active inventory
- 171
- Price-to-rent
- 8.3×
Monthly cashflow live
- Estimated rent
- $2,501 high interval (Pro) →
- Mortgage (P&I)
- −$1,306
- Tax est. 1.5%
- −$311 /mo · $3,735/yr
- Insurance
- −$104
- HOA est. from 2 same-building comps
- −$1,033
- Vacancy / Maint / Mgmt
- −$525
- Net cashflow
- $-778
Break-even live
Sensitivity live
| Price | -10% $-606 | -5% $-692 | +0% $-778 | +5% $-864 | +10% $-950 |
|---|---|---|---|---|---|
| Rent | -10% $-975 | -5% $-876 | +0% $-778 | +5% $-679 | +10% $-580 |
| Rate | -1.0pp $-652 | -0.5pp $-714 | base $-778 | +0.5pp $-842 | +1.0pp $-908 |
UW: 25.0% down · 7.5% · 30yr · 1.5% tax · 5.0% vac · 8.0% maint · 8.0% mgmt
Financing live
Cash to close
- Down payment
- $62,250
- Closing costs
- $7,470
- Reserves months
- —
- Total cash needed
- —
Loan-product check · same deal, 3 products live
Conventional
25% down · 7.5% · 30yr
- Down + closing
- —
- Monthly P&I
- —
- Monthly cashflow
- —
- DSCR
- —
- Eligible?
- —
Personal DTI + credit; lowest rate.
DSCR
20% down · 8.5% · 30yr
- Down + closing
- —
- Monthly P&I
- —
- Monthly cashflow
- —
- DSCR
- —
- Eligible?
- —
No personal income docs; deal must DSCR.
Hard money
10% down · 12.0% · 12mo
- Down + closing
- —
- Monthly P&I
- —
- Monthly cashflow
- —
- DSCR
- —
- Eligible?
- —
Short-term bridge; refi at stabilization.
Rent comps 40 comps
| Address | Beds | Baths | Sqft | Rent | $/sqft | DOM | Units | Dist |
|---|---|---|---|---|---|---|---|---|
| 14160 84th Rd Unit 2G Jamaica, NY | 1.0 | 1.0 | 700 | $2,200 | $3.14 | 15d | 1 | 0.03mi |
| 84-03 Lander St Unit 2B Jamaica, NY | 2.0 | 2.0 | 850 | $3,250 | $3.82 | 26d | 1 | 0.03mi |
| 141-35 Pershing Cres Unit 1B Jamaica, NY | 1.0 | 1.5 | 1100 | $2,800 | $2.55 | 22d | 1 | 0.06mi |
| 8455 Daniels St Unit 5H Jamaica, NY | 1.0 | 1.0 | 750 | $2,300 | $3.07 | 20d | 1 | 0.14mi |
| 13915 83rd Ave #717 Jamaica, NY | 1.0 | 1.0 | 800 | $2,400 | $3.00 | 6d | 1 | 0.18mi |
| 13828 Queens Blvd Unit 7A Briarwood, NY | 2.0 | 1.0 | 810 | $3,600 | $4.44 | 26d | 1 | 0.37mi |
| 13828 Queens Blvd Jamaica, NY | 1.0 | 1.0 | 640 | $2,700 | $4.22 | 20d | 1 | 0.37mi |
| 138-28 Queens Blvd Unit 5G Briarwood, NY | 1.0 | 1.0 | 650 | $2,750 | $4.23 | 26d | 1 | 0.37mi |
| 13828 Queens Blvd Unit 2E Briarwood, NY | 1.0 | 1.0 | 700 | $2,600 | $3.71 | 9d | 1 | 0.37mi |
| 7837 Main St Unit 2G Queens, NY | 1.0 | 1.0 | 700 | $2,300 | $3.29 | 26d | 1 | 0.44mi |
| 14112 78th Rd Unit 1G Flushing, NY | 1.0 | 1.0 | 700 | $2,200 | $3.14 | 26d | 1 | 0.44mi |
| 7835 147th St Unit 2E Flushing, NY | 1.0 | 1.0 | 700 | $2,200 | $3.14 | 8d | 1 | 0.47mi |
| 148-16 87th Ave Unit 2 Jamaica, NY | 2.0 | 1.0 | 700 | $2,300 | $3.29 | 19d | 1 | 0.53mi |
| 14832 87th Ave Jamaica, NY | 2.0 | 1.0 | 768 | $2,800 | $3.65 | 20d | 1 | 0.55mi |
| 123-40 83rd Ave Unit 2107 Jamaica, NY | 1.0 | 1.0 | 750 | $2,573 | $3.43 | 26d | 1 | 0.58mi |
| 123-40 83rd Ave Unit 8B Queens, NY | 1.0 | 1.0 | 800 | $2,450 | $3.06 | 26d | 1 | 0.58mi |
| 135-26 78th Ave Unit 2FL Flushing, NY | 2.0 | 1.0 | 900 | $2,800 | $3.11 | 3d | 1 | 0.64mi |
| 13532 Kew Gardens Rd Richmond Hill, NY | 2.0 | 1.0 | 1070 | $2,500 | $2.34 | 26d | 1 | 0.68mi |
| 148-37 88th Ave Queens, NY | 2.0 | 2.0 | 900 | $3,500 | $3.89 | 26d | 1 | 0.70mi |
| 8340 Austin St Unit 7N Kew Gardens, NY | — | 1.0 | 550 | $2,000 | $3.64 | 26d | 1 | 0.75mi |
| 14836 89th Ave Unit 3C Jamaica, NY | 1.0 | 1.0 | 673 | $2,900 | $4.31 | 26d | 1 | 0.79mi |
| 124-14 Metropolitan Ave Unit 2F Kew Gardens, NY | 2.0 | 1.0 | 850 | $2,900 | $3.41 | 26d | 1 | 0.83mi |
| 80-12 165th St Unit 3 Jamaica, NY | 2.0 | 1.5 | 960 | $2,800 | $2.92 | 26d | 1 | 0.91mi |
| 12401 Hillside Ave Richmond Hill, NY | 2.0 | 1.0 | 800 | $2,700 | $3.38 | 1d | 1 | 0.91mi |
| 15501 90th Ave Unit 3R Jamaica, NY | 1.0 | 1.0 | 950 | $2,100 | $2.21 | 26d | 1 | 0.92mi |
| 89-15 Parsons Blvd Unit W6B Jamaica, NY | 1.0 | 1.0 | 725 | $2,100 | $2.90 | 20d | 1 | 0.94mi |
| 123-16 Hillside Ave Unit 1st Fl Jamaica, NY | 2.0 | 1.0 | 869 | $2,700 | $3.11 | 26d | 1 | 0.95mi |
| 16525 Union Tpke Fresh Meadows, NY | 2.0 | 1.0 | 1000 | $2,900 | $2.90 | 26d | 1 | 0.96mi |
| 88-56 162nd St Apt 2D Jamaica, NY | 2.0 | 1.0 | 1000 | $3,000 | $3.00 | 26d | 1 | 0.97mi |
| 8321 Lefferts Blvd Kew Gardens, NY | — | 1.0 | 550 | $2,100 | $3.82 | 26d | 1 | 0.98mi |
| 122-08 Hillside Ave Unit 2 Jamaica, NY | 2.0 | 1.0 | 700 | $2,500 | $3.57 | 26d | 1 | 1.00mi |
| 150-25 72nd Rd Flushing, NY | 1.0 | 1.0 | 700 | $2,300 | $3.29 | 26d | 1 | 1.05mi |
| 14725 94th Ave Jamaica, NY | 1.0 | 1.0 | 525 | $2,825 | $5.38 | 6d | 3 | 1.06mi |
| 71-82 Parsons Blvd Unit 303 Kew Gardens Hills, NY | 2.0 | 1.5 | 900 | $4,000 | $4.44 | 15d | 1 | 1.06mi |
| 71-82 Parsons Blvd Unit 503 Kew Gardens Hills, NY | 2.0 | 1.5 | 900 | $4,000 | $4.44 | 26d | 1 | 1.06mi |
| 71-82 Parsons Blvd Unit 702 Kew Gardens Hills, NY | 1.0 | 1.0 | 1000 | $2,900 | $2.90 | 22d | 1 | 1.06mi |
| 71-82 Parsons Blvd Unit 516 Kew Gardens Hills, NY | 2.0 | 1.5 | 900 | $3,500 | $3.89 | 5d | 1 | 1.06mi |
| 8383 118th St Kew Gardens, NY | 1.0–2.0 | 1.0–1.5 | 900 | $2,600 | $2.89 | 26d | 2 | 1.07mi |
| 83-83 118th St Unit 2E Kew Gardens, NY | 2.0 | 1.5 | 1000 | $3,200 | $3.20 | 16d | 1 | 1.07mi |
| 83-60 118th St Unit 4F Kew Gardens, NY | 2.0 | 1.0 | 800 | $2,500 | $3.12 | 26d | 1 | 1.10mi |
HOA detail condo
- Monthly dues
- $0 · $0/yr
- Likely covers
- gymdoorman
- Assessments
- None detected in remarks — confirm with the listing agent.
Listing history 13 events
-
2026-03-31status Pending
-
2026-01-27status Active
-
2026-01-22historical
-
2026-01-21status Active
-
2026-01-19historical
-
2026-01-18status Active
-
2026-01-12historical
-
2026-01-06status Active
-
2025-10-11status Pending
-
2025-07-11$249,000 Active
-
2019-03-26soldstatus $240,000 Closed 433-char remark
Show marketing remark (433 chars)
Large 1 Bedroom Corner Unit, Fully Renovated Top To Bottom In Prestigious Eden Rock. Hand-Carved Hardwood Floors, Dining Area, Kitchen With Marble Floors, Granite Counter-Tops, Stainless Steel Appliances, Marble Tiled Bathroom. All Beautifully Renovated. Close To All Public Transportation, Short Walk To E & F Train Station. Doorman, 24/7 Gym, Pet Friendly Building., Additional information: Interior Features:Efficiency Kitchen
-
2018-11-08status Under Contract 433-char remark
Show marketing remark (433 chars)
Large 1 Bedroom Corner Unit, Fully Renovated Top To Bottom In Prestigious Eden Rock. Hand-Carved Hardwood Floors, Dining Area, Kitchen With Marble Floors, Granite Counter-Tops, Stainless Steel Appliances, Marble Tiled Bathroom. All Beautifully Renovated. Close To All Public Transportation, Short Walk To E & F Train Station. Doorman, 24/7 Gym, Pet Friendly Building., Additional information: Interior Features:Efficiency Kitchen
-
2018-09-19$229,000 New 433-char remark
Show marketing remark (433 chars)
Large 1 Bedroom Corner Unit, Fully Renovated Top To Bottom In Prestigious Eden Rock. Hand-Carved Hardwood Floors, Dining Area, Kitchen With Marble Floors, Granite Counter-Tops, Stainless Steel Appliances, Marble Tiled Bathroom. All Beautifully Renovated. Close To All Public Transportation, Short Walk To E & F Train Station. Doorman, 24/7 Gym, Pet Friendly Building., Additional information: Interior Features:Efficiency Kitchen
ⓘ Source: listings_history table (triggers on properties + properties_extension) + one-shot
backfill from property_details.listing_events for pre-trigger history.
Climate risk First Street
- Flood 1/10 Low FEMA zone X (unshaded) · 0% chance over 30 yrs
- Wildfire 1/10 Low
- Heat 6/10 Major 7 d/yr ≥99°F today · 15 d/yr by 30 yrs out
- Wind 6/10 Major 53% chance of damaging wind over 30 yrs
- Air quality 4/10 Moderate 6 unhealthy d/yr today · 6 by 30 yrs out
Nearby sold comps map
Loading sold comps map…
Walkable amenities ~0.75 mi
Loading nearby amenities…
Taxation est. · year 1
- Rental income
- $30,017
- − Mortgage interest
- −$13,948
- − Property taxes
- −$3,735
- − Insurance
- −$1,245
- − Repairs & maintenance
- −$2,401
- − Management
- −$2,401
- − HOA
- −$12,396
- − Depreciation
- −$7,244
- Taxable loss
- −$13,353
- Est. tax savings @ 24.0%
- +$3,205
- After-tax cash flow
- $-6,127/yr
For passive investors: Depreciation is non-cash, so a rental often shows a tax loss while cash-flowing — sheltering income. Rental losses are passive: they offset passive income freely, and up to $25,000/yr can offset ordinary (W-2) income if you actively participate and your MAGI is under $100k (phasing out to $0 by $150k); unused losses carry forward. On sale, claimed depreciation is recaptured at up to 25%, and gains may owe capital-gains tax (a 1031 exchange can defer both). Figures are a year-1 estimate at your 24.0% rate — not tax advice; consult a CPA.
Schools (NCES district)
No district data.
Livability — New York
- Score
- 75/100
- State rank
- #268
- US rank
- #4188
Category grades
Schools grade is shown separately in the Schools card above.
Census & demographics
- Census place
- New York, NY
- County
- Queens County · 1,914,869 people
- City population
- 7,731,280
- Metro
- New York-Newark-Jersey City, NY-NJ-PA
- Population (ZIP)
- 56,826
- Household income
- $79,710
- Rent vs Own
- Severe rent burden
- 3361.0
Population outlook (Queens County) Hauer SSP2
- Today (2025)
- 2,546,320 people
- By 2030
- 2,643,059 · +3.8%
- By 2040
- 2,815,563 · +10.6%
- By 2050
- 2,944,423 · +15.6%
- By 2075
- 3,123,338 · +22.7%
- By 2100
- 3,098,688 · +21.7%
Race, ethnicity, and origin ACS 2023
- Neighborhood character
- Highly diverse neighborhood (Simpson 0.78)
- Race & ethnicity
- Hispanic / Latino 30% Black 25% Asian 23% White 13% Two or more races 7%
- Hispanic origin (detail)
- Mexican 3% Puerto Rican 4% Dominican 5%
- Common ancestry
- Scotch-Irish 2% Hispanic 1% Russian 1%
- Foreign-born
- 53% · Canada, China, Jamaica
- Languages at home
- 42% English-only · Spanish 29% Other Indo-European 14% Russian/Polish/Slavic 4%
Political lean MEDSL · Queens
- 2024 margin
- Strong D (+24.6) · D 62.3% · R 37.7%
- 2008→2024 swing
- -26.2pp toward R · 2008: 50.8pp · 2024: 24.6pp
- All cycles
- 2024: D+24.6 2020: D+45.2 2016: D+53.4 2012: D+58.5 2008: D+50.8
Not yet ingested
- Civics
- —
Market trends
- HPI YoY
- ▼ -399.00%
- Current HPI
- 206.3955
- Rent YoY
- ▲ 1.97%
- Metro
- New York-Newark-Jersey City, NY-NJ-PA
- State GDP YoY
- ▲ 2.60%
- F500 in state
- 92
Industry mix (Fortune 500 HQ in NY)
| Industry | F500 HQs | Revenue |
|---|---|---|
| Financial Services | 10 | $950B |
|
||
| Consumer Goods | 9 | $162B |
|
||
| Insurance | 4 | $225B |
|
||
| Telecommunications | 2 | $144B |
|
||
| Pharmaceuticals | 2 | $112B |
|
||
| Media / Entertainment | 2 | $69B |
|
||
Price history
+8.7% since first listed13 events — show timeline
- 2026-03-31 Pending — OneKey® MLS as Distributed by MLS Grid
- 2026-01-27 Relisted — OneKey® MLS as Distributed by MLS Grid
- 2026-01-22 Listing Removed — OneKey® MLS as Distributed by MLS Grid
- 2026-01-21 Relisted — OneKey® MLS as Distributed by MLS Grid
- 2026-01-19 Listing Removed — OneKey® MLS as Distributed by MLS Grid
- 2026-01-18 Relisted — OneKey® MLS as Distributed by MLS Grid
- 2026-01-12 Listing Removed — OneKey® MLS as Distributed by MLS Grid
- 2026-01-06 Relisted — OneKey® MLS as Distributed by MLS Grid
- 2025-10-11 Pending — OneKey® MLS as Distributed by MLS Grid
- 2025-07-11 Listed $249,000 OneKey® MLS as Distributed by MLS Grid
- 2019-03-26 Sold (MLS) $240,000 OneKey® MLS as Distributed by MLS Grid
- 2018-11-08 Pending — OneKey® MLS as Distributed by MLS Grid
- 2018-09-19 Listed $229,000 OneKey® MLS as Distributed by MLS Grid
Cash-flow waterfall
monthlySold comps — $/sqft
last 12 mo · ≤1 miLoading sold comps…