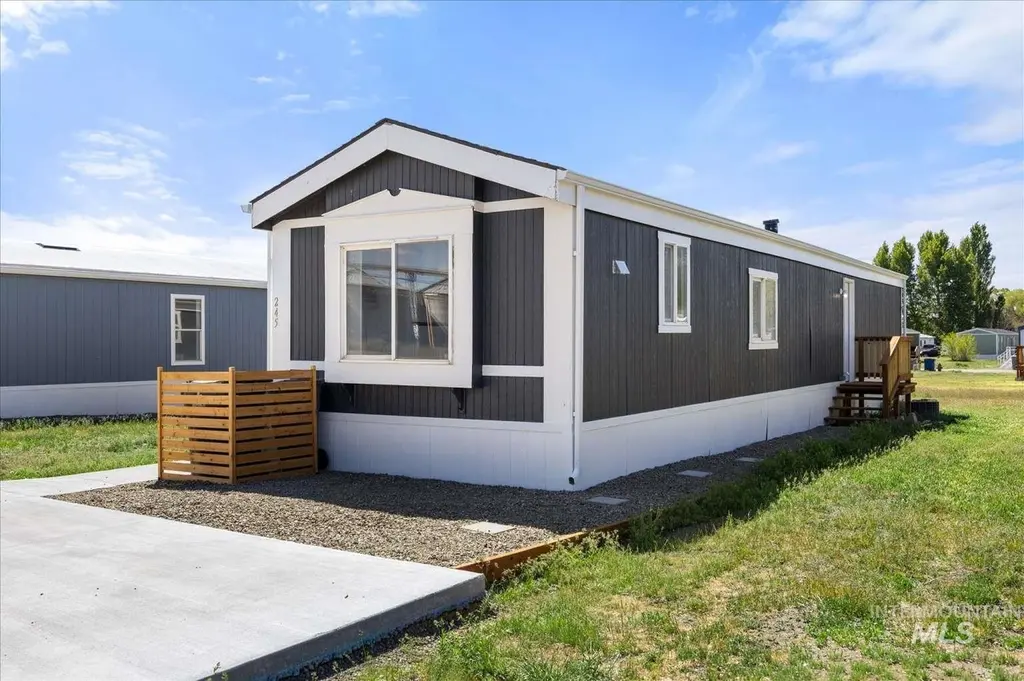
245 W 9th · Mountain Home, ID
Flood risk No data
- FEMA flood zone
- —
- Chance of flooding over 30 yrs
- —
- Est. flood insurance / yr
- —
Fire risk No data
- Est. fire insurance / yr
- —
Heat risk No data
- Hot days now (above threshold)
- —
- Hot days in 30 yrs
- —
Wind risk No data
- Chance of severe wind over 30 yrs
- —
Air-quality risk No data
- Unhealthy air days now
- —
- Unhealthy air days in 30 yrs
- —
Risk factors via First Street. Map © Google.
Why this score? — see what drove the B+ grade
The composite is a weighted blend of 9 inputs, each scored 0–100. Each bar is that input's sub-score; the figure is the points it added to the 100-point composite (weight × sub-score).
- Cash flow +30.0/30.0
- ARV discount +15.0/15.0
- 1% rule +10.0/10.0
- DSCR +10.0/10.0
- Rent growth +4.1/5.0
- Livability +3.8/5.0
- Schools +3.1/10.0
- Condition / age +2.5/5.0
- Appreciation +0.0/10.0
$45,000
🖨 Deal sheet 📄 Offer letter ✓ Due diligence
Listing remarks
Welcome to this well-maintained 1994 manufactured home located in Eagle Wing Mobile Home Park in Mountain Home! This 2-bedroom, 1-bath home offers comfortable, affordable living with a functional layout and inviting living spaces. Enjoy year-round comfort with central heating and air conditioning, making this home a great fit for all seasons. The layout is designed for easy everyday living, with practical use of space throughout. A concrete parking pad provides convenient off-street parking with durability and low maintenance. A great opportunity for affordable, low-maintenance living in a welcoming community! Cash or chattel loan accepted. Park requires a 12-month lot lease. Lot rent is $6
Key facts
- Built 1994
- Listed 42 days
Property features AI
Finance
- Other: Located in Mtn Home-Elmore area; subdivision not applicable
- Financial info: Annual taxes noted (not included in detail extraction)
Exterior
- Home design: Mobile/manufactured home on a rented lot; Built in 1994
- Construction: Manufactured home construction
- Exterior features: Small lot (approx. 5,999 sq ft)
Interior
- Bedrooms: 2 bedrooms, both on the main level
- Bathrooms: 1 bathroom
- Heating & cooling: No heating; No cooling
- Interior features: Main-level living spaces
Neighborhood map
What this means for you Summary
Snapshot
- This is a 2-bed/1.0-bath manufactured listed at $45k.
Deal economics
- At list price, monthly cash flow is $879 ($11k/yr) — positive.
- The deal already cash-flows at list — no discount required.
- Meets the 1% rule at list price ($1k rent vs $45k).
- Recommended offer: $44k (3.0% below list) — sets the bar for market timing.
- Cap rate 29.7% vs local median 3.1% in Mountain Home — top-decile yield for the area; either an underpriced asset or a hidden risk that comps aren't pricing in. Stress-test before assuming the spread holds.
Location & tenants
- Location reads 76/100 on livability (#26 in ID, #3,741 nationally) — a middle-class / working-renter tenant base. Strengths: cost of living A+, housing A+, health & safety A+; Watch: employment D, amenities F, commute F.
- Mountain Home District (town): math 28% / reading 44% proficiency, ranked #78 of 92 in ID (top 85%) — families likely to look elsewhere, expect single-tenant / working-renter base with shorter leases.
- Zoned schools: Mountain Home Sr High School (math 21% / reading 44%, grade F, #117 of 169 statewide, top 70%, 960 students, 33% FRL).
- Market conditions: Rents rising fast (+6.2%/yr); 347 active listings in the ZIP; 129 units permitted in Elmore County in 2024 (0 in 5+ unit buildings).
Forward outlook
- Local home prices are declining (-3.0%/yr); year-one equity from $311 of loan paydown is wiped out by about $1k of value loss. Plan a longer hold.
- Elmore County population projected at -35% by 2050 — secular population decline; favor cash flow + early exit over multi-decade hold.
- At projected returns (-3.0% appreciation + 6.2% rent growth), your $13k cash investment doubles in ~2 years — after that, you're playing with house money.
Negotiation context
- It's been on market 43 days — a 3% lower offer ($44k) is reasonable based on typical stale-listing flexibility.
Questions for the listing agent
- It's been on market 43 days. Have you received any prior offers? Is the seller open to a 3% concession, seller financing, or rate buy-down credit?
- Is there a deadline driving the sale (1031 exchange, divorce, estate, relocation)? That informs how much negotiation room exists.
- What's the average days-on-market for RENTAL listings here right now (not sales)? A rising rental-DOM trend means longer vacancies and softer asking-rent achievability than the comps imply.
- What's the recent tenant-quality profile in this submarket — average credit score on applications, eviction rate, late-payment / NSF rate, and stable-employment percentage? A property-management company in the area should have these aggregated.
- How much new for-sale + rental construction is in the pipeline within 1–3 miles? Heavy new supply typically softens prices + rents 12–24 months out; constrained supply supports both.
Investment metrics
- 1% rule
- 3.29% ✓
- Cap rate
- 29.72%
- Cash-on-cash
- 83.67%
- DSCR
- 4.72
- GRM
- 2.5
CMA / ARV
- ARV (on-the-fly)
- $89,376
- Comps found
- 2
Show comp detail 2 sales within ~0.75 mi
| Address | Dist | Beds/Ba | Sqft | Sold | Price | $/sf | Match |
|---|---|---|---|---|---|---|---|
| 370 W 12th South #31 | 0.31mi | 2/1.0 | 746 (-5%) | 11mo | $85,000 | $114 | 68 |
| 370 W 12th S #28 | 0.31mi | 3/2.0 (+1) | 880 (+12%) | 16mo | $90,000 | $102 | 43 |
Match score weights: distance 35% · size 25% · config 20% · recency 20%. Top-matched comps best support the ARV.
Projected returns pro-forma
-3.0% appreciation · 6.23% rent growth · sell at horizon
- IRR
- 87.6%
- Equity multiple
- 5.26×
- Total profit
- $53,641
- Equity at exit
- $6,710
- IRR
- 91.4%
- Equity multiple
- 12.16×
- Total profit
- $140,579
- Equity at exit
- $3,891
Cash invested: $12,600 (down + closing). Projections, not guarantees.
Landlord ↔ Tenant lean methodology
- Overall (STATE)
- 91 Strongly Landlord-Friendly
- State Idaho
- 91 Strongly Landlord-Friendly · R+18
- County
- — inherits STATE
- City
- — inherits STATE
ZIP-level market 83647
- Home prices YoY
- -31.4%
- Rents YoY
- 6.2%
- Active inventory
- 347
- Price-to-rent
- 2.5×
Monthly cashflow live
- Estimated rent
- $1,480 medium interval (Pro) →
- Mortgage (P&I)
- −$236
- Tax from tax record
- −$36 /mo · $431/yr
- Insurance
- −$19
- HOA
- −$0
- Vacancy / Maint / Mgmt
- −$311
- Net cashflow
- $879
Break-even live
UW: 25.0% down · 7.5% · 30yr · 1.5% tax · 5.0% vac · 8.0% maint · 8.0% mgmt
Financing live
Cash to close
- Down payment
- $11,250
- Closing costs
- $1,350
- Reserves months
- —
- Total cash needed
- —
Loan-product check · same deal, 3 products live
Conventional
25% down · 7.5% · 30yr
- Down + closing
- —
- Monthly P&I
- —
- Monthly cashflow
- —
- DSCR
- —
- Eligible?
- —
Personal DTI + credit; lowest rate.
DSCR
20% down · 8.5% · 30yr
- Down + closing
- —
- Monthly P&I
- —
- Monthly cashflow
- —
- DSCR
- —
- Eligible?
- —
No personal income docs; deal must DSCR.
Hard money
10% down · 12.0% · 12mo
- Down + closing
- —
- Monthly P&I
- —
- Monthly cashflow
- —
- DSCR
- —
- Eligible?
- —
Short-term bridge; refi at stabilization.
Listing history 18 events
-
2026-06-19days on market $45,000 Active 43 DOM
-
2026-06-18days on market $45,000 Active 42 DOM
-
2026-06-17days on market $45,000 Active 41 DOM
-
2026-06-16days on market $45,000 Active 40 DOM
-
2026-06-15days on market $45,000 Active 39 DOM
-
2026-06-14days on market $45,000 Active 37 DOM
-
2026-06-12days on market $45,000 Active 36 DOM
-
2026-06-09days on market $45,000 Active 33 DOM
-
2026-06-08days on market $45,000 Active 32 DOM
-
2026-06-07days on market $45,000 Active 31 DOM
-
2026-06-07days on market $45,000 Active 30 DOM
-
2026-06-04days on market $45,000 Active 27 DOM
-
2026-06-02days on market $45,000 Active 26 DOM
-
2026-06-01days on market $45,000 Active 25 DOM
-
2026-05-31days on market $45,000 Active 24 DOM
-
2026-05-31days on market $45,000 Active 23 DOM
-
2026-05-15price $45,000
-
2026-05-07$48,000 Active
ⓘ Source: listings_history table (triggers on properties + properties_extension) + one-shot
backfill from property_details.listing_events for pre-trigger history.
Tax reassessment forecast ID · Resets to sale price
- Current annual tax
- $431 · $36/mo
- Projected year-2 tax
- $431 · $36/mo
- Expected delta
- $0/yr ($0/mo · -0.0%)
ⓘ Screening estimate from a state-policy table — verify with the county assessor before closing.
Nearby sold comps map
Loading sold comps map…
Walkable amenities ~0.75 mi
Loading nearby amenities…
Taxation est. · year 1
- Rental income
- $17,760
- − Mortgage interest
- −$2,521
- − Property taxes
- −$431
- − Insurance
- −$225
- − Repairs & maintenance
- −$1,421
- − Management
- −$1,421
- − Depreciation
- −$1,309
- Taxable income
- $10,433
- Est. tax owed @ 24.0%
- −$2,504
- After-tax cash flow
- $8,039/yr
For passive investors: Depreciation is non-cash, so a rental often shows a tax loss while cash-flowing — sheltering income. Rental losses are passive: they offset passive income freely, and up to $25,000/yr can offset ordinary (W-2) income if you actively participate and your MAGI is under $100k (phasing out to $0 by $150k); unused losses carry forward. On sale, claimed depreciation is recaptured at up to 25%, and gains may owe capital-gains tax (a 1031 exchange can defer both). Figures are a year-1 estimate at your 24.0% rate — not tax advice; consult a CPA.
Schools (NCES district)
- District
- Mountain Home District
- NCES district ID
- 1602250
- Math proficiency
- 28% ▼ -5.00%
- Reading proficiency
- 44% ▲ 1.00%
- Median HH income
- $44,262
- Composite
- 30.57/100
- National rank
- #6203
- State rank
- #78 of 92 in ID
Livability — Mountain Home
- Score
- 76/100
- State rank
- #26
- US rank
- #3741
Category grades
Schools grade is shown separately in the Schools card above.
Census & demographics
- Census place
- Mountain Home, ID
- County
- Elmore County · 22,952 people
- City population
- 22,952
- Metro
- Mountain Home, ID
- Population (ZIP)
- 22,952
- Household income
- $63,760
- Rent vs Own
- Severe rent burden
- 317.0
Population outlook (Elmore County) Hauer SSP2
- Today (2025)
- 22,644 people
- By 2030
- 21,112 · -6.8%
- By 2040
- 17,768 · -21.5%
- By 2050
- 14,629 · -35.4%
- By 2075
- 9,144 · -59.6%
- By 2100
- 6,006 · -73.5%
Race, ethnicity, and origin ACS 2023
- Neighborhood character
- Predominantly White (72%)
- Race & ethnicity
- White 72% Hispanic / Latino 18% Two or more races 13% Asian 3% Black 2% Native American 1%
- Hispanic origin (detail)
- Mexican 15%
- Common ancestry
- Portuguese 4% Lithuanian 3% Scotch-Irish 3%
- Foreign-born
- 10% · Canada
- Languages at home
- 85% English-only · Spanish 10% Russian/Polish/Slavic 2% Chinese 1%
Political lean MEDSL · Elmore
- 2024 margin
- Solid R (+48.5) · D 24.5% · R 73.0% · Other 2.5%
- 2008→2024 swing
- -12.1pp toward R · 2008: -36.4pp · 2024: -48.5pp
- All cycles
- 2024: R+48.5 2020: R+45.5 2016: R+47.0 2012: R+33.9 2008: R+36.4
Not yet ingested
- Civics
- —
Market trends
- HPI YoY
- ▼ -108.42%
- Current HPI
- 236.3087
- Rent YoY
- ▲ 6.23%
- Metro
- Mountain Home, ID
- State GDP YoY
- ▲ 4.51%
- F500 in state
- 6
Industry mix (Fortune 500 HQ in ID)
| Industry | F500 HQs | Revenue |
|---|---|---|
| Retail | 1 | $79B |
|
||
| Technology | 1 | $25B |
|
||
| Food / Agriculture | 1 | $6B |
|
||
Price history
-6.2% since first listed2 events — show timeline
- 2026-05-15 Price Changed $45,000 IMLS
- 2026-05-07 Listed $48,000 IMLS
Cash-flow waterfall
monthlySold comps — $/sqft
last 12 mo · ≤1 miLoading sold comps…